?> July 2021 - projectfinance

Trading Psychology and Philosophy: Master Your Emotions

Parts of the brain: psychology

Without understanding the key roles that psychology and philosophy play in investing and trading, your monetary ambitions are doomed to fail. 

You may get lucky here and there, but unless you have conviction and mastery over the myriad of emotions the stock market awakens in most humans, failure is an inevitability.

Let’s jump right into it by comparing psychology and philosophy. 

   Highlights

  • Trader Psychology teaches us how our individual mind reacts to market conditions.
  • Trader Philosophy gives us the tools to overcome our psychological shortcomings.
  • The best teacher is personal experience.
  • Without a solid philosophical bedrock, psychology on its own helps traders little. 
  • Most successful investors have their own personal philosophy on life.

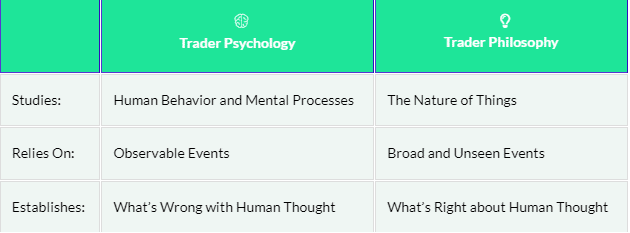
Psychology vs Philosophy

Trader Psychology
Trader Philosophy
Studies:
Human Behavior and Mental Processes
The Nature of Things
Relies On:
Observable Events
Broad and Unseen Events
Establishes:
What’s Wrong with Human Thought
What’s Right about Human Thought

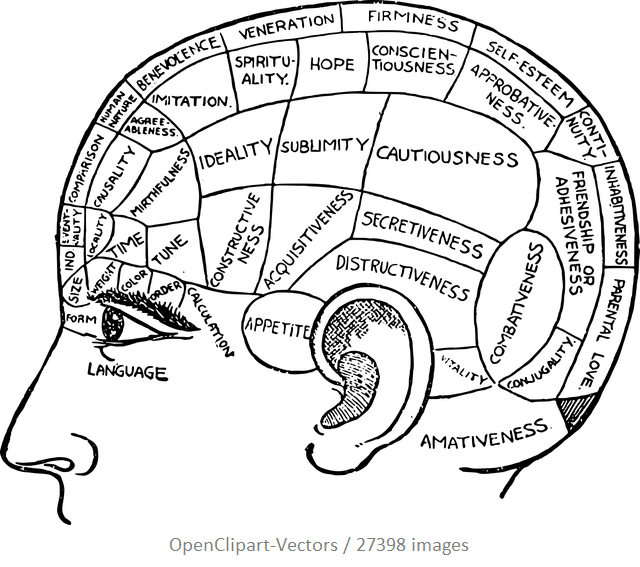
Trader Psychology teaches us how our individual mind reacts to market conditions. Without an intuitive understanding of how our individual brains work, successful investing will be difficult and trading impossible. Being tuned into one’s own psychological makeup helps us better control our emotional response. This can help us become more disciplined and agile traders.

Trader Philosophy gives us the tools to overcome our psychological shortcomings. Incorporating philosophy into the trading process can help put a game plan into our trading and investing decisions. The result of trading philosophy is a firm grasp on and acceptant of risk tolerance, goals and market expectations. 

The world’s best traders are both psychologically aware and philosophically minded. When these two colors of thought get together, the resulting color is more often than not green. 

In this article, projectfinance takes a look at the link between psychology and philosophy in trading.

I believe trading to be more of an art than a science. Since philosophy is more artful than psychology, this article will focus primarily on how incorporating philosophy into our trading decisions (and life decisions) can make us more successful. 

Since we will be looking at trading philosophy as an art, we will not get into cut-and-dry topics of investment philosophy (risk-management, diversification, algorithmic trading, etc.) and behavioral finance. Instead, we will focus more liberally on philosophy as a school of thought.

A Trader Fails Miserably: A Case Study About Myself.

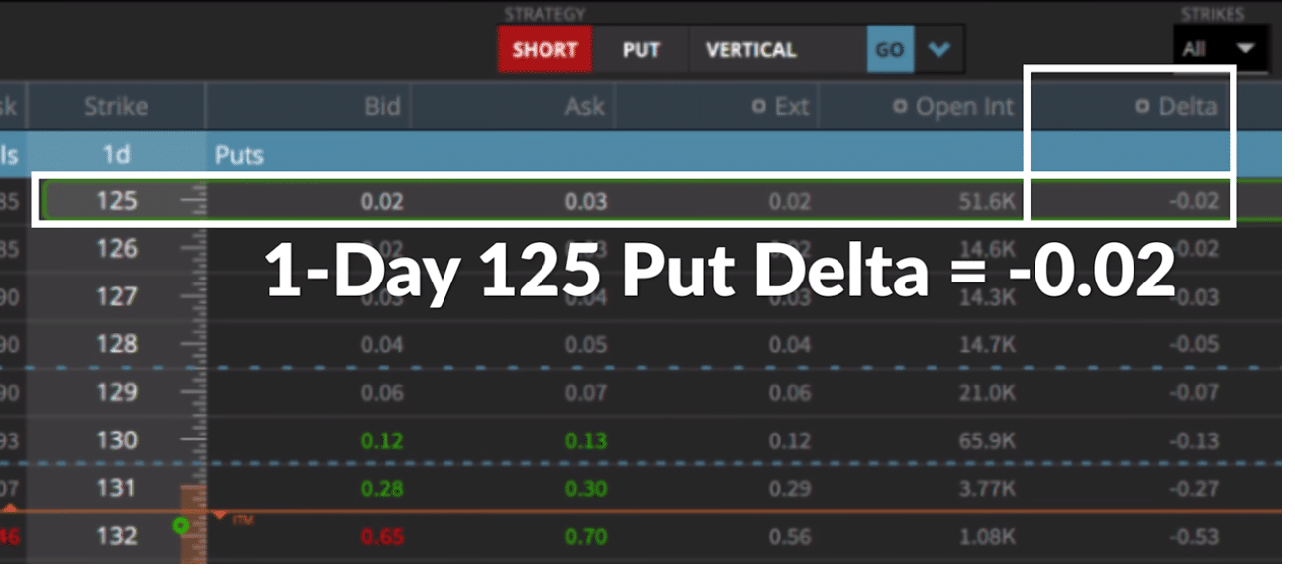
About a decade ago, I put a small trade on in my account. It was a well-thought-out trade. The market was a bit overheated, and volatility was cheap. I placed an options trade that would allow me to capitalize should the market become bearish. It was a high-reward, low-risk trade that I had used successfully before.

I calculated there would be about a 50% chance the market would sell-off by the end of the week. Just a mild selloff would provide my long volatility position with a profit of over 100%. I was comfortable with losing it all. 

If you have a 50% chance of making over 100%, isn’t that a good trade? I put a relatively small trade on Monday morning for options expiring on Friday. 

It was a well-thought-out trade. Had I stuck to my original plan, I would have indeed turned a very nice profit. 

But that’s not what happened. What actually did happen may very well be a great case study for a behavioral psychologist analyzing the irritation decisions of individual investors.

Doubling Down on a Losing Trade

Untitled design

By the end of the day Monday, the market sell-off did not come. I was in the red. 

Great – double down, right?

Tuesday morning the market opened higher. That’s ok, right? Double down again! 

Wednesday morning, the market opened higher yet again. With a little reluctance and less conviction, I doubled down again.

Guess what happened Thursday morning? The market opened higher, and I doubled down again.  

My position was becoming massive, to the point I couldn’t take my eyes off the trading platform, which blinked green, only green, all day long. 

And then came Friday. Guess what the market did on Friday? The bell went off, and S&P 500 futures opened up…higher. 

I threw in the towel. 

The market wasn’t going to sell-off. I was wrong. Had I only had my relatively small initial position on, I wouldn’t care. But the position had since grown to about 10 times its original size. 

Panic Trading 101

So since I was indeed wrong, wasn’t there still a way to break even on the mounting losses? Didn’t one of those ex CBOE traders sitting all around me once say “don’t fight the trend”?

Ok. It’s not too late.

I panicked and soon found a solution. Everybody at the trading desk around me was long and making money; why wasn’t I? Why can’t I just flip the position on its head and go long?

So that’s what I did. And I felt good about it. 

I was working at a trading desk at the time and decided to give my eyes a break and take a stroll around the office.

Ten minutes later, I saw from a coworker’s monitor a chart of the S&P 500. It appeared to be going down. I passed another screen on my walk; whatever chart he was looking at, it was going down too. I went to the restroom, splashed some water on my face then returned to my desk. 

We had about 100 TVs in the office, all playing CNBC. There was a “Breaking News” alert on all of these TVs:

“Breaking news!!! Markets Reverse gains in the last hour of trading; DOW down on the week.”

When the bell rang that Friday, I stared at my monitor with a white face and an open mouth:

“What the hell just happened?”

I was right! My original trade made a huge return! Where did that trade go? What happened? Mommy?

And that concludes the story of one of the worst trade management strategies in history.

The Philosophy of Trading (and Living)

I have personally found philosophy to be a panacea for my (mostly) benign psychological shortcomings. 

Shortly after moving to Chicago (and before the above trade happened), I had to take numerous FINRA exams. I snuck into a university library to study for these tests. 

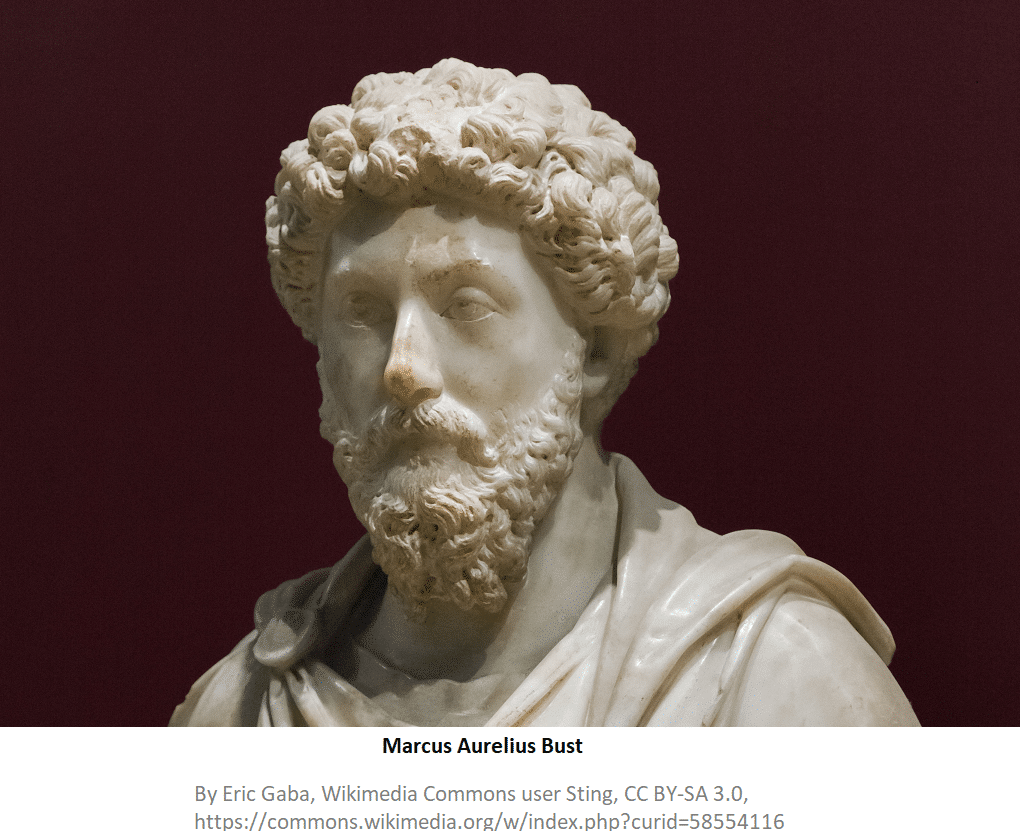
During these long nights, I would sometimes take breaks and roam the philosophy section, taking a particular interest in the old Greek and Roman Stoics. It awoke something in me – it was vague but real. 

These authors were introduced to me by a college professor I once had. He was an old and eccentric man who was so in love with the old Greeks philosophers we couldn’t say the word “Greek” without getting misty-eyed. Truly! We as students, not having been through what he had been through, used to poke fun at him outside of class.

I returned to that library the Saturday morning after I lost my ass, but this time I was thirsty. I devoured the material that I could care less about in college, looking for some connection and solid ground; searching for the cure to my numerous psychological ailments. 

That was about 15 years ago, and on the other side of the monitor I write these words on is a small library of all those books of eternal wisdom I perused so long ago. From all the words of those old sages, I was able to create my own philosophy. Never have I since that day put on such a bad trade. I have had bad trades of course, but never that bad.

Philosophy is Greater than Psychology in Trading

You can analyze behavioral finance and trading psychology all day long, but without conviction and inspiration, your toolbox will be very prosaic and thin. 

There are innumerable psychological quirks that new and seasoned investors alike can experience. They are limited only by the infintestitude of the human mind. Let’s look at three trading sins I committed when I had that horrible week.

  1.  Fear of Missing Out (F.O.M.O.)  Trading
    • Fear that a trader feels when missing out on a potentially winning investment.
  2. Revenge Trading
    • When an investor forces trades to make up for a previous loss.
  3. Gambler’s Fallacy
    • Occurs when an investor believes an event is more or less likely to occur based on previous events. E.g., the belief a coin will land on heads if it landed on tails the past 5 times. 

Now, what are these but mere helpful words to describe trading psychology? Sure to be forgotten. They tell you what is wrong with living, but not how to correct oneself. If you have the roots of a  personal philosophy deeply planted, however, you will never have to worry about falling victim to any of the swaying branches of the innumerable psychological quirks and fallacies that plague the human condition.  

Trading Psychology Interpreted Through Philosophy

Shakespeare

Shakespeare

"...full of sound and fury, Signifying nothing."

machiavelli

Machiavelli

"Never was anything great achieved without danger."
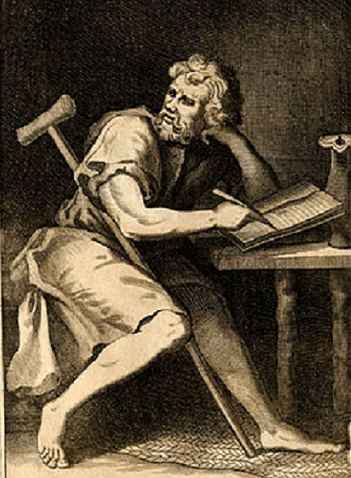
Epectitus

Epictetus

"No man is free who is not master of himself."

Now let’s look at these fallacies through the lens of a few of my favorite philosophical minds

Machiavelli gives me the courage to place risk-on trades. Epictetus challenges me to not become a slave to my emotions. Shakespeare persuades me to avoid the noise of the events around me.

In other words, their advice is actionable rather than just vague definitions. 

With all that said, I believe one-off quotes are in themselves quite worthless. They are the equivalent of a cheat sheet. They have the soulful nourishment of a small fry from McDonald’s.  

Becoming adept at anything takes innumerable hours of patience and commitment. You have to work for it. None of the 49ers struck gold the first time they swung their pickaxe; they all had to dig through layers of barely penetrable strata. 

Where Trading Philosophy Comes From

I know millionaire traders who are honestly not that bright, and I have worked with surgeon day traders who lost boatloads of cash speculating on the markets. The differentiator of these two people is not that one understands the Gambler’s Fallacy and one does not; the difference is the former has their own personal brand of philosophy in life and the latter has none.

That isn’t to say that the successful traders I know spend their weekends in the philosophy department of libraries. 

Maybe they learned their philosophical code through difficult times or even the advice of an old relative or coworkers. Maybe it was as large as an 8 year Oxford education, or perhaps it came from something overheard by a passerby on Michigan Avenue. Who knows where they picked it up, it works, and that’s all that matters. 

I’m sure you know such people in your line of work. Think about one of these people you respect and admire for a moment.

What is it about them that inspires you? Chances are, it’s how they react to things. There’s also a good chance they were not always this way. Sage-like minds are not born, they’re made.

How Do You React Emotionally to the Stock Market?

How you react to an event is truly all that matters in investing and life. It’s the very definition of character. If I never had that horrific week of trading, I may have never developed my love for reading old philosophy, or any of the other literature I have enjoyed over the past 15 years. Nor would I have probably challenged me to become a successful trader. What’s the value of that?

Save death, it’s never what happens to you, but always how you react to the thing. Cliches exist for a reason; it’s generally because they work. If you squeeze hard enough you can almost always make lemonade out of lemons. 

Sometimes, after I have a particularly bad week in investing/trading, I’ll try to get an equivalent (arbitrary) monetary amount of culture and education from my city. I’ll roam a museum, or get a cheap seat at the orchestra, or just wander 20 miles until my legs collapse, then hop on the Chicago “El” with a numb smile and return home.

So next time some psychological quirk sends your trading account into a tailspin, try looking in the mirror to find out why, and make a plan as to what can be done.

Identifying Psychological and Philosophical Problems

 I have three specific people on my mind as I write this article. They are friends, some close, some not, but each one is currently, or has been in the past, very successful at trading options.

All three of these individuals have one train in common: they are all incredibly steady. 

It is very rare for any of them to get visibly angry under any circumstances. It is as though they all anticipated what was going to happen to them, no matter how positive or negative the outcome.

I was at an airport bar next to one of these individuals several years ago. I had heard earlier that day from other traders that he had had his best trading day ever. Retirement kind of money. 

I fished to get something out of him, but my hook came back empty every time. He never showed his cards. 

He had a contented look about him, but that was always there, no matter what the market was doing. What was he thinking? How can one not be celebrating in this situation? And who turns down a “Baby Guinness” shot!

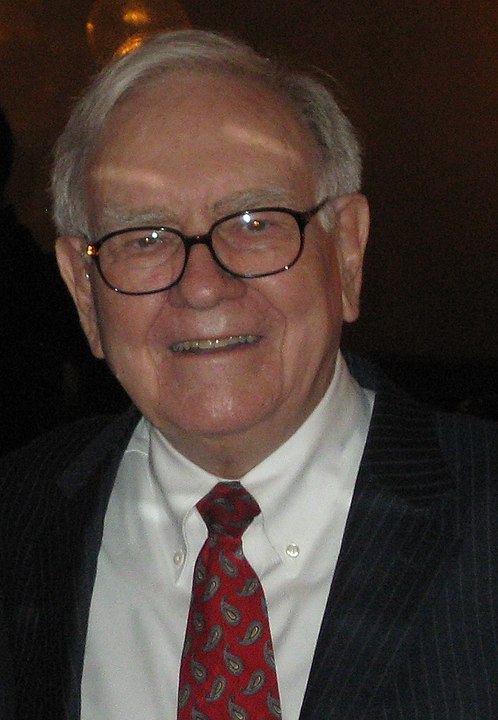
Perhaps we can get a window into his mind by reading a quote from Paul Tudor Jones, one of the most successful traders the world has seen. 

This is easier said than done. I’m still working at it, but I’ve made progress. I can only gauge this progress by comparing my current self to the emotionally volatile trader I once was. 

A violent emotional reaction to an undesirable market event is a sure sign of psychological instability and philosophical bankruptcy. 

If this sounds familiar to how you react to a losing trade, you may need to do some introspection to turn things around. Turn your phone off from the insatiable noise of modernity. Take the time to get to know yourself. Do some walking; do some reading. It’s really that simple.

Final Word

To be a better trader, you need to learn to be a better thinker. This requires hard work. Mastering your emotions is easier said than done, and the only advice I can give with absolute certainty is that the answer won’t be found in a 2,000-word article on the internet. 

Trading and investing in the markets can be thought of as a war. If you have the right army (philosophy) you can conquer all the battles (psychology). 

Building the army is the hard part. You’ll know it only when you have it. If you rush it and dive into the markets without a mastery of yourself, you’ll get burnt. The vast majority of retail traders lose money, with 85% underperforming the benchmark.

Only when you have created a rock-solid philosophy on life and trading should you think about actively trading and investing. If you jumped the gun (like me), the process may be easier, as you have some empirical pain to build off of.

In the stock market, we must “know thy enemy”. The enemy is not a poor earnings report, faulty technical analysis, nor is it volatility; it’s ourselves. 

If you’re looking for inspirational reads on how to master the art of life and trading (they are synonymous), here are a few books that have helped me tremendously in life. If you have a kindle, they should all be free. All books published before 1924 are in the public domain now. If you dig a little, you should be able to find any books published before this date for free!

If you’d like to dive deeper into trading psychology, please check out our article, “Emotional Investing is Inevitable. Learn how to Cope.”

Book Recommendations

Wage Inflation and the Stock Market: 4 Investment Ideas in 2022

money falling

In a recent interview with CNBC, Jeffery Gundlach, AKA “The Bond King”, surprised investors with his minimal concern for commodity-based inflation. Gundlach doesn’t believe commodity inflation is here to stay but stressed particular concern about the sticky nature of wage inflation. 

In this article, projectfinance explores wage push inflation in detail. We will look at how rising wages played out in the 1970s, the current signs that wage inflation is here to stay into 2022, as well as review a few sectors that historically perform well during inflationary times. 

   Highlights

  • Wage push inflation could be a catalyst to broad inflation.
  • The 1970s showed us how bad wage push inflation can become. 
  • Lower labor force participation exasperates wage inflation.
  • Wages are soaring in 2021, particularly in retail. 
  • Gold, crypto, robotics, and emerging markets may be winners from US inflation.

Fewer Workers = Higher Prices

Just about every American who has left their homes in the past few months has seen the numerous “help wanted” signs peppering main streets. Because of enhanced unemployment benefits, health worries and child day-care concerns, the labor force participation rate has plummeted. The below chart from the St. Louis Fed shows us just how much. 

One of the results of this unprecedented exodus from the labor force is inflation. With less supply comes higher prices. Of particular concern is wage inflation, which may prove to be less transitory than, say, the price of a barrel of oil. Why?

It’s a lot easier for Chevron to decrease the price of a gallon of gasoline by a dollar than it is to decrease the hourly salary of that employee pumping the gas by the same amount. Wage inflation, as remarked about by Gundlach in an interview on CNBC, is “Hard to slow down once it starts.”

Gundlach on Wage Inflation

Wage inflation is dangerous because of its long-lasting, and wide-sweeping reverberations on overall inflation. If you have to pay your workers more, who is going to absorb that cost? Generally, (and if possible), those costs are pushed on to the general public in the form of increased prices. This leads to something called “wage push inflation”.

Every American who lived through the 1970s knows how this story plays out. 

If History Repeats Itself...

American prosperity soared during the 1960s. On the tail of this party came the great hangover of the 1970s, a decade in American history with unparalleled inflation and a stagnating stock market. Of particular concern during this time were skyrocketing wages. Take a look at the below graph from the National Bureau of Economic Research.

Wage Inflation 1950-1994

NERB: J. Bradford De Long

The economic setup that led to the above graph has an uncanny resemblance to the modern, post-pandemic boom. What makes today’s situation perhaps even direr is the artificial competition created by the government: in the 1970s, employers didn’t have to compete with massive stimulus packages. 

But that isn’t to say there was no government intervention during the 1970s. 

The Nixon administration failed quite miserably in its attempt to appease runaway inflation. These attempts may be seen as a portent of what may come in the modern economy. On August 15, 1971, during a televised address, Nixon proclaimed the following:

All increases in wages and prices would soon have to be approved by a board. Sound dictator-esque? 

As predicted by Milton Friedman, the president’s efforts were in vain. Prices continued to spiral out of control after the measures were removed. A run on the dollar followed. This precipitated doing away with the gold standard, which turned the dollar into a fiat currency (backed only by the promise of an economy). 

This isn’t to say these dire times will happen again. It is rare for history to actually repeat itself, but variations on a past theme are incredibly common. For today’s promenaders of both main street and wall street, notes of that old melody are certainly being heard.

Wages Soaring in 2021

The above chart, from the St, Louis Fed, shows the dramatic increase in hourly earnings for all employees in the US since the pandemic began (in yellow).

This image should give investors concern that inflation may not be temporary after all. Of particular worry are the Retail and Leisure/Hospitality industries. In 2021, these industries have accounted for half of the jobs added in 2021. 

Wages in the retail sector are up over 8% since their pre-pandemic levels. But these industries are still starved for employees. 

Monster bonuses and incredibly high starting wages are beginning to bring back workers, but not fast enough to ease enticing pay. For many employers, this increase in pay is not merited by an increase in profitability. Many businesses are hanging on by a thread simply to keep their doors open. 

As of right now, inflationary pressure on wages is reduced to a few sectors. The hope is that inflation will be contained, and, eventually (post-enhanced benefits) be abated altogether. 

But it certainly isn’t heading in the right direction, and all the right ingredients are in place for it to continue and spread. Here are a few of the more pertinent ones:

Recipe for Inflationary Disaster

  • Very strong demand for commodities and products/services
  • Broad shortage in supply
  • Money to Burn

So how long will wages remain elevated, and at what point will they curtail, if ever? 

All Eyes on September

On September 6th, 2021, enhanced unemployment benefits in the entire US will terminate. Though 25 states have already opted out of government aid, the largest states (including California, New York, and Illinois) will all be “on their own” beginning September 6th. 

How will this play out in the labor force? 

If there is a mad rush to get a job before the enhanced unemployment benefits end, what will that mean for wages? Will employers reduce starting salaries drastically? And if so, what about the wages of those employees who were hired during the boom? Will their salaries be reduced?

That is a tricky subject and a sure nightmare for HR professionals.

Companies will most likely be unable to keep salaries at their current levels for new employees. Additionally, the salaries of existing employees will likely go down or stagnate. All of this is a great recipe for deflation, which is often synonymous with a recession. 

But these are strange times.

The upward trend in wages is condensed to a few sectors. The worry is that the increase in wages will seep out into other sectors, and we truly won’t know how this will play out until post-September 6th.  Due to government interventions, all of the traditional gauges to measure inflationary risk are out of whack. 

It is also worth noting that we still have time until that deadline; that wage prices could continue their inexorable rise in the interim, making the situation even messier later on.

Wage Inflation and the Stock Market

Wage inflation can not stand by itself; a general increase in prices must follow. How else can producers pay elevated salaries?

Keeping in this vein of thought, projectfinance has combed through different sectors to find a few potential winners an inflationary economy may produce.

Wage Inflation Winners

Traditional winners of inflation have been tangible assets, particularly commodities and real estate. But both of these sectors are priced at frightfully high levels. If inflation comes off just a little bit, they could equally get squashed. 

So what other investments can you make to hedge your portfolio against inflation?

Gold

Relative to other inflation hedges, gold remains at a surprisingly low level. Take a look at the below chart, comparing the percentage return of Real Estate Select Sector SPDR Fund (XLRE) and SPDR Gold Shares (GLD).

Why such a massive discrepancy between two historically inflationary aligned products? Perhaps cryptocurrency has something to do with it. Let’s explore crypto next. 

Cryptocurrency

pexels-alesia-kozik-6765373

Photo by Alesia Kozik from Pexels

The market cap of gold is currently $11.50 trillion. The market cap of all cryptocurrencies is currently $1.25 trillion. This number reached nearly $2.5 trillion during the cryptocurrency euphoria of early 2021. It is very reasonable to assume that crypto has been stealing some of golds thunder. 

Though incredibly volatile, it may be a good time to invest in crypto as it is currently trading way off its highs. A bitcoin ETF makes it easier than ever. 

Another option could be investing in “stable coins”. Stable coins are much less volatile than other speculative cryptocurrencies because they are “pegged” to a fiat currency, typically the dollar. 

BlockFi is currently paying an interest rate of 7.5% on the popular Gemini stable coin (GUSD). 

Robotics/A.I.

Wage inflation will only precipitate the rise of Artificial Intelligence (AI). Companies are beginning to discover they no longer require “someone” to fill a role, but “something”. Though scary, A.I. and the advancement of robotics are here to stay. A great robotics play ETF is ROBO, which is offered by ROBO Global Robotics and Automation Index ETF.

Emerging Markets

Emerging markets, though typically seen as the riskiest of equities, can sometimes be a great hedge against US stocks during inflationary times. That is if (and it’s a big if) inflation doesn’t spread on a global scale. 

Why? Inflation often leads to the devaluation of the currency. If the value of the US dollar goes down, that means dollar-denominated debt (which emerging economies are leaden with) will be cheaper. Lower borrowing costs leads to higher revenue.

If this is confusing, just think of it this way: would you rather pay interest on a dollar conversion of $1.50/ local currency or $1.30/local currency?

Additionally, emerging markets have been underperforming. They may have some catching up to do.

If you’d like great low-cost exposure to emerging markets, Vanguard’s FTSE Emerging Markets ETF (VWO) is a great option.

Wage Inflation Losers

Just as inflation has winners, there will be losers. 

Retail and Hospitality / Leisure

The most likely loser of inflation brought on by wages will probably be those sectors that are currently paying through the teeth for employees. Retail and hospitality, as well as leisure, are paying more than ever for labor because of what is being called “The Great Resignation“. Here are two good reasons to avoid investing in these businesses post-pandemic:

  1. In addition to these companies competing with the government for employee pay, they are also competing with motivation. More and more employees are leaving dead-end jobs to make a career for themselves.
  2. If inflation does persist post-pandemic, it will most like be the most “sticky” in this industry. Companies like Microsoft have not had to increase employees’ wages nearly as much as retail businesses like Darden Restaurants. 

Growth Stocks

Growth stocks are forward-looking in that they tend to earn the majority of their cash flow in the future. During inflationary times, this model historically underperforms the market.

Final Word

Wage push inflation is a real concern in 2021. Although many hope it will be transitory, the reality is lowering wages is much harder than lowering other prices. It will be important for investors to keep an eye on how things pan out post-enhanced benefits this fall to so they can adjust their portfolios accordingly.

To read more about inflation in 2021, make sure to read out article, Inflation and the Stock Market: 5 Sectors to Consider

Covered Calls Explained (Ultimate Guide)

Covered Calls Explained

Covered Call Graph

The above graph represents the profit/loss of a covered call position at expiration, where X is the strike price. 

Best For:

Neutral To Slightly Bullish Investors

Risk:

Defined Risk, Low Risk (the risk is on the stock side)

 Highlights

  • 100 shares of long stock married to one short call comprise a covered call.
  • Covered calls reduce both risk and reward.
  • Most investors use covered calls to generate income. 
  • Covered Call Maximum Loss: Total stock value (minus) premium.
  • Covered Call Maximum Gain: Short call strike price (minus) purchase price of the underlying stock (plus) premium received.

Covered Call Tutorial

What Is a Covered Call?

The covered call is a perfect strategy for beginner and professional options traders alike. Investors can watch first-hand how options react to elements such as time decay (theta) and implied volatility without the capricious gain/losses that come with many other strategies. Why? Your option position is hedged 100% by the underlying stock. There is, however, significant stock risk here.

The poor man’s covered call is an alternative strategy that requires much less capital and has lower loss potential compared to a traditional covered call.

Before we continue, let’s take a look at the textbook definition and components of a covered call:

Covered Call: A financial market transaction where the seller of a call option owns an equivalent amount of the underlying security.

Components:

  • Long Stock (100 shares)
  • Short Call (1 call/100 shares

To simplify things, we are going to assume that the underlying security is 100 shares of stock, as this is the amount of stock one option contract almost always represents in this strategy. This stock is only half of the strategy; we must sell a call to complete it. 

In order to choose which strike price and expiration date call option we are going to sell against our stock, we must determine the reason we are placing this trade. 

Reasons to Trade Covered Calls

Below are two potential reasons why an investor would use this strategy. 

Collect Income: If an investor doesn’t believe a stock they own will rise to a certain point by a certain time, they can sell a call option at this strike price and collect the premium received.

Target an Exit Price: If an investor wishes to sell a stock once it reaches a certain level, they can sell a call at this corresponding strike price. Once the stock breaches this level, they will be “called out” of their long shares.

Covered Call = Lower Risk

The covered call strategy is one of the few option strategies that actually reduces an investor’s risk when compared to simply owning the underlying stock outright. The risk for any stock is always that the stock goes to zero. 

Let’s say IBM is trading at $120/share. Your risk is, in theory, $120/share. 

If an investor decides to sell a $125 strike price call option for $1.50, the premium they receive will offset a small portion of their long stock risk. In this example, their stock risk would be reduced from $120 per share to $118.5/share (stock price minus premium; 120-1.50).

Lower Risk = Lower Reward

However, when risk is reduced, so is the reward. If the stock instead rises above our strike price+premium, we won’t see any profit. Here, the short call acts as ballast on our long stock, tethering all future gains to strike price+premium, 125+1.50 = 126.50. After $126.50, no matter how high the stock goes, as long as we are still short that call, we won’t see a penny of additional profit. 

This works well for the investor targeting their exit price, but not so much for the income generator who didn’t want to sell their stock, especially if they are concerned about paying a short-term capital gains tax on stock held under a year.

Let’s next take a look at 2 different outcomes on a covered call on Amazon (AMZN).

Amazon (AMZN) Scenario #1

Let’s say you’re currently long 100 shares of Amazon (AMZN) stock. The stock has been hovering around $3,200/share for the past few months while the rest of the market drifts higher. This is frustrating, yet you still want to own the stock as you believe in the company.

To generate income on this stock, you decide to sell a call against your 100 AMZN shares. You pull up the options chain and determine selling a call option 34 days out would work best for your time horizon, as this is before earnings. You decide to sell one June 25th 3400 Call, which we will do below on the tastyworks trading platform. 

You click the bid and then send the order and are filled at $26.

Here is your final position:

  • Long 100 shares AMZN
  • Short 1 AMZN June 25th 3400 Call @ $26

Let’s fast forward now to the expiration date, where we will say AMZN has just closed at $3,300 per share. 

What has happened to our 3400 call position? 

Since we sold the 3400 call and the stock is trading under that price, our short call option will expire worthless and we will collect the full premium of $26, or $2,600. Additionally, we have made $100/share of profit on the stock. Not a bad trade!

The Ideal Outcome

This is a great outcome for us, but not the perfect outcome. The perfect outcome would come if the stock closed at our strike price of $3,400. If it would have closed there, we would have received the full credit premium on the call, as well as the maximum benefit from owning the stock.

Amazon (AMZN) Scenario #2

Let’s revisit the above AMZN trade and see what would happen if the stock closed at a drastically different price. As a reminder, our position is the following:

  • Long 100 shares AMZN
  • Short 1 AMZN June 25th 3400 Call @ $26

So expiration day has come again, but under this scenario, AMZN has blown past our strike price of 3400, all the way to $3,600 per share. 

We didn’t lose money on this trade, but we would have done far better if we had no short call at all. 

Why? The short call held us back from realizing the full potential of the stock gain. We are tethered to that $3,400 price level. The stock could go to $4,000 per share, but none of that matters to us: for every dollar we make on our long stock after $3,400, we’ll lose a dollar on the short call.  

It is because of this that the covered call strategy is ideal for neutral to slightly bullish investors

Covered Call Profit/Loss

Now that we understand the mechanics of covered calls, figuring out the maximum loss, gain and breakeven should come easily.

Covered Call P/L

Maximum Loss: Total stock value (minus) premium.  Downside risk on covered calls comes from the risk on the stock. In theory, a stock can go to zero. Selling out-of-the-money calls against long stock only mildly mitigates risk. 

Maximum Gain: Short call strike price (minus) purchase price of the underlying stock (plus) premium received. The maximum profit potential of a covered call occurs if the stock price is at or above the call’s strike price at expiration.

Breakeven: Stock Price Paid (minus) premium received. 

Lastly, let’s take a look at the three different ways a covered call position can be closed. 

Closing a Covered Call

  1. If the short call is out of the money at expiration, it will expire worthless and no action is required. You will receive the full premium.
  2. Buy-back or roll the short call in the marketplace before the expiration.
  3. If you do not buy back an in-the-money short call by expiration, you will be assigned on your call and forced to sell 100 shares of stock, thus liquidating your long stock position in the underlying. 

Final Word

For investors looking to generate income in a stagnating market, there are few better options than the covered call. Additionally, its low risk level makes it appropriate for traders of all levels. 

If you’re reluctant when placing your first covered call trade, feel free to call the folks at tastyworks as they will love walking you through the steps, as well as explaining any risk involved. 

Related Articles

Short Call And Put Options Are Rarely Assigned. Here’s Why.

Short Call And Put Options Are Rarely Assigned. Here’s Why.

Assigned Image

In fifteen years as an options broker, I don’t recall once dealing with an advisor or customer who traded options with the intent of transferring their options into stock, which happens during the exercise/assign process. Whenever assignments did happen, there was seldom a happy person on the other end of the line. 

This makes sense – if you want the stock, why not just buy/sell it outright? You have infinite flexibility when buying/selling stock. You can choose the number of shares, the price of execution, and even the time of your fill.

This isn’t always the case with options. When we’re talking option assignment/exercisement, we’re talking about round lots of 100 shares. This is very costly and rarely matches an investor’s risk profile (100 shares of AMZN would currently cost you $360,000). Additionally, with short option positions, sometimes you don’t know when/if you’ll be assigned. 

Assignment Risk Odds

This assignment risk, however, is often minimal and can be mitigated entirely if you understand the product you are trading. In this article, projectoption takes a deep dive into option assignment and shows why this common fear for investors short call and put options rarely materializes. At the heart of the rationale behind all option exercisements and assignments is something called “extrinsic value”, which we will examine closely.

Before we get started, let’s do a brief recap of how the exercise/assign process works. We are first going to do a recap of American and European styled options as the latter has no assignment risk.

Highlights

  • Only “American Style” options can be early exercised/assigned.
  • An option’s value is composed entirely of “intrinsic” or “extrinsic” value.
  • Intrinsic value is the amount an option is in-the-money-by.
  • Extrinsic value  (implied volatility + time decay)  is the difference between the market price of an option and its intrinsic value.
  • In-the-money call options could face dividend-risk.

Why Options Are Rarely Assigned

European vs American Style Options

If you own a call or put option, you generally will have the right to exercise that option at any time before the expiration. The exception to this rule is European-style options, such as S&P 500 Index (SPX) and the NASDAQ-100 Index (NDX). These index options are cash-settled at the expiration date, so they cannot be exercised prior to expiration. 

However, the vast majority of tradable options are American style, meaning they can be exercised at any time. This applies to nearly all options on equities. If you’d like an education on how these two styles of options differ, please read our article SPX vs SPY: Here’s How They Differ. If you’re interest in trading volatility, our VIX vs VIX article may be more fitting. 

Since there is no assignment risk with European Style index options, this article is going to focus on American style options. If you truly want to eradicate all risks of early assignment, simply stick with European styled options and you’ll have nothing to worry about.

Exercising a Call/Put Option

The owner of long (American style) call and put options have the right to exercise their position at any time prior to that options expiration. If you exercise a call option, you will convert that option into stock by purchasing 100 shares of the underlying stock at the call’s stock price. 

If you are long a call option with a strike price of $120 and decide to exercise this option, two transactions will occur.

  1. You will buy 100 shares of that stock at $120/share
  2. The party that is short that particular option will be assigned, and forced to sell 100 shares at $120, leaving a short position of 100 shares in their account.

Why may an investor consider exercising a long call contract? 

Let’s say that the price of the underlying on that $120 call is currently trading at $135. If you’re long that call, you could exercise that contract, obtain the long shares for $120, then immediately sell it for its current market price of $135, netting a profit of $15/share. That $15 is also known as the option’s “intrinsic value”. Let’s go over what this term means next.

Intrinsic Value

Intrinsic value in options trading is the difference between the current price of a stock and the strike price of the option. Only in-the-money options have intrinsic value. This value represents the benefit of buying (calls) or selling (puts) shares of stock at the options strike price rather than the current stock price.

Here’s are the details of our trade above.

   Call Strike Price: $120

   Current Stock Price: $135

   Intrinsic value: $15

If we exercise our long call, we will purchase the shares $15 below the market price, which is obviously advantageous. But is this the most profitable way to cash in on our option? Absolutely not. In fact, we’ll be giving money away. Let’s next learn about extrinsic value to determine why.

Extrinsic Value

All option values are composed of intrinsic and/or extrinsic values. Extrinsic value (implied volatility + time decay (theta) is the difference between the market price of an option and its intrinsic value. In other words, it’s everything that’s “leftover” from intrinsic value. 

The below visual illustrates the different components of an option’s value. 

Option Premium

Not all options have intrinsic value. Actually, the value of out-of-the-money options is all extrinsic value. Out-of-the-money options generally do not pose an assignment risk. Why? Let’s revisit our above example but with a different underlying stock price of $110.

   Call Strike Price: $120

   Current Stock Price: $110

   Intrinsic value: 0

If you are long that $120 call and decided to exercise your option, you would buy 100 shares of the underlying stock at $120. Does this make sense? No! You just threw away $10/share. Why not just buy the stock for $10 cheaper in the market for $110?

Since the long party won’t exercise out-of-the-money positions, the short party should therefore have little, if anything, to worry about regarding assignment risk.

Why In-The-Money Options Are Rarely Exercised

But in truth, even in-the-money options are rarely exercised. Why? It makes more financial sense for an investor to simply sell their option contract in the open market rather than convert it to shares. Once you understand why it often doesn’t make sense for a long holder to exercise their contract, it should give you more peace of mind on your short position being assigned. 

In order to understand this, we are going to switch over to the tastyworks platform and look at a few examples, starting with exercising a long call.

Exercising a Long Call

In this example, we are looking at a deep-in-the-money 270 call on Apple (AAPL) which we paid 25 ($2,500) for. Here are the details of the trade:

 AAPL Stock Price: $314.94

 Call Strike Price: 270

 Initial Price Paid for Call: 25 ($2,500)

 Option Market Current Value: 46.8 ($4,680)

 Intrinsic Value: 44.94 ($4,494)

Now right off the bat, we’re going to take notice that the intrinsic value of the option (44.94)  is smaller than the call option’s current market price (46.80). This should be a red flag right away concerning exercisement – keep that in mind. 

So let’s say we decide to exercise our 270 AAPL call option and immediately sell the stock received to lock in our profit. Here are the details of this transaction:

 Exercise 270 Call: Buy 100 shares at $270/share for a cost of $27,000

 Sell Stock: Sell 100 shares of AAPL stock at $314.94/share and receive $31,494

 Net Credit Received (profit): $31,494 – $27,000 = $4,494

 Net Profit Made: $4,494 – $2,500 (initial debit paid) = $1,994

So the net credit received on this position from exercising our option is $1,994. Not bad, but you could have done better!

Selling a Long Call in the Open Market

Let’s back up a bit here. Remember the current value of the options contract? It is trading at $46.80, the monetary value of which is $4,680. Our net proceeds from exercising the call were only $4,494. See the problem?

We would have netted $186 more ($4,680 – $4,494) had we simply sold the option outright!

 Net Profit From Exercising Call: $1,994

 Net Profit from Selling Call  in the Market: $2,180

So why the discrepancy in selling vs exercising?

Understanding What We Learned

Earlier, we talked upon extrinsic and intrinsic value. Together, these two values comprise an option’s entire premium. 

Remember the intrinsic value of our call option above was 44.94 and the current market price of that option was 46.80? Since an option’s value is either intrinsic or extrinsic, we can determine that the extrinsic value of this option is 46.80-44.94 = 1.86.

We touched earlier on this number above; $186 was the additional premium we would receive if we sell the option in the open market. This number is also always synonymous with an option’s extrinsic value. 

When you exercise an option with extrinsic value, you are forfeting that additional premium. This premium is comprised of implied volatility and future time value, or, the derivatives extrinsic value.

Dividend Risk: Exceptions to the Rule

Not covered yet in this article is something called “dividend risk”. Options traders must monitor their short call positions closely for any dividend being paid out on the underlying. Why? Option contracts don’t receive a dividend. Therefore, investors long in-the-money call options will likely exercise their contract in order to receive the shares, which do indeed pay a dividend. 

If this dividend is greater than an options extrinsic value, short in-the-money call positions will likely be assigned in the days leading up to the ex-dividend date. If you have a tastyworks account, you can always call their trade desk and ask a pro about your chances of being assigned.

Final Word

When you exercise an option early, you are very likely to forego any additional extrinsic value. It is because of this that short options with a lot of extrinsic value are rarely assigned. 

This doesn’t mean, however, short options are never assigned. If you are short a very deep-in-the-money call or put option in the days leading up to expiration, the extrinsic value will decay and there is a good chance you will be assigned. In fact, it has been estimated that just over 10% of all option contracts will be exercised, and thus assigned, in their lifespan. 

Additionally, if you fail to trade out of your short-in-the-money option before assignment, you will get assignment 99.999% of the time.

Next Lesson

How Time Changes Option Deltas: 3 Examples

3 Examples of How Time Changes Option Deltas

Understanding the definition of the Greeks in options trading (delta, theta, vega, gamma, rho) and understanding their implications are two entirely different worlds. 

Why? In options trading, nothing is static. As time passes, and an options contract approaches expiration, the option Greeks are in constant motion.

To truly understand the mechanics of the Greeks, we must go deeper than simple definitions. 

In this guide, we are going to explore the options Greek “delta” by illustrating how this metric reacts to various “moneyness” (in-the-money, at-the-money, and out-of-the-money) types in options trading.

Highlights

  • An option’s delta compares the change in the price of a stock to the corresponding option price change.
  • The delta of an in-the-money option approaches ±1 as expiration nears.
  • The delta of an out-of-the-money option approaches 0 as expiration nears. 
  • Delta can be thought of as the percent chance an option has of expiring in-the-money.
  • Since all in-the-money options are assigned and exercised at expiration for a quantity of 100 shares, the delta of an option can mirror the equivalent number of shares it represents.

Option Delta Explained

An option’s delta is a ratio that compares the change in the price of an asset (a stock in our case) to the corresponding change in the price of its derivative (an options contract). For stock/index options, delta measures an options price change relative to a $1 move in the underlying stock. 

An options delta is also synonymous with the odds that a particular option has of expiring in the money.

  • A call option delta of +0.37 has a 37% chance of expiring in-the-money 

  • A put option delta of -0.60 has a 60% chance of expiring in-the-money

Option Delta vs Stock

The above image shows a simplified version of a call option with a delta of +0.65. 

We can see that if the underlying stock price goes up by $1, our option will go up in value by .65 cents; if the underlying stock price goes down by $1, our options contract will lose .65 cents in value. 

In the real world, however, the delta of an option never stays the same. It is in constant flux with the market, its value changing constantly with that of the underlying stock. 

So how exactly does the value of an options delta change over time? 

In this article, we are going to look at three different types of options and show how the deltas on these positions change with moves in the underlying’s implied volatility and price. Additionally, we are going to explore intuitively why these deltas are changing.

Scenario #1: Delta vs Time for In-the-Money Options

In-the-money (ITM) option deltas will approach ±1 as time passes (+1 for call and -1 for puts). This assumes that the option remains in-the-money as expiration approaches.

We can see in the above chart how an in-the-money call option with an initial delta of +0.65 approaches a positive delta of +1 as expiration nears. When an in-the-money call option expires, its delta will always be +1.

An option delta of +1 implies that an option contract will increase by $1 in value for every $1 increase in the stock’s prices. Conversely, for every $1 the stock falls in value, the option will lose $1 in value. 

A delta of +1 is therefore much more sensitive in price than a delta of +0.65; the latter will only increase/decrease by 0.65 cents for a representative $1 move in the underlying stock

Two Real World Examples: In-The-Money Deltas

Let’s now take a look at what we have learned in action on the tastyworks trading platform.

E-mini S&P 500 Futures, Sept 17 4200 Call (92 days until expiration)

The above image (taken from the tastyworks trading platform) shows us the delta on an in-the-money call on the S&P 500 futures. The underlying is currently trading at 4215. 

We have highlighted the 4200 call option expiring in September (92 days away), which is currently in-the-money by $15. The delta on this option is +0.53. This means that for every dollar the E-mini rises in value, this option contract will gain 0.53 cents in value.

So what would the option delta be on a call that is closer to expiration?

E-mini S&P 500 Futures, June 18 4200 Call (1 day until expiration)

The above image shows the option chain for the same option contract with only one difference; the expiration is no longer 92 days away, but 1 day away (June 18th). Notice how the option delta has risen in price from +0.53 (92 days until expiration) to +0.79 (1 day until expiration)?

This proves that an in-the-money options delta increases in value with the advancement of time when the underlying asset price remains constant.

Why this matters

Everything is dynamic in options trading. If you own an in-the-money option in your portfolio, this options delta will grow with the passage of time. This higher delta will make your position more sensitive and thus more vulnerable to moves in the underlying. As expiration closes in, your profit/loss will thus become more volatile. 

So what about out-of-the-money options? How do they react to time and price? Let’s take a look at that one next.

Scenario #2: Delta vs Time for Out-of-the-Money Options

Out-of-the-money (OTM) option deltas will approach zero as time passes. 

For example, let’s say you sell (short) a put option with 30 days until expiration with an initial delta of -.25. If in 29 days the stock price hasn’t changed, the delta of your put option will approach zero. Take a look at the image below for a visual of this change.

The above chart illustrates how the delta of an out-of-the-money option (assuming it remains out of the money) becomes less sensitive to moves in the underlying as time passes. 

Let’s next take a look at a few real-world examples that will show us how the delta of out-of-the-money options react to changes in time and underlying price.

Two Real World Examples: Out-Of-The-Money Deltas

Apple (AAPL), July 16th 125 Put (29 days away)

In the above image (taken from the tastyworks trading platform), we can see that the current price of AAPL is trading at 131.79. We have selected the out-of-the-money July 16th 125 put, expiring in 29 days. 

The delta on this put is currently -0.19. This tells us that for every $1 increase in AAPL (all other conditions remaining constant) this option will decrease by 19 cents. Remember, since we are dealing with a put, everything is flipped on its head.  

Let’s next take a look at the delta on the same option contract but of a different (closer) expiration.

Apple (AAPL), June 18th 125 Put (1 day away)

The above image shows again the 125 put on AAPL, but this time the expiration is only one day away. Notice how the option delta decreased from -0.19 to -0.02 for this expiration?

We learned before that the delta of in-the-money options increases as expiration nears; for out-of-the-money options, the exact opposite is true. The option delta for these types of options becomes less reactionary to changes in the underlying as expiration nears. 

If on expiration an option remains out of the money, its value will be zero. 

Why This Matters

Keeping an eye on the delta for out-of-the-money options is very important for investors. Most option traders know that an out-of-the-money option loses value as expiration approaches, but understanding how the Greeks work tells us the degree to which losses begin to mount. 

For an investor long an out-of-the-money put option, rapidly decreasing deltas are not good news. This is just the opposite or an investor short a put option (as shown in our example), as they hope for time decay and invite declining deltas.  

So far we have covered two types of “moneyness” options. Let’s lastly take a look at at-the-money options and see how the deltas on these types of options react to market changes.

Scenario #3: Delta vs Time for At-the-Money Options

At-the-money options will mainly have deltas close to ±0.50 prior to expiration. However, since (nearly) all options will either expire in-the-money or out-of-the-money, these types of options will converge to either ±1 or 0 as expiration approaches. Therefore, our previous examples should prove sufficient to understand how deltas change on these types of options. 

How Option Deltas Trade Like Shares

We mentioned earlier that an options delta can also tell us the odds that a particular option has of expiring in the money. A call option with a delta of .75 has a 75% chance of expiring in the money. 

Additionally, this percentage number can also be interpreted as the number of shares that a contract trades like. If a call option has a delta of +0.30, it has a 30% chance of expiring in-the-money, therefore, the position will almost mirror the profit/loss of 30 shares of stock.

Since out-of-the-money options lose delta over time, their share equivalent will decrease over time. For in-the-money options, their share equivalents will increase over time. 

If you think about this intuitively, it should make sense. Since in-the-money options are ultimately converted to ±100 shares of stock, shouldn’t the value of in-the-money options represent this amount of shares as expiration nears?

Final Word

The delta of an option is not a fixed number, but in constant flux with even the smallest movements in the underlying implied volatility and stock price. Understanding how delta’s change over time can be a window into the health of your option positions. Without the Greeks, we are swimming in the dark.

Next Lessons

What’s the Best Stock to Bond Ratio for Your Age?

One of the most difficult decisions investors can make in retirement planning is determining the bond/equity ratio they should have in their account and how that ratio should change as they age. 

Unfortunately, there is no cut-and-dry answer to this question. In this article, projectfinace has compiled a list of 5 of the most popular asset allocation strategies in 2022 for retirement-minded investors. Although there may not be a methodology on this list that suits your particular risk profile, hopefully, we can give you some ideas and inspirations to create your own personal strategy. 

Before we get started, I’d like to briefly touch upon the increasingly popular “target-date” retirement fund, offered by such companies as Fidelity and Vanguard.

TAKEAWAYS

  • The standard asset allocation method for years has been “100-Age”. The product tells us what percentage of retirement funds should go into stocks.
  • Warren Buffet recommends a “90/10” strategy, where 90% of assets are invested in stocks regardless of age.
  • “120-Age” is an updated version of the old “100-Age” rule. This accounts for people living longer.
  • A more modern idea, and perhaps the most popular, suggests investing 100% in equities until the age of 40, then gradually tapering off into fixed securities.

Target-Date Retirement Funds

Target-date retirement funds are exploding. Last year, their total assets under management surpassed one trillion dollars. The amount of inflows doesn’t appear to be slowing down. These funds have become, for many, a huge sigh of relief. Most of my friends don’t know the difference in risk between small-cap and mid-caps stocks; between emerging and international stocks.  Target-date funds can be a godsend for those with little interest in a more hands-on approach to investing

In the long run, target-date funds may very well be the best option. Fidgeting in retirement accounts is not recommended. 

However, If you’re anything like myself, the idea of putting your entire IRA and 401k into a single target-date retirement fund makes you a little uncomfortable.

The “DIY” Approach

I prefer using mostly stock and bond exchange-traded funds (ETFs) in a hands-on approach. This gives me the ability to increase my retirement allocation in stocks during downturns, as well as make periodic adjustments to the various market-cap weights (mid-cap, small-cap, and large-caps) that I’m holding. If the market is constantly reaching all-time highs, I like having the option to take some profits. I rarely make a move, but I prefer being in charge of my diversification. There is also the distinct possibility I’m a control freak. 

I am confident in my investment decisions and have the conviction to see them through. The one uncertainty I used to have was knowing whether or not my stock/equity to bonds ratio was what it should be. Over the years, I have read up on numerous methodologies and ultimately found the one that suited me best. 

In this guide, we’re going to explore some of the more popular retirement allocation strategies. Hopefully, by the end, you’ll find a diversification class that suits your risk profile.

1) 100 Minus Age Rule

If you have any financially savvy seniors in your family, chances are you have heard the old “100 minus your age” adage before. This rule is very straightforward; simply subtract whatever your age is from 100 and voila! That is the percent of retirement funds you should have in stock. The rest go into bonds.

If you’re 30, this formula says you should have (100-30) 70% of your retirement fund in stocks. If you’re 60, you should therefore have 40% of your retirement in equities, and the remainder in bonds, money markets, and other investments deemed safer.  

However, this formula no longer works. Why?

Americans Are Living Longer

In 1950, life expectancy for the average American was 68 years. In 1975, that number rose to 72. The current American can expect to roam this blue sphere for 78.7 years, 270 days, two hours, and forty minutes. Mark your calendar.  

So since the old formula no longer makes sense, why do we continue to use it?

There are two reasons, neither of which are legitimate.

  1. The formula is simple.  Simple sayings have staying power. What is more simple than 100-age? It’s so easy and so obvious – how can it possibly be wrong?
  2. There will never be a “correct” formula.  The 100-age rule will never be proven incorrect because there will never be a “correct” retirement allocation rule. Why? No two investors are going to retire at the same moment, just as no two investors are going to die at the same time (pardon my morbidity).

So if this formula is broken in 2021, what works?

2) 90/10 Strategy: Warren Buffet Says...

Warren Buffet
By Aaron Friedman - https://www.flickr.com/photos/9887729@N03/4395161160/, CC BY 2.0,

Warren Buffet has his own allocation suggestion, which is a 90/10 ratio of equities to bonds. This stock heavy ratio does not discriminate with age but stays true from the first day of your employment to the very last. 

“It is a terrible mistake for investors with long-term horizons,” the Oracle of Omaha said in 2017, “to measure investment ‘risk’ by their portfolio’s ratio of bonds to stocks.”

He went on to say that the nature of high-grade bonds actually increases portfolio risk. What he doesn’t mention, however, is peace of mind; could you sleep well on the eve of your retirement with 90% of your savings in stocks?  

Probably not. But that isn’t to say you are limited to these almost polar opposite approaches to risk when investing for retirement.

3) 120 minus your age

Perhaps the most widely accepted approach to retirement asset allocation in 2021 is a revamp of the old rule “100 minus Age”. 

Instead of subtracting your age from 100, this new formula suggests subtracting your age from 110 or even 120. This takes into account the longer lifespans of Americans.

If I subtract my current age of 37 from 120, that number tells me I should have 83% of my retirement assets inequities. Given how long American’s are living, most investment professionals would agree this rule better suits modernity than the antiquated 100 minus age rule.

4) 100% Stocks Until You're 40

A modern idea gaining traction suggests investing 100% of your retirement fund in stocks until you reach the age of 40. This is assuming you plan on retiring around 70, give or take a few years. Does this seem reckless? Perhaps, but the numbers show otherwise.

Over time, the stock market recovers from recessions and depressions. Take the Great Depression for example. It took the US stock market 25 years to recover and breach new highs following this period. For The Great Recession of 2007-2008, the stock market only took 4 years to recover.

What do both of these black swans have in common? Both recovery times were under 30 years, which is the time horizon most investors would until retirement when they invest all of their retirement funds into stocks before reaching 40 years of age.

Looking at the Numbers

If you’re like me, you would prefer to see the numbers rather than the narrative. Let’s next take a look at the historical performance of stocks, Treasury Bills, Treasury Bonds, and corporate bonds (rated Bbb). 

The NYU Stern School of Business provided a phenomenal data table comparing the historical returns of these various categories.  I went through the list and compiled my own table on the performance of these different categories, adjusted for inflation, over different time periods. Take a look below.

Inflation-Adjusted Returns

5-Year Real Return
10-Year Real Return
30-Year Real Return
S&P 500 (includes dividends)
13.56%
12.35%
9.55%
US Treasury Bill (3-Month)
-0.88%
-1.26%
0.11%
US Treasury Bond (10- Year)
2.98%
2.80%
3.99%
Baa Corporate Bond
6.64%
5.56%
6.20%

Clearly, investing in broad-based stock indexes such as the S&P 500 has proven the better option for long-term investors. This includes all of the volatility of the past 30 years, not limited to the Early 2000s Recession, the Financial Crisis, and the pandemic.

But that said, who knows what the future has in store? History does not always repeat itself.

5) Vanguard's Target Date Allocations

We mentioned earlier in this article a great alternative to DIY investing: Target Date Funds. 

Vanguard is one of the most popular companies in this arena. So what equity allocation do they choose?

Vanguard Target Date Allocations

From the image above, we can see that Vanguard’s “Phase 1”, which includes investors up to the age of forty, has an equity (stock) allocation of 90%. Up until that age, Vanguard appears to mirror Warren Buffet’s approach. 

I bet that high stock allocation number would surprise a lot of 401k employees participating in this fund. 

If we were to go off of the “100 minus age” rule, the equity allocation for an investor 40 years of age would be only 60% invested in stocks. When you’re talking dozens of years, that 30% difference could easily add up to millions of dollars. 

If we look at “Phase 4” of Vanguard’s investment strategy, we see that investors aged 72-92 still have a considerable equity exposure of 30%. 

Following that age, Vanguard very reasonably begins to curtail the risk.

Final Word

So which retirement asset allocation strategy is best for you? This decision would be a whole lot easier if we had a crystal ball. 

I will say this – risk-averse investors rarely add into their calculations the cost of not participating in the equity market.

Remember the negative performance of Treasury Bills from the above graph? With inflation factored in, it’s very possible for investors to actually lose money on a yearly basis when they forego stocks.

The post-pandemic recovery has proven this, and should be enough motivation for stock-market-jittery investors to take on more risk.

Recommended Articles