?> Mike Martin

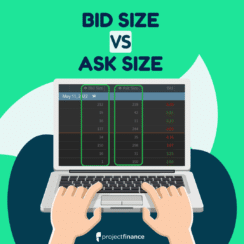
Bid Size vs. Ask Size in Options & Stocks Explained

bid size vs ask size

Bid And Ask Size Definition: The total quantity of shares/options that can be sold (bid) or bought (ask) at the current market prices.

In options trading, liquidity refers to the ease at which an option can be opened and closed. Unlike stocks, options can have very wide markets. 

There are numerous measures available for traders to gauge the liquidity of an option. Among these is the “bid size” and “ask size”. 

The bid size tells us how many options we can sell at a quoted price. The ask size tells us how many options we can purchase at a quoted price. 

For those trading large positions, this metric is crucial. In this article, projectfinance is going to show you why. 

Liquidity Measures In Options Trading

Before we get into bid size vs ask size, let’s first review a few other important measures of option liquidity in financial markets. 

  • Option Volume: The number of contracts traded so far on a given day.

  • Open Interest: The number of contracts currently in existence for a particular option.

  • Option Bid-Ask Spread: The difference between the bid price and the asking price.

  • Stock Volume: The number of shares of stock traded on a given day.  

Ideally, you want to trade options with high volume and open interest. Additionally, you want the stock volume to be high as well. Why? 

Market Makers hedge the options they buy and sell with stock. High stock volume generally means the stock is liquid, which means they can hedge easier, therefore giving you better fill prices.

Option spreads (the difference between the bid and ask price) in derivatives should also be tight. I have seen some options with a bid of $1 and an ask of $3. This means, that if you were to get filled on a buy order at the market price, you would lose $2 if you sold immediately. The tighter the spread, the less slippage to you. 

But sometimes option markets can be misleading. A market maker may bid an option at $2, but how many options is that market participant willing to purchase from you at $2? 1? 200?

This is where bid size and ask size come into play. 

Bid Size And Ask Size In Stock

Bid Size Definition: The quantity of a security a market maker or investor is willing to purchase at a specific price. 

Ask Size Definition: The quantity of a security a market maker or investor is willing to sell at a specific price. 

Let’s first look at an example of bid size vs ask size in the stock market. 

aapl bid size ask size

The above image (taken from the tastyworks trading platform) shows the current market for AAPL stock. We can currently sell AAPL for 154.62 and buy AAPL for 154.69.

The spread here is 0.07, the difference between the bid and the ask price. If we were to buy and immediately sell this stock, we would lose 0.04. Of course what we lose, the market maker gains.

But how many shares can we sell at the bid stock price 150.62? And how many can we buy at 154.69? A gazillion?

This is where the “size” of the bid and ask come into play. The current size of AAPL stock is circled in green above. In the stock market, bid size and ask size represent 100 shares of stock. Therefore, a bid size of “1” really means 100 shares. 

In our AAPL example, we can see that there is 300 shares bid at 154.62 and 200 shares offered at 154.69.

Bid Size And Ask Size In Options

Just as with stock, options have bid sizes and ask sizes. Let’s jump right into an example by looking at call options on SPY, an S&P 500 index-tracking ETF

Spy - Bid/Ask Size

In the above options chain, we can see the various bid and ask sizes for different SPY call options with an expiration date of May 11th. 

Unlike stock, the bid and ask sizes for options do not represent 100 contracts. If an option contract has a bid size of 34, that means 34 options are available to sell at the quoted price. 

Bid and ask sizes are in constant flux with the market. If you watch a live options chain on a liquid product like SPY, these numbers will change several times a second.

Bid Size And Ask Size In Illiquid Options

In our above example, we looked at the bid and ask size on SPY, which just happens to be the most liquid security in the world. Let’s now check out the bid and ask sizes on a less liquid security, Ryder System – R. 

Ryder Systems - Bid/Ask Size

R bid ask size

So far today, Ryder Systems has traded 230k of stock. Spy, on the other hand, has traded 40 million. A stock that has high volume is usually indicative of decent option liquidity. 

R is therefore far less liquid than SPY. When comparing the bid/ask size of R with SPY, we can see that R has many more options both bid and offered at various strike prices than SPY.

One may think that more liquid stocks have higher bid/ask sizes, but that is not always the case. Why?

We must look at the actual spread of the options. With SPY, the options are about a nickel wide. R, on the other hand, has spreads ranging from 0.80 to 4 wide! 

Market makers in R, therefore, have a much better chance of profiting in these wider spreads than those in SPY. Because of this, they are willing to both buy and sell greater quantities of options in R than SPY. 

Bid Size And Ask Size: Why It Matters

So why does this matter to you? Let’s jump right into an example to see why. 

Let’s assume you own 10 LEAP call options on AAPL. You are happy with your profits and, not knowing that LEAP options are very illiquid, you place a market order to sell your long calls. 

You see a quoted bid price of 31.40, and presume you will get filled at this price. After hitting send, you discover only one contract was filled at 31.40, while the others were filled at 31.15! Why did this happen?

Because only one contract was bid at 31.40. The others were bid at 31.15. 

So how do we know what the next best price will be? By putting the option code into the trade grid, as I have done below:

aapl bid ask size

This is a perfect example of why it is very important to only use limit orders in options trading. The current ask price and current bid price do not guarantee you will get filled here. This is particularly true in high volatility environments and illiquid products. 

Though you may not get filled right away using limit orders in both buy orders and sell orders, they do ensure the best fill price – if/when you actually get filled. You can even work limit orders downward or upward until you get filled.

Bid Size And Ask Size FAQs

When the ask size exceeds the bid size, this can be a sign that a stock will fall as a result of oversupply. On the other hand, when the bid size is greater than the ask size, this can be a sign that demand is greater than supply. When this happens, the underlying stock price may soon rise in value. 

The ask price is the price at which a market maker is willing to sell you an option. Therefore, this is the price at which you will purchase an option.

The bid price is the price at which a market maker is willing to buy an option. Therefore, this is the price at which you can sell an option. 

Both the ask size and the bid size of options are in constant flux with the market. Market makers determine the quantity at which they will both buy and sell options by looking at factors such as stock price and supply and demand. Because of this, the ask size is rarely the same as the bid size. 

Next Lesson

29 Core Options Trading Strategies For Beginners

Options are incredibly versatile investment products. Calls and puts can be combined in innumerable ways to create custom-tailored options trading strategies.

These strategies can be designed to profit in bearish, bullish, or even neutral markets. 

In this article, projectfinace has compiled a list of 29 core options trading strategies for beginners. To learn more about a particular option strategy, simply click on the image. 

Bullish Options Strategies

Long Call Option

Bull Call Spread

Short Put Option

Covered Call

Bull Put Spread

Cash Secured Put

Collar Spread

Covered Strangle

Synthetic Long Stock

Poor Man's Covered Call

The Wheel Strategy

Protective Put

Long Call Ladder

Bearish Options Strategies

Long Put Option

Bear Call Spread

Short Call Option

Bear Put Spread

Covered Put Write

Synthetic Short Stock

Neutral Options Strategies

Short Iron Condor

Long Iron Condor

Short Straddle

Long Straddle

Short Strangle

Long Strangle

Short Iron Butterfly

Long Iron Butterfly

Long Butterfly Spread

Long Call Calendar

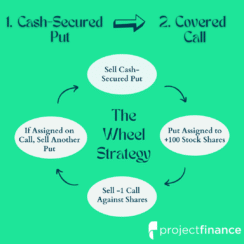
The Wheel Options Strategy: Collect Income From Options

The Wheel Options Strategy

The Wheel Definition: In options trading, the “Wheel” is 4 step strategy that first involves selling a put option. If/when this put is assigned, you will be long stock. The next step is to sell a call option against this stock. If the underlying rises in prices, you will be “called out” on the stock, resulting in a flat position. Repeating this process creates “the wheel”.

The wheel strategy is a great, long-term options trading strategy best suited for traders looking to generate income. In this article, we will review step-by-step how this income strategy profits. 

              TAKEAWAYS


  • The wheel strategy involves selling a cash-secured put, purchasing stock when/if the put is assigned and then selling a call against this long stock.

  • Both the put and call sold are ideally out-of-the-money.

  • The wheel options strategy works best in minorly bullish markets; in very bullish markets, owning the stock outright will be more advantageous. 

What Is the Options Wheel Strategy?

The wheel involves a multi-step, systemic process:

  1. Sell cash-secured puts on a stock you want to eventually own.

  2. When the stock falls below your short put strike price on the expiration date, your short put will be assigned and converted into long stock.

  3. Once in possession of the long stock, sell an out-of-the-money call on this stock.

  4. If/when the stock rallies to the short call strike price on expiration, you will be called out, or “assigned,” leaving you with a flat position.

  5. Re-enter the short put position on the same or another stock.

Let’s now go through the different components of this strategy step-by-step. 

What Is A Cash-Secured Put?

Cash-Secured Put Definition: In options trading, a “cash-secured put” is a short put option that is backed with the full cash amount needed to buy the shares at the strike price. This strategy is both neutral and bullish on the underlying.

Cash-Secured Put Maximum Profit: Premium received from selling put.

Cash-Secured Put Maximum loss: Strike price minus the premium received.

🎬 Watch on YouTube! Selling Put Options For Beginners

You can sell puts in both cash accounts (IRA accounts) and margin accounts. When you sell puts in cash accounts, you must front the entire capital required to purchase the stock should you be assigned. 

In margin accounts, the funds required to hold a “naked” put option are generally the greater of:

  • 20% of the underlying price minus the out of money (OTM) amount plus the option premium

  • 10% of the strike price plus the option premium

Since we anticipate purchasing the stock when the underlying stock price falls below our short put strike price, the wheel strategy must be “cash-secured”.

The Wheel: Cash-Secured Put Example

In this example, we are going to sell a put option of Ford (F). 

Why Ford? Ford is currently trading at $15/share. When you sell cash-secured put options, you need to front the cash to purchase the stock at the strike price. Options are leveraged securities – one contract represents 100 shares of stock. 

It will be very costly indeed to purchase 100 shares of Amazon (AMZN) for its current market price of $2,600/share! This is why I prefer selling puts on cheaper stocks, like Ford.

Here is our trade:

➥ Ford Stock Price: $15

➥ Put Option Strike Price: 14

➥ Put Option Expiration: 37 days away

➥ Put Option Premium (credit received): 0.60 

Cash-Secured Put Trade Outcomes

When you sell a put option, there are two trade outcomes. The stock will either close above your short strike price on expiration or above your short strike price. 

When the stock closes below your short strike price, you will be assigned on your short put. When the stock closes about your short strike price, your short put will expire worthless.

Ford Trade Outcome #1:

➥ Ford Stock Price: $15 –> $15.40

➥ Put Option Strike Price: 14

➥ Put Option Expiration: o days away

➥ Put Option Price: 0.60 –> 0.00

In this example, Ford closed above our short put strike. This means we collect the full premium of 0.60 ($60). Since we won’t be assigned stock, we can not initiate the wheel just yet. We’ll have to sell another put and wait for the stock to fall below the strike price. But we made some money in the process!

Ford Trade Outcome #2:

➥ Ford Stock Price: $15 –> $13

➥ Put Option Strike Price: 14

➥ Put Option Expiration: o days away

➥ Put Option Price: 0.60 –> 1.00

In the second outcome, Ford fell below our short strike price on expiration. This means we will purchase the stock at $14/share (the put’s strike). Since we collected $0.60 when selling the 14 put, our effective share purchase price is $14.00 – $0.60 = $13.40.

With the stock price at $13, we’re technically down $40, which is much better than being down $200 from purchasing the 100 shares at $15.

So what do we do now? To satisfy the wheel strategy, we must sell a call option against the assigned stock!

In order to better understand option premium and risk, read our guide: Implied Volatility for Beginners

What Is A Covered Call?

Covered Call Definition: In options trading, a covered call position is established when an out-of-the-money call option is sold against 100 shares of long stock. 

Covered Call Maximum Profit: Strike price of the short call option minus the purchase price of the underlying stock plus the premium received.

Covered Call Maximum Loss: Stock price minus option premium received.

🎬 Watch on YouTube! Covered Calls For Beginners

Because of its low-risk nature, the covered call is a great strategy for beginners. It is also a great way for traders to collect income from a stagnating stock they own.

If you own the SPY ETF at $400/share, and don’t believe SPY will be trading above $410 in a month, you could sell a 410 strike price call option on SPY expiring in 30 days. 

If SPY is trading below $410 on expiration, you will collect the full premium from the option. If SPY is trading above this price, your short call will be assigned, thereby forcing you to sell 100 shares. The net result? Your position is offset. 

Since we already own the stock, risk is eliminated here from the option. Therefore, we do not need to use margin, or set funds on reserve, to hold a short call when it is sold against long stock. 

The Wheel: Covered Call Example

Let’s now revisit Ford. Remember, in our second outcome, we were assigned on our short put option, leaving us long 100 shares of Ford. The first step of the wheel is complete.

Now, we must sell a call option against the long stock we own.

This call option must be “out-of-the-money.” I’ll provide a visual of option moneyness below. 

option moneyness chart calls and puts

Since Ford was trading at $13/share when we got assigned, the call we sell must be above this price to be out-of-the-money. 

Let’s say we sell the $14 call option on Ford. Here is our trade!

➥ Ford Stock Price: $13

➥ Call Option Strike Price: 14

➥ Call Option Expiration: 30 days away

➥ Call Option Premium (credit received): 0.40

Covered Call Trade Outcomes

Just as with our short put option, our short call has two possible outcomes: 

  1. The short call will expire worthless if out-of-the-money on expiration.

  2. The short call will be assigned short stock if in-the-money on expiration.

Let’s see how our trade did!

Ford Trade Outcome:

➥ Ford Stock Price: $13 –> $14.25

➥ Call Option Strike Price: 14

➥ Call Option Expiration: o days away

➥ Call Option Price: 0.40 –> 0.25

In this trade, Ford rallied from $13 to $14.25 at the time our short call expired. This means our call expired in-the-money. The final premium of the option was 0.25. Since we sold the option for 0.40, we made 0.15 ($15) on the trade!

However, since our option was in the money, we will be assigned on our short call. When assigned on a short call, you must deliver -100 shares of stock. But remember, we were already long 100 shares of stock. 

Therefore, this short assignment will offset our long stock, leaving us with no position in Ford.

To sum up the entire wheel position:

1) Shorted the 14 put for $0.60.

2) Stock fell to $13 and we got assigned on the 14 put, purchasing 100 shares at $14/share. Effective purchase price = $14 put strike – $0.60 put premium collected = $13.40.

3) Shorted the 14 call for $0.40.

4) Stock rallied to $14.25 and we got assigned on the 14 call, selling our 100 shares for $14/share. Effective share sale price = $14 call strike + $0.40 call premium collected = $14.40.

Total Position P/L: ($14.40 effective sale price – $13.40 effective purchase price) x 100 shares = +$100.

Another way to consider this P/L is to calculate the account inflows and outflows.

1) Shorted the 14 put for $0.60: $60 inflow

2) Buy 100 shares @ $14/share via put assignment: $1,400 outflow

3) Shorted the 14 call for $0.40: $40 inflow

4) Sold 100 shares @ $14/share via call assignment: -$1,400 outflow

$100 option inflow – $0 stock outflow = $100 net inflow.

A different way to get to the same conclusion is to consider closing the options at expiration and buying/selling the shares at the current stock prices.

1) Short the 14 put for $0.60, stock drops to $13. Close 14 put for -$0.40 and buy 100 shares at $13.

2) Short the 14 call for $0.40. Stock climbs to $14.25. Close the 14 call for $0.15 profit and sell shares at $14.25.

Stock P/L: $14.25 sale price – $13 purchase price = +$1.25 x 100 shares = +$125

Option P/L: -$0.40 on short put + $0.15 on short call = -$0.25 x 100 = -$25.

Net P/L: $125 stock profit – $25 option loss = +$100.

Same result, different math.

And we’re back to where we started from!

To complete the cycle, sell another put option on Ford, and repeat!

The Wheel And Strike Prices: Which Options To Choose?

In order to be a successful options trader, you must understand the risks. 

Having a fundamental understanding of “The Greeks” will help you accomplish this. 

Delta is the option Greek that tells us how much an option price is expected to move based on a $1 change in the underlying stock.

This Greek also tells us the probability an option has of expiring in-the-money (ITM)

An options chain can be arranged by the Greeks. When choosing your option contract strike prices for both cash-secured puts and covered calls, it is therefore very important to take this metric into consideration when choosing your strike prices for the wheel. 

The below options chain shows the deltas for SPX call options. The orange line represents the at-the-money options. We can see the following strike prices have the corresponding odds of expiring in-the-money:

  • 4140 Call: 60% 
  • 4165 Call: 50%
  • 4185 Call: 42%

deltas the wheel

The Wheel: Is It Worth It?

Though the wheel strategy is a great way to collect passive income, it does indeed require quite a bit of maintenance. 

Additionally, if you’re very bullish on a stock, your best bet is to buy it outright. The wheel takes time and money and underperforms in very bullish markets.

The Wheel Options Strategy FAQs

When choosing stocks for the wheel strategy, there are several factors to consider. If you have a limited amount of capital to work with, it may be wiser to stick with cheap stocks. Implied volatility is also important in this strategy. The higher the implied volatility, the higher the odds the stock will breach both the short put and short call strike price. 

The wheel options trading strategy is most profitable (when compared to simply buying the stock) when the underlying stock is minorly bullish.

If the stock goes up too much, the wheel strategy will lose money when compared to owning the stock outright.

Next Lesson

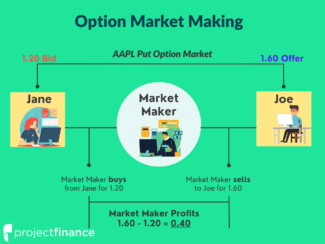
Market Makers in Options Trading: What Do They Do?

Market Maker Definition: A market marker acts as a liquidity provider by both buying and selling a security to satisfy the market. 

Market makers are the backbone of all public markets. Without them, it would be very difficult indeed to both enter and exit any type of security, including stocks, options (derivatives), ETFs, and futures. 

If you’ve ever placed a market order before, you’ve probably been surprised at how fast that order was filled. This is because a market maker was waiting, armed with a software-based trading system using algorithms, to take the other side of your trade. 

In this article, we will explore the function of market makers, and how they contribute to the smooth running of our capital markets. 

              TAKEAWAYS


  • The function of a market maker is to provide liquidity for the markets. 

  • Market makers make money from the “spread” by buying the bid price and selling the ask price. 

  • Market makers hedge their risk by trading shares of the underlying stock.

  • Citadel and Virtu are the largest option market makers. 

  • A broker acts as an intermediary, facilitating orders from buyers and sellers; a market maker provides order execution.

What Is the Purpose of Market Makers? 

Market makers are the reason our market orders get filled instantaneously. They also (eventually) fill stop orders, limit orders, and virtually any other type of order your broker offers. Without market makers, you would have to sit on the order until another counterparty came around and decided to take the other side of the trade. When might that time come? Who knows. This “illiquid” market would certainly cause us to distrust the markets. 

The ease to enter and exit trades is called liquidity. Providing liquidity is the primary function of all market makers. These market participants buy the bid price and sell the ask price on their specified security for any order that comes their way. 

Of course, market making is no charity – the difference between the bid and the ask is called the spread, and this spread is how market makers make money.

What Are Examples of Option Market Makers?

Let’s jump right into an example to see how market makers help markets run smoothly. 

This example is going to involve a put option on AAPL with three market participants: Jane, Joe and a market maker. 

  • Jane is currently long a AAPL put option contract and wants to sell.

  • Joe wants to buy the same contract Jane is selling.

  • The AAPL put is currently bid for 1.20 and offered for 1.60

Market Making Visualized

market maker options

Both Jane and Joe send a market to both sell and buy, respectively, their put option. These orders are sent to an exchange. Some major exchanges for options include:

  • Chicago Board Options Exchange (CBOE)

  • International Securities Exchange (ISE)

  • NYSE (New York Stock Exchange) Arca

  • Various Nasdaq Markets

After being sent to an exchange, the order is then seen on the screen of a market maker. The market maker buys the put from Jane while simultaneously selling the same put to Joe. 

Since the market maker bought the option at the bid of 1.20 (from Jane) and sold the option for 1.60 (to Joe), the market maker made a profit of 0.40, or $40 taking into account the leveraged multiplier effect of options. Remember, one options contract represents 100 shares of stock. 

Sometimes, Joe and Jane can trade directly together, but the vast majority of the time, a market maker is needed to facilitate these trades. What if there was no other trader out there who was willing to buy that put option Jane wanted to sell? How would she ever get out of her position?

How Do Market Makers Set Option Prices?

Market makers set option prices for all listed derivatives, including equity, ETF, and index options

In the above example, the market for our put option was 1.20/1.60. This means that if you were to buy this option at 1.60 and wanted to sell it immediately, you would have to sell it for 1.20. In other words, you would lose 0.40 (1.60-1.20), or $40, immediately. 

Of course what you lose, the market maker gains. 

But why is this market 1.20/1.60? Is this some arbitrary price? No! 

The width of a market (set by the various market markers for a security) depends on several factors. The more liquid a security is, the easier both you and a market maker can enter and exit positions in that security.

3 Liquidity Measures in Options

Market Makers Liquidity

Before determining the spread of an option (or any security), a market maker considers several liquidity factors. Three of these are:

  1. Volume: How many option contract have been traded so far on any given day.

  2. Open Interest: How many contracts are outstanding in an option.

  3. Bid/Ask Size: How many contracts are bid/offered at that price. 

The higher the volume and the more open interest an option has, the easier a market maker can exit the position they just bought or sold from you. 

Remember, market makers have to exit positions as well! If markets are illiquid, they are going to widen out the spreads to make up for the risks of holding a position in an illiquid market. 

How Market Makers Hedge

Market makers don’t generally turn around and immediately sell an option they bought from you. They’ll have to wait a bit for another trader to come around and give them a good price. So how do they hedge the risk of holding options?

Let’s take a look at an example to find out.

We’ll say AAPL just reported horrible earnings, and every trader out there is trying to sell their call options. A market maker in AAPL must therefore buy these options to fulfill their duty as a liquidity provider. 

This will result in a boatload of long call options for the market maker. That’s a lot of risk! How do market makers offset this risk?

Delta and Gamma Hedging

To mitigate this risk, a market maker keeps an inventory of either long or short stock. How much stock? That depends on their position “delta” and “gamma“.

Δ β θ Read! Introduction To The Option Greeks

For example, if an out-of-the-money call option has a delta of 0.84, that means this contract trades like 84 shares of stock. To offset this risk, a market maker would sell 84 shares of stock.

Sometimes, in volatile markets, a lot of stock must be purchased or sold for a market maker to offset their risk. This can cause stock prices to both soar and tank in value. Market makers hedging their short call options with long stock is the reason many meme stocks soared in value in 2021. This rare market condition is called a gamma squeeze

If you’d like to read more about delta hedging (which both market makers and traders utilize), read our article, Delta Hedging Explained (Visual Guide w/ Examples)

How Do Market Makers Make Money In Payment for Order Flow?

Retail traders are not known for their market savviness. Market makers want retail order flow, particularly in options. Why? The bid/ask spread in options is much wider than in stocks. 

Market makers want this order flow so bad, that they are willing to pay brokers for the right to fill their customer’s orders. 

This is known as payment for order flow. 

Every time you send an order through your broker (unless your broker internalizes their order flow), an auction takes place between your broker and numerous market makers to see who gets to fill your order. 

In these flash auctions, the best bid/offer wins. Payment is sent from the market maker to the broker for filling the order, and the customer is filled.

Market makers do not get paid here – the brokers (like thinkorswim, Robinhood, or tastyworks) do. Market makers make their money in “arbitrage” by trading the products they are specialists for. 

Read: 💲 Payment for Order Flow Explained Simply (w/ Visuals)

Who Are the Largest Options Market Makers?

Although there are many market-making firms, two, in particular, dominate the space: 

  1. Citadel Securities
  2. Virtu

So what percentage of volume do these two firms take from the stock and options markets? The below image, from the Financial Times, shows just how much.

Market makers can be small independent businesses or large hedge funds. In the modern era, hedge funds are taking business from the smaller market makers. You must be very well capitalized to compete in this space!

What Is the Difference Between a Market Maker and a Broker?

With a few rare exceptions, (such as Interactive Brokers), retail brokers do not act as market makers. These two business models provide completely different services. 

  1. Brokers act as intermediaries by facilitating trade orders from both buyers and sellers by bringing together assets.

  2. Market Makers are dealers in securities who provide liquidity to a market by buying and selling that market’s securities at all times. Market makers provide trade execution.

Option Market Makers FAQs

Market makers provide liquidity by both buying and selling options of all types, including call and put options. To offset the risk from selling call options, market makers must purchase stock. This can result in a gamma squeeze. 

In order to adequately mitigate their risk, market makers in options must hedge their positions by either buying or selling shares of stocks. This can lead to fluctuations in the underlying share price, which some believe to be manipulation.

Market makers buy options to satisfy the market. As liquidity providers, the role of the market maker is not limited to buying options – they must stand ready to both buy and sell all options strategies to fulfill their obligation. 

Next Lesson

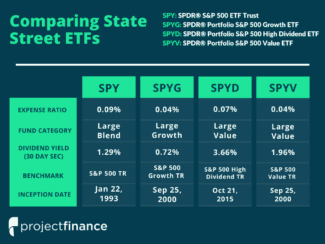
SPY vs SPYG vs SPYD vs SPYV: Head-To-Head ETF Comparison

In 2022, State Street Corporation currently offers more than 130 ETFs (exchange-traded funds). Generally speaking, ETFs are cheaper and more liquid than mutual funds. 

The most popular of State Street’s ETFs is the SPDR S&P 500 ETF Trust, SPY

The SPY ETF uses the S&P 500 Market Index as its benchmark. SPY is the largest and most liquid exchange-traded product (ETP) in the entire world. 

The popularity of SPY led State Street to create numerous S&P index fund-tracking spinoffs. Some of these funds include:

  • SPYG: SPDR Portfolio S&P 500 Growth ETF

  • SPYD: SPDR Portfolio S&P 500 High Dividend ETF

  • SPYV: SPDR Portfolio S&P 500 Value ETF

  • SDY: SPDR S&P Dividend ETF

  • SPDR: SPDR S&P Biotech ETF

  • SPLG: SPDR Portfolio S&P 500 ETF

In this article, projectfinance will compare the performance and characteristics of four of these funds; SPY, SPYG, SPYD, and SPYV. Let’s look at the takeaways, then get started with a data-table comparison!

              TAKEAWAYS


  • State Street’s SPY, SPYG, SPYD ad SPYV all track different variations of the S&P 500 stock market index.

  • SPY is the oldest and most popular straight S&P 500 tracking ETF in the world.

  • SPYG tracks 240 growth stocks within the S&P 500.

  • SPYD tracks only 79 stocks. This ETF has strict criteria for entry, favoring stocks with high dividends.

  • SPYV track 447 stocks in the S&P 500, all of which are high value. This “value” is determined by factors such as book value to price ratio.

  • SPYG experiences the most volatility of all the funds but also has the most upside potential.

  • Though SPYD offers a high dividend, it contains many energy stocks, which are known for their volatility. 
SPY SPYG SPYD SPYV

Fund Issuer:

State Street
State Street
State Street
State Street

Fund Name:

SPDR® S&P 500® ETF Trust
SPDR® Portfolio S&P 500® Growth ETF
SPDR® Portfolio S&P 500® High Dividend ETF
SPDR® Portfolio S&P 500® Value ETF

Fund Category:

Large-Cap Blend
Large-Cap Growth
Large-Cap Value
Large-Cap Value

Underlying Index:

Expense Ratio (fees):

0.09%
0.04%.
0.07%
0.04%

Number of Holdings:

505
240
79
447

1 Year Return:

+15.47%
+18.20%
+18.60%
+12.45%

Morningstar Rating:

☆☆☆☆☆
☆☆☆☆☆
☆☆

Fund Structure:

UIT
(Unit Investment Trust)

ETF
ETF
ETF

Dividend:

(30 Day SEC Yield)

1.27%

0.70%

3.62%

1.93%

What Is the SPY ETF?

  • SPY has a dividend yield of 1.27%

  • The expense ratio (total fees) of SPY is 0.09%

  • State Street’s SPY exchange-traded fund is the first ETF to be issued.

  • SPY tracks the S&P 500 Index.

  • Because of its age (inception date 1993), SPY is structured as a UIT (unit investment trust), though it trades just like an ETF.

  • SPY is currently the most widely traded investment product in the world.

State Street’s SPDR® S&P 500 ETF (Ticker SPY) was the first exchange-traded product in the world to be issued. Here is how State Street describes its fund:

SPY is a straightforward ETF. This low-cost fund tracks the S&P 500 Index (SPX), which is the most followed index in the world. Here are a few quick facts about SPX:

  • The S&P 500 Index contains the 500 largest US companies by market capitalization.

  • The S&P 500 is a float-weighted index, which means larger companies have greater weight than smaller companies.

  • The S&P 500 index is generally considered to be the best gauge for the health of US stocks.

  • The S&P 500 index can not be directly invested in as indices do not offer shares.  

What does the SPY ETF Hold?

The S&P 500 is a well-diversified index containing large-cap stocks from numerous sectors. 

The below image was taken from the factsheet of State Street Global Advisors, the issuer of the SPY ETF:

SPY Sectors

Image from ssga.com

As we can see, information technology accounts for a large segment of the S&P 500 index. Health Care and Consumer Discretionary stocks also have heavyweight in this index, but nowhere as close as tech. 

The IT (tech) sector is dominated by FAANG Stocks, which represent Meta (FB), Amazon (AMZN), Apple (AAPL), Netflix (NFLX), and Alphabet (GOOGL). 

So what percentage of the SPY ETF is invested in these behemoths? Let’s take a look at the top ten holdings in this fund to find out!

SPY Top Ten Stock Holdings

Image from ssga.com

What Is the SPYG ETF?

  • SPYG has a dividend yield of 0.70%.

  • The expense ratio (total fees) of SPYG is 0.04%.

  • SPYG tracks the S&P 500 Growth Index.

  • Growth stocks have more risk than balanced or value stocks.

State Street’s SPDR® Portfolio S&P 500® Growth ETF (SPYG) tracks only part of the S&P 500 index. Which part? As you can probably guess from its name, this ETF singles out only the growth companies within the S&P 500 Index. 

Growth companies tend to be more volatile than value companies. In bullish markets, growth companies tend to outperform the market while these stocks typically underperform the market in bearish markets. Here is how State Street describes its fund:

So what companies does SPYG track? Let’s look under the hood to find out!

SPYG Sectors

Image from ssga.com

Many information technology stocks fall under the growth sector. Because of this, SPYG has huge exposure to IT stocks – 43.13% to be exact. Compare that to SPY’s IT exposure, which is still lofty at 26.75%. 

So what stocks does SPYG contain? 

As we can see below, SPYG has a lot in common with SPY, with Apple (AAPL), Microsoft Corporation (MSFT) Amazon (AMZN, Tesla Inc. (TSLA), Alphabet Inc. (GOOGL), and NVIDIA (NVDA) all representing the top positions.

However, SPYG places a much greater weight on these IT stocks in relation to SPY. 

SPYG Top Ten Stock Holdings

Image from ssga.com

What Is the SPYD ETF?

  • SPYD has a high dividend yield of 3.62%.

  • The expense ratio (total fees) of SPYD is 0.07%.

  • SPYD tracks the S&P 500 High Dividend Index.

  • High-dividend paying stock tends to be more value-oriented.

State Street’s SPDR Portfolio S&P 500 High Dividend ETF (SPYD) is a great fund for income-thirsty investors. 

This ETF isolates 80 high dividend-yielding companies within the S&P 500 Index. The result is a dividend yield of 3.62%. This yield is higher than SPY’s dividend yield of 1.27% and far surpasses SPYG’s dividend yield of 0.70%.

The downside tradeoff of high dividend-paying stocks usually comes in the form of long-term underperformance. SPYD has vastly underperformed SPY over the past five years, as can be seen below. 

SPY vs SPYD: 5 Year Chart

High dividend-paying companies tend to be less volatile than growth companies. In bullish markets, these companies tend to underperform the market while these stocks typically outperform the market in bearish markets.

Let’s next check out how State Street describes its high dividend-paying fund. 

SPYD Sectors

Image from ssga.com

Our first two ETFs (SPY & SPYG) were dominated by information technology stocks. SPYD, on the other hand, places a relatively minuscule weight on tech equities.

As we can see above, IT stocks account for only 2.45% of SPYD’s weighting. This fund favors utilities, energy, financials, consumer staples, and health care stocks. These stocks tend to be more financially stable, relying on steady income and revenue for steady dividend streams. 

Let’s next see what stocks in particular the SPYD ETF favors. 

SPYD Top Ten Stock Holdings

Image from ssga.com

As we can see, big energy stocks dominate the top ten holdings of SPYD. Let’s take a look at the dividend yields of a few of these companies to see why:

  1. Valero Energy Corporation (VLO): 3.63% Yield

  2. Chevron Corporation (CVX): 3.37% Yield

  3. Sempra Energy (SRE): 2.67%  Yield

What Is the SPYV ETF?

  • SPYV has a dividend yield of 1.96%.

  • The expense ratio (total fees) of SPYV is 0.04%.

  • SPYD tracks the S&P 500 Value Index.

State Street’s SPDR Portfolio S&P 500 Value ETF (SPYV) contains the stocks within the S&P 500 index that are most value forward. A high-value stock is determined by three factors:

  1. Book value to price ratio.

  2. Earnings to price ratio.

  3. Sales to price ratio

Of the 504 the stock in the S&P 500 index (remember that some companies like Google issue two classes of stock – class a and class c), 447 make the cut to be included in this ETF. This is in comparison to SPYD, which only includes 79 stocks. 

High dividend-paying stocks are not synonymous with high-value stocks.

As we will soon learn, SPYV is concentrated in far less volatile stocks than SPYD, with names such as Berkshire Hathaway Inc, Johnson & Johnson, and Procter & Gamble Company topping its holdings.

Let’s do a quick 5-year comparison of SPYD and SPYV, then move on to examine the holdings and top stocks within SPYV. 

SPYD vs SPYV: 5 Year Chart

SPYV Sectors

Image from ssga.com

SPYV Top Ten Stock Holdings

Image from ssga.com

SPY vs SPYG vs SPYD vs SPYV: Performance

Let’s conclude the article by comparing the historical price performance of our four State Street ETFs.

The below two charts compare the three-year and five-year growth of $1,000 invested in our various ETFs. To enlarge the images, simply click on them!

SPY vs SPYG vs SPYD vs SPYV: 3 Year Chart

Image from ssga.com

SPY vs SPYG vs SPYD vs SPYV: 5 Year Chart

Image from ssga.com

SPY vs SPYG vs SPYD vs SPYV: Which is Best?

Every ETF on our list comes with different levels of risk. Generally speaking, SPYG has the most risk and SPYV has the least risk. 

SPY can work for investors of all ages. Its great diversification and high liquidity (its assets under management are over 4B) make this fund very versatile.  

SPYG contains growth stocks, which can be quite volatile during stock market downturns. 

Though SPYD does indeed have a very high dividend, its energy heavy portfolio can prove to be ballast on long-term term returns. 

SPYG is more suitable for younger investors, while SPYD and SPYV are best suited for older investors because of their relative price stability. 

Worth noting here are some of State Street’s competitors: Vanguard’s VOO ETF tracks the S&P 500 as well, but it does so for a lower expense ratio of 0.04%. 

Have a question or comment? Drop a line below and I’ll make sure to reach out to you!

FAQs

SPY track the S&P 500 index. SPYG tracks only the growth companies within the S&P 500 index. The SPYG ETF has 240 stocks within it while the S&P 500 currently has 505. SPYG is more volatile than SPY. 

SPYG, as determined by Morningstar’s 5 star rating, is currently a great investment for investors with a long-term time horizon looking for exposure to large-cap growth stocks. 

Historically, SPYG has significantly outperformed SPY. However, SPYG will most likely underperform SPY in the next bear market. This is because SPYG is comprised of high beta “growth” companies, which are typically in the volatile “Information Technology” sector.

Next Lesson

QQQJ vs QQQM vs QQQN vs QQQE vs QQQ: What’s The Difference?

Comparing Nasdaq ETFs

In 2022, there are a lot of different Nasdaq funds to choose from. In this article, projectfinance will compare five of the more popular ETFs in the tech space: QQQJ, QQQM, QQQN, QQQE and QQQ.

It is important to note that a few of the funds on our list are almost identical (QQQ & QQQM), while others are quite different indeed (QQQJ & QQQE). 

So which fund is best for you? Let’s first break down the data from our 5 ETFs in a table, and then put each one under the microscope!

              TAKEAWAYS

  • The QQQ ETF tracks the Nasdaq 100 Index and is the oldest and most popular fund on our list.

  • QQQM is basically an exact replica of QQQ with lower fees.

  • QQQE tracks the Nasdaq 100 on an “equal weight” basis, which provides better diversification.

  • QQQJ tracks the next 100 stocks in queue for inclusion in the Nasdaq-100 Index.

  • QQQN tracks the next 50 stocks in queue for inclusion in the Nasdaq-100 Index.
QQQJ QQQM QQQN QQQE QQQ

Fund Issuer:

Invesco
Invesco
VictoryShares
Direxion
Invesco

Fund Name:

Fund Category:

Mid-Cap Growth
Large-Cap Growth
Mid-Cap Growth
Large-Cap Growth
Large-Cap Growth

Underlying Index:

Expense Ratio (fees):

0.15%
0.15%.
0.18%
0.35%
0.20%

Number of Holdings:

101
104
49
102
102

1 Year Return:

-7.92%
+14.06%
-8.07%
+4.56%
+14.15%

Morningstar Rating:

Not Rated
Not Rated
Not Rated
☆☆☆☆
☆☆☆☆☆

Fund Inception Date:

10/13/2020
10/13/2020
09/09/2020
03/21/2012
03/10/1999

Fund Structure:

ETF
ETF
ETF
ETF
UIT

What Is the QQQ ETF?

Invesco’s QQQ Exchange-Traded Fund (ETF) is the dinosaur on our list. It was one of the first NASDAQ funds issued and has been active since 1999. The next oldest fund on our list is QQQE, which began 13 years later in 2012.

The Invesco QQQ ETF passively follows the Nasdaq 100 index. 

➥ The Nasdaq 100 Index represents 100 of the largest US and international non-financial companies listed on the Nasdaq Stock Market.

Like most of the funds on our list, QQQ is dominated by big technology companies. The larger of these companies include the “FAANG” stocks – Facebook, Amazon, Apple, Netflix, and Google.

So how have big tech companies fared in the overall market, as indicated by the S&P 500 tracking ETF SPY?

Let’s find out!

QQQ vs SPY: 5 Year Chart

As we can see, QQQ has outperformed SPY considerably over the past 5 years. 

Let’s next take a look under the hood of QQQ by looking at its sector allocation strategy and top holdings. 

QQQ Sector Allocation

Image from Invesco

Ae we can see, Invesco’s QQQ ETF is more than just a tech fund. In addition to information technology companies, its sector allocation spans across multiple sectors and industries. 

But what companies in these sectors does QQQ invest in most? Let’s take a look at the big five next!

QQQ Top Five Holdings

Company Weight

Apple Inc

12.53%

Microsoft Corp

10.22%

Amazon.com Inc

7.32%

Tesla Inc

4.95%

NVIDIA Corp

4.00%

QQQ has huge exposure to AAPL. Why is this? The Nasdaq 100 is a modified capitalization-weighted index. AAPL is the largest company by market capitalization and therefore has the greatest weight. 

Not all ETFs on our list are weighted; QQQE (which we will soon get to) is an equal weight ETF. 

What Is the QQQM ETF?

Invesco’s Nasdaq 100 ETF QQQM has a lot in common with their QQQ fund. The stocks contained within these two funds are mirror images of each other. However, there are two differences worth noting:

QQQ vs QQQM: 2 Differences

  1. QQQ is structured as a UIT (unit investment trust) while QQQM is an ETF.
  2. QQQ charges a fee of 0.20%; QQQM charges a fee of 0.15%

QQQ being structured as a UIT makes no material difference on the performance of the fund when comparing it to QQQM’s performance. 

What should interest you here is the difference in expense ratios. QQQ does indeed charge a higher fee than QQQM. Though the difference is relatively small (0.05%), over time, fees and expenses can really add up.

What we have here, essentially, is two identical funds with one charging a higher expense ratio. QQQM wins every time. 

Read! ETF vs ETP vs ETN vs ETC: What’s the Difference?

QQQM Sector Allocation

Image from Invesco

QQQM Top Five Holdings

Company Weight

Apple Inc

12.53%

Microsoft Corp

10.22%

Amazon.com Inc

7.32%

Tesla Inc

4.95%

NVIDIA Corp

4.00%

What Is the QQQE ETF?

Both QQQ and QQQM track the Nasdaq-100 Index. This index is weighted.

The top 5 stocks in both QQQ and QQQM account for approximately 40% of these funds’ value. That’s not a lot of diversification!

To answer this desire for diversification, the NASDAQ-100 Equal Weighted Index was created. 

In 2012, Direxion created an ETF to track this index: The Direxion NASDAQ-100® Equal Weighted Index Shares (QQQE).

This ETF has equal weighting on all of its holdings. For example, AAPL (which is 12.5% of QQQs holdings) represents 1% of QQQE’s fund. 

Since the smallest company in this index has the same weight as the largest company, it is better diversified. 

However, this diversification comes with a price: QQQE charges a fee of 0.35%, the highest on our list. 

Is the cost justified? Let’s compare QQQ/QQQM with QQQE to find out. 

QQQ/QQQM vs QQQE

Though QQQE is a great alternative to the top-heavy QQQ ETF, its performance has lagged. Why? It places more weight on those smaller companies, which tend to be focused on consumer staples, industries, and utilities. 

Historically, these less volatile stocks underperform the FAANG juggernauts, as shown in the 5-year chart below.

QQQE Sector Allocation

The below chart illustrates the difference between sector allocation in QQQ/QQQM (as represented by XNDX) and the QQQE equal-weighted index (as represented by NETR).

Image from Direxion

QQQE Top 5 Holdings

Every one of the holdings within the QQQE ETF has the same weight of 1%.

Company Weight

Apple Inc

1%

Microsoft Corp

1%

Amazon.com Inc

1%

Tesla Inc

1%

NVIDIA Corp

1%

What Is the QQQJ ETF?

So far, we have only looked at ETFs that track the Nasdaq 100 Index. 

Invesco’s QQQJ Next Gen ETF tracks the NASDAQ Next Generation 100 Index.

These are the companies in the waiting pool to join the Nasdaq 100. There are no mega-cap stocks in this index. QQQJ is mostly comprised of mid-cap stocks. 

Stocks in this index are the less capitalized “up-and-comers” in the tech space. 

Because of this, QQQJ can be more volatile than the other ETFs we have covered in this list. 

QQQJ Sector Allocation

Image from Invesco

QQQJ Top 5 Holdings

Company Weight

Trade Desk Inc/The

2.18%

MongoDB Inc

2.00%

Expedia Group Inc

1.97%

Enphase Energy Inc

1.95%

CoStar Group Inc

1.82%

What Is the QQQN ETF?

Victory Shares Nasdaq Next 50 ETF QQQN tracks the Nasdaq Q-50 index

This ETF is similar to the QQQJ ETF, but QQQN only tracks the next 50 stocks in line to join the Nasdaq 100. 

Let’s do a quick 1-year comparison between QQQJ and QQQN. 

QQQJ vs QQQN: 1 Year Chart

As we can see, the performance of these two ETFs is quite similar. 

It is worth noting that the stocks within QQQN are better capitalized than those that comprise QQQJ. Because of this, QQQN should experience marginally less volatility than QQQJ over time. 

QQQN Sector Allocation

Image from VictoryShares

QQQN Top Five Stocks

Company Weight

BAKER HUGHES CO

3.46%

GLOBALFOUNDRIES INC

3.09%

TRADE DESK INC

2.97%

MONGODB INC

2.80%

ENPHASE ENERGY INC

2.72%

QQQJ vs QQQM vs QQQN vs QQQE vs QQQ: What's The Best?

A lot of the funds on our list are relatively new, so it is impossible to compare their long-term performance. 

  • QQQ, QQQM, and QQQE all track the Nasdaq 100 index.

  • QQQJ and QQQN track the more growth-centric companies just outside of the Nasdaq 100.

  • A well-diversified portfolio will have exposure to as many stocks as possible, including those within the Nasdaq 100 as well as those on the cusp of joining the index.

FAQs: QQQJ vs QQQM vs QQQN vs QQQE vs QQQ

QQQ is structured as a unit investment trust (UIT) while QQQM is structured as an ETF. Though their performance is identical, QQQM charges a lower expense ratio of 0.15% as compared to the QQQ fee of 0.20%

QQQ invests tracks the Nasdaq 100 index while QQQJ tracks Nasdaq Next Generation 100 Index (Index). This latter index invest in the 101st to the 200th largest companies on the NASDAQ.

Historically, QQQE has underperformed QQQ. QQQE’s equal weight structure applies more allocation to companies outside of tech, such as consumer staples and utilities. These sectors generally underperform in bull markets. 

Next Lesson

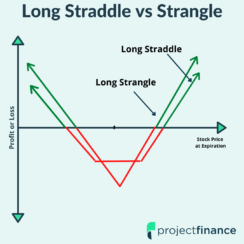
Options Straddle vs Strangle: How Do They Differ?

The straddle and strangle options trading strategies are very similar in nature. 

Both of these strategies allow investors to profit from large moves in an underlying security (long straddle/strangle) and neutral markets (short straddle/strangle).

The difference between the straddle and strangle lies in the strike price structure:

➥ The straddle only uses one strike price.

➥ The strangle uses 2 strike prices.

So what does this mean when comparing the performance of these two option strategies? Let’s find out!

              TAKEAWAYS


  • Both the long straddle and long strangle allow traders to profit from large upside and downside swings in a stock.

  • Short straddles and strangles allow investors to profit when the price of an underlying stock/ETF/index fluctuates very little over the duration of the options life.

  • The straddle has a higher degree of risk than the strangle.

  • Short straddles and strangles benefit from time decay (theta); theta works against long straddles and strangles.

  • Straddles and strangles are often sold around earnings to benefit from “vol crush”.

What Is An Options Straddle?

Long Straddle Video

Short Straddle Video

The options straddle strategy consist of two inputs:

  1. Buy/Sell 1 ATM Call Option.
  2. Buy/ Sell 1 ATM Put option.

To be a straddle, both options must be of the same strike price and expiration; the only difference is in the type of options. A straddle consists of both a call option and a put option

Buying at-the-money (ATM) call and put options will result in a long option straddle. Here is the profit/loss graph of this strategy at expiration.

Long Straddle

long straddle

Selling at-the-money (ATM) call and put options will result in a short options straddle. Here is the profit/loss graph of this neutral strategy at expiration.

Short Straddle

Short Straddle

Let’s next break own the various scenarios under which both the long and short straddle will profit, break even, and lose money. 

Straddle: Profit, Breakeven and Loss Scenarios

Long Straddle Short Straddle

Maximum Profit

Unlimited

Total premium received

Maximum Loss

Total debit paid

Unlimited

Breakeven Point

1) Strike A plus the net debit paid.

2) Strike A minus the net debit paid.

1) Strike minus the net credit received.

2) Strike plus the net credit received

Time Decay Effect (Theta) 

Sheds value as time passes, resulting is losses

Sheds value as time passes, resulting in profits. 

What Is An Options Strangle?

Long Strangle Video

Short Strangle Video

The options strangle strategy consist of two inputs:

  1. Buy/Sell 1 OTM Call Option.
  2. Buy/ Sell 1 OTM Put option.

The strangle is like the straddle in that this strategy too involves purchasing/selling both a call option and a put option of the same expiry cycle on the same underlying. There are, however, some pretty big differences. Let’s learn them next!

Options Straddle vs Strangle: Trade Setup

Straddle vs Strangle Difference #1: Moneyness

➥ The straddle generally involves purchasing at-the-money options.

➥ The strangle involves purchasing out-of-the-money options.

Straddle vs Strangle Difference #2: Strike Prices

➥ In the straddle, both options purchased are of the same strike price.

➥ In the strangle, the options purchased are of different strike prices. 

Let’s next take a look at the profit/loss graph of both a long strangle and a short strangle!

Long Strangle

long strangle at expiration

Buying an out-of-the-money call and put option with different strike prices of the same expiration cycle on the same underlying security will result in a long strangle, as visualized above.

Short Strangle

short strangle chart

Selling an out-of-the-money call and put option of the same expiration cycle on the same underlying security with different strike prices will result in a short strangle, as visualized above.

Let’s next break down the various scenarios under which both the long and short strangle will profit, break even, and lose money. 

Strangle: Profit, Breakeven and Loss Scenarios

Long Strangle Short Strangle

Maximum Profit

Unlimited

Total premium received

Maximum Loss

Total debit paid

Unlimited

Breakeven Point

1) Strike A minus the total debit paid.

2) Strike B plus the total debit paid.

1) Strike A minus net credit received

2) Strike B plus the net credit received

Time Decay Effect (Theta) 

Sheds value as time passes, resulting is losses

Sheds value as time passes, resulting in profits. 

Option Straddle Trade Example

Let’s first check out a straddle on Apple (AAPL).

➥AAPL Stock Price: $180

➥Days to Expiration: 10

➥Put Option Strike: 180

➥Put Option Premium: 1.49

➥Call Option Strike: 180

➥Call Option Premium: $1.51

So we can see here that the total cost (or credit) from this trade will be $3 (149 + 151).

Let’s fast-forward 10 days to expiration and see how this trade did. 

➥AAPL Stock Price: $180 –> $190

➥Days to Expiration: 10 –> 0

➥Put Option Strike: 180

➥Put Option Premium: 1.49 –> 0

➥Call Option Strike: 180

➥Call Option Premium: $1.51 –> $10

So how did we do? We must first determine which side of the trade we took.

Like all options strategies, the straddle can be both bought and sold. Let’s first see how the short side performed.

Short Straddle Trade Results

The initial price of our above straddle was $3. If we sold this straddle, we will profit as long as the combined value of both our short call and short put is trading under $3 at expiration.

At expiration, we can see that AAPL rallied $10 a share, all the way up to $190/share. 

This was good news for our short put. It fell in value from $1.49 to 0.

However, our short call did not fare as well. Since AAPL closed at $190 on expiration, our short call was in-the-money by $10, resulting in a final intrinsic value of $10. 

This means we lost $10 here. 

But remember, we took in a credit of $3 initially. Therefore, our total loss at expiration would be $7 ($10-3). Taking into account the multiplier effect of 100, this would result in a loss of $700.

Long Straddle Trade Results

If you understand how the short straddle works, you should have no problem understanding how the long straddle works. 

For the long straddle, we would have purchased both options originally for $3. This net debit paid is also our max loss. 

At expiration, the combined value of the put (worth $0) and call (worth $10) was $10. Remembering we paid $3 initially for this trade, the profit to us here is $7 (10-3), or $700.

This should make sense – if selling this strategy lost $700, buying it must make $700.


Option Strangle Trade Example

Let’s now check out a strangle on Netflix (NFLX).

➥NFLX Stock Price: $390

➥Days to Expiration: 20

➥Put Option Strike: 385

➥Put Option Premium: $16.10

➥Call Option Strike: 395

➥Call Option Premium: $15.90

So we can see here that the total cost (or credit) from this trade will be $32 (16.10 + 15.90).

Let’s fast-forward 10 days to expiration and see how this trade did. 

➥NFLX Stock Price: $390 –> $388

➥Days to Expiration: 20 –> 0

➥Put Option Strike: 385

➥Put Option Premium: $16.10 –> 0

➥Call Option Strike: 395

➥Call Option Premium: $15.90 –> $0

In this trade outcome, the price of NFLX did not move very much. This should tell you right away that selling options would be probably more profitable than buying options. 

Short Strangle Trade Results

At expiration, the combined value of both our short put and short call is $0.

Why? The stock closed at $388. Our 385 put is therefore out-of-the-money and valued at $0. Our 395 call is also out-of-the-money and also valued at $0.

What does this mean for us? We will collect the full premium of $32 received. Taking into account option leverage and the multiplier effect of 100, we will net a profit of $3,200 on this trade!

Long Strangle Trade Results

Since selling this straddle resulted in a profit of $32, the long party must have lost $32.

In order to establish this long strangle position, a trader paid a net debit of $32. If at expiration both of these options are worthless, this will translate to a complete loss of $32, or $3,200. Ouch!

Is The Straddle or Strangle Safer?

  • Neither the short straddle nor short strangle are safe strategies on account of their short call composition.
  • The short strangle has marginally less risk on account of its dual out-of-the-money structure.

  • Long strangles are generally cheaper to buy than long straddles. 
  • Since long strangles require a smaller net debit than long straddles, the maximum risk on long strangles makes them marginally safer than long straddles – probability aside.

When Should You Buy Strangles and Straddles?

Long straddles and strangles are best suited for traders who believe a stock is going to go up or down by a significant amount before the options expire.

 Both of these strategies are directionally agnostic. This simply means (for longs) we don’t care whether the underlying goes up or down, so long as it moves. The opposite is true for short positions in these strategies

Though long straddles cost more than long strangles, their chance of success is greater. Why? Both options bought are at-the-money. With long strangles, both the options bought are out-of-the-money, requiring the underlying to move a greater distance to achieve profitability. 

Straddles and Strangles: What's the Risk?

Straddle vs Strangle Risks

➥ For long straddles and strangles, the primary risk is time decay, or “theta”. Options are decaying assets. With every passing day, if the underlying price does not change, long straddles and strangles will shed value.

Since straddles and strangles are comprised of two options, theta occurs on both legs simultaneously in a stagnating market. 

Additionally, the underlying must move by a significant amount to breakeven on these strategies. This is particularly true in options with high implied volatility (IV).

➥ For short straddles and strangles, the risk is dually high. Theta works to the advantage of short options, but when an underlying begins to move significantly up or down, huge losses can occur!

In order to learn more about the risks associated with options, read this article from the OIC

Straddles and Strangles for Trading Earnings

The straddle and strangle are both great options strategies for trading earnings

Nobody knows how a stock will react post-earnings report. 

➥ For traders who believe a stock will make a significant move either up or down, the long straddle and strangle are great strategies to capitalize off this potential move. 

➥ For traders who believe a stock is not going to move very much post-earnings, the short straddle and strangle both allow traders to profit from the resulting “vol crush” (volatility crush) that often follows earnings reports. 

Read: How the “Straddle” Strategy Can Tell Us The “Expected Move” Post Earnings. 

Straddles and Strangles FAQs

Option straddles are comprised of “at-the-money” options. Option strangles are comprised of “out-of-the-money” options. Since out-of-the-money options are cheaper than at-the-money options, the strangle strategy is cheaper to buy than the straddle strategy. 

The riskiest options trading strategy is the short call (naked call). Both the short strangle and short straddle contain a short call and therefore have considerable risk. 

The iron condor is not a straddle. Straddles are comprised of two options while iron condors are comprised of four options. The additional options in the iron condor strategy help to offset risk. 

Next Lesson

FAQ: Can You Cash Out a Life Insurance Policy for Retirement?

Life Insurance Policy for Retirement

Insurance is a fact of life in our money-driven world. Car insurance is necessary to protect your vehicle and yourself from the repercussions of a collision. Medical insurance is required to obtain reasonably-priced medical care, at least in the United States. Dental insurance, Vision insurance, Renters, or Homeowners insurance; are all crucial kinds of protection.

In general, the concept of insurance is simple. You pay a monthly premium to maintain coverage. If something happens to whatever you’re covering (your vehicle, your health, your teeth, your home), the insurance kicks in to pay for whatever damage or replacement is necessary.

What about life insurance?

The tricky part about life insurance is that it’s strangely positioned in our culture. 

  • It’s often viewed as something you don’t need to worry about until you’re old, when it may start paying out.
  • It’s not legally mandated how health or car insurance coverage often is.
  • It’s complex enough that many people don’t want to learn about it.

Life insurance sounds simple. You pay into a policy that, when you pass away, pays out to your family. This payout can help keep them financially stable as they seek to replace your income or cover funeral and other associated expenses. Of course, all too often, people don’t think about the repercussions of their passing. 

There are many potential benefits to life insurance while you’re still alive, including the potential to cash in your policy for immediate financial help. The question is, how?

What Are The Benefits of Life Insurance?

There are quite a few benefits to life insurance, both for you and your family.

Benefits of Life Insurance

1. It’s tax-free when it pays out.

First and foremost are the tax implications. Inheritance and other forms of death-based windfalls are classified as income in some form or another and are typically taxed. Life insurance policy payments are not classified as taxable income, so your family won’t have to suffer an unexpected tax burden.

2. The money isn’t restricted.

When your loved ones receive a payout upon passing, that money is treated as ordinary money. They aren’t required to use it in one specific way; instead, they can use it for anything. This includes ongoing living expenses to a child’s college education, funeral expenses, and more.

This can be an extremely beneficial windfall for many. Considering that recent estimates place 64% of the population living paycheck to paycheck, having the insulation of a payout for many unforeseen costs relating to end of life can be highly beneficial.

Consider that the general recommendation for coverage is 7-10 times your annual income. This can mean 5-10 years of living expenses covered for your family, assuming a consistent standard of living and expenses. 

3. You may be able to cash out your insurance policy early.

Living expenses and medical bills can pile up as you reach retirement age or older, while income generally doesn’t. The usual goal is to accumulate enough wealth in retirement savings throughout your life to live comfortably in retirement, but that’s not always possible. 

You can use some forms of life insurance policy in various ways to support you in retirement, in your later years, or with specific end-of-life bills. How? Let’s discuss it in greater detail.

What Are The Different Types of Life Insurance?

If you’re hoping to get a payout for your life insurance policy while you’re still alive, you’ll need to understand the different types of life insurance and the kind of policy you have. Some types of life insurance have payouts, while others do not.

Types of Life Insurance

Here’s a brief rundown.

  • Term Life Insurance. You buy a fixed-duration policy of anywhere from one year to 30 years annually. If you pass away during that time, your family receives a payout. If you don’t, the policy expires, and no one except the insurance company gets anything. These policies have higher payouts and lower premiums to balance this risk.
  • Whole Life Insurance. You buy a policy that lasts until you die, whether that be five years from now or 40. You enroll, pay an annual premium, and are covered forever. You get a guaranteed return on your investment, and the policy accrues cash value as you pay into it.
  • Variable Life Insurance. These are variations of life insurance tied to investment accounts – the cash value of the investment rises (or falls) according to the investment vehicle attached to the policy. However, the death payout remains static, as do the premiums.

There are other variations, but these are the main versions.

A key takeaway here is that “term life insurance” cannot be cashed out. To cash out your policy or receive money from it, it needs to have some cash value. 

Term life insurance generally does not have a cash value attached, while whole life and variable insurance policies do. Term life insurance may be convertible into a permanent form of life insurance and thus enable being cashed out. Still, these policies require specific riders, usually when you’re signing up for them.

How Can You Get a Payout from Life Insurance?

Generally, there are three different ways you can get a payout from life insurance while you’re still alive. Each of these ways may have sub-options, so let’s discuss them.

1. Life Settlements

First up is the life settlement. A life settlement is selling your life insurance for a one-time payment. This payment is higher than the surrender value (which I’ll discuss later) but lower than the death benefit the policy would pay when you pass.

Life Settlements

In other words, you’re transferring your policy from yourself to a third party, usually a company that specializes in precisely this transaction.

  • The purchasing party becomes responsible for the premiums on the policy and receives the payout when you pass.
  • You receive an immediate cash payout, tax-free, which you can use for your retirement and expenses.

The biggest downside to this option is leaving your family without those benefits when you pass. If you settle your policy and then use up all of the money on retirement living expenses, your family is left with nothing but your inheritance when you pass. Of course, if you have no living family, this is a moot point.

Unfortunately, one of the biggest reasons people cash out their policy is because the lower income they have during retirement means they can no longer afford the premiums. Other unexpected expenses can require more money on hand and the desire to sacrifice uncertain future benefits for immediate tangible benefits. Selling the policy early and taking a hit is better than not being able to pay and losing your coverage entirely.

2. Cash Value

As mentioned above, whole life insurance and several other kinds of life insurance, such as variable life insurance, have a cash value attached to them. Your premiums are higher, but part of your payments goes into an account that accrues value. 

In variable, indexed, and other forms of life insurance, this may be more explicit, with the cash value riding in a market account and investing in the market through normal means, similar to retirement accounts.

Cash Value

There are three ways for a policyholder to access the cash value of their life insurance.

1.) Surrender is the first. This means, essentially, canceling your life insurance in exchange for a payout of the insurance’s cash value. You gain the cash value when you surrender your life insurance, minus a few minor processing fees. This money is then yours to do with as you will. 

Surrender may have tax implications since it is weighed against the amount you have paid as premiums. Some policies also have repercussions and penalties if you cash out while still under a specific age limit, which varies per policy.

Of course, the biggest downside of surrender is the subsequent lack of life insurance. When you pass away, your policy is already gone, so your family does not receive a death benefit.

2.) The second option is a loan. Many policies allow you to take out a loan consisting of some of the policy’s cash value. You are encouraged to repay it as a loan, though there’s generally no set repayment schedule.

These loans accrue interest if you don’t repay them. Moreover, when you pass, the value of the loan plus its interest are deducted from the death benefit paid out by the policy. The death benefit may be reduced significantly depending on how long ago you took out the loan, how much value the loan had, and how much interest accrues.

3.) The final of the three options is withdrawal. Withdrawing is similar to a loan in that it can reduce the final death payout since the payout is generally the policy value plus the cash value. Pulling cash out earlier than expected will reduce that portion of the payout.

The cash value of a life insurance policy can also be used as “implicit income” by reducing expenses. Specifically, some policies allow you to use the cash value to pay the policy’s premiums, making them more or less self-sufficient until the cash value is gone. This process leaves you with more freedom to use the rest of your money in other ways.

3. Living Benefits

The third way to get value from your life insurance policy before passing away is using the living benefits riders on your policy (if it has them). There are three main ways these benefits can occur, but these may be riders you need to attach to your policy rather than options freely available to everyone. Be sure to talk to your insurance agent to see if you have these riders. 

These riders are often called Accelerated Benefit Riders. They are usually optional and may not be available on all policies. Their payouts can range from 25% to 100% of the death benefit you would receive, either as a lump sum or as monthly payments. Typically, they increase the cost of the life insurance policy along the way.

Living Benefits

The three riders are:

  • Chronic Illness. If you suffer from an ongoing chronic illness and need significant help with daily tasks and ongoing expenses, you can get a chronic illness payout from your insurance. Chronic diseases include AIDS, heart disease, diabetes, asthma, high blood pressure, and more. 
  • Long-Term Care. LTC benefits are paid out when you require ongoing, long-term care such as assisted living or hospice care, nursing home care, or other forms of continuing care. The rider helps pay for that care as long as you need it.
  • Terminal/Critical Illness. Sometimes, a doctor will diagnose an illness you have and estimate that you have less than 12 months to live based on similar cases and your overall health. In these cases, you can receive a terminal illness payout to help with end-of-life care and other expenses associated with that final year of life.

In general, you have to work with a doctor and meet specific requirements to access these early payment riders. If you don’t meet the criteria, you can’t get the money and will need to resort to one of the other options.

Should You Cash Out?

Whether or not to cash out your life insurance largely depends on personal circumstances, so there’s no one correct answer.

Should You Cash Out

Typically, if you no longer have dependents or a family that would benefit from a death payout, receiving money early to live your own life is better than letting that money evaporate or go to the state. 

Early payments may also be beneficial to maintain the quality of life and enjoy your retirement if you otherwise don’t have the money to do so. 

In the end, the choice is yours.

Now, we turn to our readers. Are you weighing the pros and cons of cashing out your life insurance policy for retirement? What is your current situation? If you have any questions for us, please share them in the comments section below! We’d love to hear from you, and we make it a point to respond to our readers.

Next Article

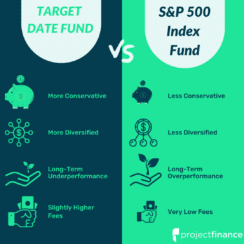
Target-Date Funds vs S&P 500 Index Funds: Which is Better?

Target Date Funds vs S&P Index Fund

Choosing between target-date funds and index funds is a very common dilemma for retirement investors with a long-term time horizon.

➥ Target-date funds are incredibly diverse investment products that aim to grow assets for a specific time frame. These low-cost funds are actively managed and restructured to offset risk as the target retirement date approaches using the “glide path” approach.

➥ S&P 500 Index funds are generally less diverse investment vehicles that have no time frame.

Because index funds have no “targeted” date, the holdings within these funds do not adapt to investors’ risk tolerance, which generally decreases with age. 

For long-term, retirement-minded investors, target-date funds appear to be the better investment strategy. Why? Target funds simplify the process of saving for retirement. Instead of choosing amongst dozens of equity and bond funds, target-date funds only require you to have one position! Within this one position are numerous assets and types of securities. 

But which type of fund actually performs best

Though nobody knows what will happen in the future, this article aims to compare the past performance of target-date funds with index funds, specifically index funds that track the S&P 500 benchmark. 

              TAKEAWAYS

  • Target-date retirement funds are designed to reduce risk as time passes and the target retirement date approaches.

  • S&P 500 index funds represent the largest 500 companies in the US and are not custom-tailored to investors changing risk levels.

  • Target-date funds contain equities of all market caps, as well as bond, international, and emerging market stocks.

  • American stocks tend to outperform both bonds and international stocks over time.

  • S&P 500 index funds can be combined with target-date funds for investors looking for more American equity exposure.

  • Index funds typically have marginally smaller fees than target-date funds, though these higher expense ratios are negligible. 

How Do Target Date Funds Work?

Target-Date Fund Definition: A target-date fund – also known as an age-based or lifecycle fund – is a mixed allocation fund that seeks to grow assets over a specified time period for a target date.

When you’re 25, you can and should take on more risk than when you’re 55. 

But how do you know what proportion of your retirement and savings should be in fixed-income (bonds) versus equities at various stages of your life? What about the large-cap to small-cap ratio? And what about money markets?

Target-date funds were designed to do this work for us. These funds rebalance as the target date approaches to change with investors risk appetites, which decrease with age.

Before the target-date fund, if an investor didn’t have a financial advisor, determining asset allocation was pretty much guesswork. And there really is no right answer – just a lot of grey.

To learn more about the various asset allocation strategies, check out our article, “What’s the Best Stock to Bond Ratio for Your Age?

To remedy this huge problem, the target-date fund was created.

Target-Date Funds History

In 1994, Barclays teamed up with Wells Fargo to create a fund that “safely” brought investors to a future date, typically a retirement date.

The result was the first target-date retirement fund. Since that time, the below firms have offered target-date funds:

The most popular provider of these target-date funds, as reported by CNBC in 2022, is Vanguard. This article is going to focus completely on funds from Vanguard, though the target-date funds from all of the above families have similar asset allocation strategies. 

Since this article is going to be comparing target-date funds with index funds, let’s explore the world of index funds before we move on

How Do Index Funds Work?

Index Fund Definition: Index funds can be either mutual funds or exchange-traded funds (ETFs). Index funds seek to track the returns of a market index. 

So index funds track market indices. What type of market indices do they track? Innumerable. Let’s look at a few of the more popular ones now:

In order to invest in these indices, investors can either purchase mutual funds or ETFs. ETFs are becoming more popular investment vehicles because of their low fees and high liquidity. 

This article is going to focus primarily on S&P 500 index funds, specifically those offered by Vanguard. There are two main products Vanguard has that provide cheap access to the S&P 500:  Vanguard’s 500 Index Fund Admiral Shares mutual fund (VFIAX) and Vanguard’s Vanguard S&P 500 ETF (VOO).

These two products are identical in almost every way. Two exceptions lie in their structure and fees:

1.) VFIAX charges a fee of 0.04%; VOO charges a fee of 0.03%

2.) VFIAX is not exchange-traded; VOO is exchange-traded

ETFs (like VOO) are exchange-traded, meaning you can buy and sell them during market hours. Mutual funds (like VFIAX) can only be traded once a day, and you never know the fill price you are going to get when you place a buy or sell order on a mutual fund. 

Advantage ETF!

For these reasons, this article will be using the VOO as its benchmark when comparing the performance of target-date funds. VOO is a top-rated S&P 500 tracker, earning 5 stars at Morningstar.  

ETF vs ETN vs ETC vs ETP: Learn the difference here!

Target Date Funds vs Index Funds: Similarities

Target-date funds have a lot in common with index funds. After all, target-date funds are comprised of index funds! In theory, you should be able to mirror any target-date fund on your own with index funds. 

This is a good strategy for investors with both higher and lower risk tolerances than the benchmark target-date fund. For investors wanting less risk, more bond funds, as well as money market funds, can be used in tandem with the target-date fund. For more risk-on investors, equity index funds can be used to supplement target-date funds.

All investors have different risk appetites. Investing is not a one-size-fits-all business. So why are target-date funds so popular? Because they’re easy and cheap!

Let’s next look under the hood of both target-date funds and index funds. 

Target-Date Funds vs Index Funds: Comparing Fees

Investing can be a costly endeavor. Funds fees can predict the future success or failure of a fund.

Fund issuers must employ teams of fund managers and price stabilizers to make sure the funds do indeed track the underlying index.  

The management fees for both Vanguard’s index funds and Vanguard’s target-date funds are both very low. However, target-date funds do have marginally higher fees.

Just about all Vanguard funds are comprised of four underlying index funds. Let’s take a look at these four fund fees individually, then take a look at the expense ratios of various target-date funds.


Index Fund Fees

Fund Expense Ratio

Vanguard Total Stock Market Index Fund Institutional Plus Shares (VSMPX)

0.02%

Vanguard Total International Stock Index Fund Investor Shares (VGTSX)

0.17%

Vanguard Total Bond Market II Index Fund Investor Shares (VTBIX)

0.09%

Vanguard Total International Bond Index Fund Investor Shares (VTIBX)

0.13%

The above funds are what constitute the vast majority of Vanguard’s target-date funds. So what fees do the actual target-date funds charge? Let’s find out!

Target-Date Fund Fees

Fund Expense Ratio

Vanguard Target Retirement 2030 Fund

0.08%

Vanguard Target Retirement 2040 Fund

0.08%

Vanguard Target Retirement 2050 Fund

0.08%

Vanguard Target Retirement 2060 Fund

0.08%

Given the relatively high fees for Vanguard’s “International Stock” and “International Bond” funds, the expense ratios for target-date funds are pretty much as they should be. 

But what are the fees for VOO, Vanguard’s S&P 500 index-tracking ETF?

Vanguard S&P 500 ETF (VOO) Fee: 0.03%

Therefore, we can conclude that investing solely in Vanguard’s S&P 500 ETF is cheaper than investing in target-date funds. 


Target Date Funds vs Index Funds: Asset Categories

S&P 500 index-tracking ETFs and mutual funds provide exposure to the 500 largest companies listed on stock exchanges in the United States. All of these companies fall under the “large cap” umbrella.

Target-date retirement funds also invest in large-caps, while adding:

  • Small-cap equities
  • Mid-cap equities
  • International equities
  • Bonds

Let’s next break down a few of these asset classes target-date funds invest in.

Target-Date Funds: Bond Exposure

We are taught from a young age that diversification is the best way to go in investing. That includes investing in both bonds AND stocks. But we are not living in our parents’ age, nor our grandparent’s age. 

In 2022, interest rates are rising, but many financial professionals believe rates will never again rise to the heights of previous decades. 

In fact, interest rates have been declining steadily since the Black Death of the 14th century! Many asset managers believe low-interest rates are here to stay

So why does this matter to us? Target-date funds are quite bond heavy. Bonds are generally less attractive than stocks in low-interest-rate environments

Over the course of a few decades, having 15% of your portfolio producing relatively poor returns may be ballast on your retirement plans. 

Additionally, bonds have taken a considerable hit this year. In the first four months of 2022, Vanguard’s Total Bond Market Index Fund ETF Shares (BND) has fallen over 4%. Quite volatile indeed for a historically “safe” asset class!

Though bonds have indeed been underperforming, it is important to note that bonds provide investors a great source of retirement income. 

BND 6 Month Performance

Target-Date Funds: International Exposure

➥ S&P 500 ETFs and mutual funds invest only in American companies. 

Target-Date Funds invest in stocks from all over the world. 

Let’s get right into comparing the historical performance of American stocks with international stocks:

International vs Domestic Stocks: 11 Years

Over the past 11 years, the S&P 500 (as represented by VOO in gold) has returned 314%. During this same time, international stocks have returned 22.68% (as represented by Vanguard’s Total International Stock ETF (VXUS).

Does this mean international stocks are poised for a comeback? Perhaps. But for the past 11 years, international stocks have barely kept up with inflation. For me, that’s a red flag for what’s to come.

Now that we have an idea of the different types of assets and securities that comprise target-date funds, let now compare them with S&P 500 index funds.

Vanguard's 2030 Target-Date Fund vs S&P 500

The below image shows the holdings for Vanguard’s Target Retirement 2030 Fund (VTHRX).

VTHRX Holdings

Let’s focus on that first fund, Vanguard’s Total Stock Market Index Fund (VSMPX).

All Vanguard target-date funds have this monster within them. This is where we are going to see overlap with S&P 500 index funds.  

In addition to containing all S&P 500 stocks, VSMPX adds small-, mid-, and large-cap growth and value stocks.

Since this fund has a target-date only 8 years away, VTHRX (2030 target-date) is very conservative, having 35% of its holdings in bonds. 

So how does this fund stack up against the S&P 500?

VTHRX vs VOO: 10 Year Total Total Return

As we can see, the S&P 500 has vastly outperformed Vanguard’s 2030 target-date retirement fund during the past 10 years.

Of course, this is to be expected given the planned retirement date for this investor is only 8 years away. As target-date retirement funds approach their specified date, the funds become more conservative and (in bullish markets) generally underperform the S&P 500.

Vanguard's 2040 Target-Date Fund vs S&P 500

Let’s skip ahead ten years and now and check out Vanguard’s Target Retirement 2040 Fund.


VFORX Holdings

As we can see, Vanguard’s 2040 fund is a little less conservative than its 2030 fund, having about 20% of its assets invested in bond funds. 

Additionally, this fund has an international equity exposure of 32%, compared to the 2030s international equity exposure of 26%.

So how has this slightly more aggressive fund performed over the last ten years in relation to the S&P 500 (as represented by Vanguard’s VOO S&P 500 ETF)?

VFORX vs VOO: 10 Year Total Return

Because of this fund’s slightly higher equity exposure, it has performed slightly better than the 2030 retirement fund over the past decade. However, the fund still pales in comparison to the S&P 500.

Vanguard's 2050 Target-Date Fund vs S&P 500

The next fund on our list is Vanguard’s Target Retirement 2050 Fund (VFIFX). Let’s see what’s under the hood!

VFIFX Holdings

Relative to Vanguard’s 2040 fund, Vanguard’s 2050 target-date fund reduces its bond exposure to 10% while increasing its international equity exposure to 36%. Additionally, its US equity exposure has increased by 6%.

So how has this more aggressive fund stacked up to the S&P 500 over the past decade?

VFIFX vs VOO: 10 Year Total Total Return

As expected, due to its more aggressive nature, VFIFX outperforms the 2030 and 2040 funds. However, when comparing VFIFX to the S&P 500, we can see it has vastly underperformed.

Vanguard's 2060 Target-Date Fund vs S&P 500

The last target-date fund we will be looking at is Vanguard’s Target Retirement 2060 Fund (VTTSX).

VTTSX Holdings

This fund currently has over 90% of its holdings in equities and less than 10% in bonds.

So how has this fund performed in relation to the S&P 500?

VTTSX vs VOO: 10 Year Total Return

The further away a target date becomes, the more Vanguard target-date funds begin to mirror one other. 

Vanguard’s 2060 fund is almost an exact replica of its 2050 fund. 

They both have ≈ 54% of their holdings in US stocks, ≈36% in international stocks, and ≈10% in bond funds. 

The ten-year performance of the 2050 and 2060 fund is therefore almost identical. 

However, when compared to the S&P 500 – again – they both underperform quite dramatically.

Target-Date Funds vs S&P 500: Which Is Right for You?

Target-date funds get a lot of things right (they produce a phenomenal diversified portfolio for individual retirement accounts) – but they get a lot of things wrong as well:

  1. Target-date funds do not take into consideration investments held outside the fund.

  2. Target-date funds assume all investors have the same risk tolerance.

  3. Target-date funds do not adapt to the ever-changing financial needs of investors.

  4. Many financial professionals believe retirement savers should have more equity exposure than target-date funds offer.

Let’s focus for a moment on the fourth item on the list. 

Warren Buffet has recommended that retirement savers should have 90% of their savings in equity at all times with the remaining 10% invested in bonds. 

Perhaps this approach is too aggressive, but investors do not need to choose one or the other. 

A great investment portfolio strategy (particularly for traditional and Roth IRAs) is to keep a portion of your retirement savings in target-date funds while managing the remaining funds on your own. This will allow you to reach the bond/equity ratio that best suits your individual risk tolerance. This approach will also allow you to invest in more asset classes, such as real estate funds. 

Additionally, having the bulk of your funds in a target-date fund will help shield you from market volatility. 


Target-Date Fund vs Index Funds FAQs

In bull markets, index funds that track the S&P 500 tend to outperform target-date funds. However, during times of high volatility, equity index funds will generally lose more in value than target-date funds, which are more conservative.

Many investment professionals believe that target-date funds do not provide enough equity exposure. Investors must understand their own risk tolerance before determining if target-date funds are too conservative (or too aggressive).

Target-date funds are very diverse products that change and grow with investors risk appetites’ (which decreases with age); index funds are static and do not adjust over time to meet investors changing needs. 

Next Lesson