?> November 2021 - projectfinance

Iron Condor Options Strategy for Beginners (w/ Visuals)

Iron Condor Options Strategy

TAKEAWAYS

  • An iron condor consists of selling both a put spread (long put/short put) and a call spread (long call/short call) simultaneously

  • Both of these spreads must be of the same width and expiration

  • Iron condor’s profit when the options sold decrease in value

  • Short iron condors are best suited for market-neutral traders

  • Most iron condors have a greater than 50% chance of success

  • Maximum loss is greater than maximum profit for most iron condors

  • A high volatility environment allows traders to collect more premium from iron condors sold

  • Iron condors with 30-60 days to expiration are ideal as this time frame allows traders to profit from time decay, or the Greek “theta”

Iron Condor Definition

The short iron condor is a market-neutral options trading strategy that involves simultaneously selling both a call spread and a put spread of the same width and expiration cycle.  

Iron Condor Inputs

Short Call Spread AB

  • Long Call A
  • Short Call B

Short Put Spread CD

  • Long Put C
  • Short Put D

Short Iron Condor Profile

Maximum Profit: Net Credit Received

Maximum Loss: Spread Width – Credit Received

Breakeven Prices: 1. Short Put Strike – Net Credit 2. Short Call Strike + Net Credit

Probability of Profit: Greater than 50%

Assignment Risk: Increases with Falling Extrinsic Value

When it comes to the more advanced options trading strategies, the iron condor is by far the most popular.

This options trading strategy is aptly named. Why? Because its profit/loss profile resembles the very wide wingspan of the condor bird.

These two “wings” each represent one spread. Since the wings go left and right, this tells us a short call spread and a short put spread are involved. When these vertical spreads are sold together simultaneously, they form the iron condor strategy.

Therefore, in order to best understand this strategy, it will first help to have mastered the “vertical spreads” options trading strategies. If you are new to spread trading, please check out our guide below before moving on.

What Is an Iron Condor?

Iron Condor Graph profit loss

In options trading, the short iron condor strategy consists of selling both a call spread and a put spread. In order to be a true iron condor, these two vertical spreads must have the same width (distance between their strike prices) as well as the same expiration.

The vast majority of traders prefer to sell iron condors, so this article will be focusing on short iron condors. If you instead want to be a buyer, just switch the lines and red and green profit/loss profiles in our examples around!

Short Iron Condor Components

  1. Sell a call spread (bearish)
  2. Sell a put Spread (bullish)

So an iron condor is selling bearish and bullish market direction. We don’t want the underlying to go up or down. Another name for this aimless direction is “market neutral”. Sellers of iron condors profit when the underlying price does not move

A short iron condor is profitable when the stock price remains between the short strike prices of both our call spread and put spread. Take a look at the below image, which shows how this strategy performs as the stock price remains between two short strike prices.

The best way to understand options trading is by looking at examples, so let’s get into one now!

Iron Condor Trade Example

Our below trade is a “50-Point” wide iron condor with 60 days to expiration (DTE). 

Trade Details

Stock Price at Trade Entry: $500

DTE: 60 Days

Call Spread: Short 550 Call for $7.89; Long 600 Call for $1.94

Put Spread: Short 450 Put for $6.15; Long 400 Puts for $0.72

Total Premium Sold: $7.89 + $6.15 = $14.04

Total Premium Bought: $1.94 + $0.72 = $2.66

Net Credit Received: $14.04 (collected) – $2.66 (paid) = $11.38

In the above trade, we netted a credit of $11.38. Don’t get too overwhelmed by all the numbers, we will be breaking them all down soon!

Since we received a net premium, this trade is therefore a credit spread. All short iron condors will be credit spreads. 

Next up, let’s take a look at the profit/loss graph for this trade.

First off, let’s study the green portion of the above graph. As long as the stock stays within the bounds of both the short call and short put that we sold, we will achieve maximum profit. We said earlier that this strategy is a market-neutral strategy. Hopefully, now you can see why. 

Now, what about the red-shaded areas? We can see that the losses begin to accelerate the further the stock price advances beyond both our short call and put strike prices. 

Let’s compare the maximum profit and loss on this trade for a moment. We can see in the upper bounds of the Y-axis that the maximum profit is +$1,138. The maximum loss, however, is -$3.862. 

So why would you risk more than you can possibly make? Because in this trade, you have a much higher chance of success than failure. Let’s take a closer look at these numbers now.

Iron Condor: Maximum Profit Potential

(Net Credit Received)

Maximum Profit: $11.38 Net Credit x 100 = $1,138

Whenever you are a net seller of options, the most you can ever make is the premium received. 

We sold this iron condor for a net credit of $11.38. Therefore, our maximum profit (taking into account the option multiplier effect of 100) is $1,138.

When will this occur? If by expiration, the stock price resides between the strike prices of both of our short options. If this occurs, all of our options will expire worthless. 

We sold the 450 put and the 550 call; therefore, as long as the stock closes between these two strike prices on expiration day, we’ll achieve maximum profit!

Iron Condor: Maximum Loss Potential

(Spread Width – Credit Received = Max Loss)

$50-Point Wide Spread Width – $11.38 Credit x 100 = $3,862

In order to determine the maximum loss on any iron condor, simply subtract the credit received from the width of the spread.

In our example, we are short the 450/400 put spread and the 550/600 call spread. Our spread is therefore 50 points wide. And how much credit did we take in? $11.38. 

So, to determine the maximum loss here, just subtract this credit from the spread width (50-11.38), which gives us a maximum potential loss of 38.62, or $3,862 when accounting for the multiplier effect.  

Losses Limited to Either Calls or Puts

Now the stock can’t be both above and below our short strike prices at expiration. In the iron condor strategy, only one side has the potential of expiring in-the-money. Let’s explore these two various outcomes now:

  • If the stock is below $400, the 450/400 put spread will be worth $50 at expiration while the 550/600 call spread will expire worthless. Iron Condor Value: $50
  • If the stock is above $600, the 550/600 call spread will be worth $50 at expiration while the 450/400 put spread will expire worthless. Iron Condor Value: $50

Maximum Loss > Maximum Profit: Why Trade?

So we have already determined that this trade has the potential to lose a lot more than it will ever make ($1,138 profit vs $3,862 loss). Why put this trade on then?

Because the odds are in your favor that the trade will expire worthless. Our maximum profit occurs when the stock is trading between $450 and $550 at expiration. That means the stock can move 10% up or down in the next 60 days (our time to expiration) and we will still achieve maximum profitability.

The below image shows this.

So will our maximum loss occur when the stock moves more than 10%? Not always. Remember, we took in a premium when we sold this trade. Taking into account this premium, the stock must move either up or down greater than 20% in order for us to have a maximum loss. When the stock breaches our short strike prices between 10% and 20%, our losses will fluctuate, but the trade will not be a maximum loss.

The below image shows this.

So we have looked at max profit and max loss; but at what prices do we breakeven?

Iron Condor: Breakeven

Since we are selling two vertical spreads, we have two breakeven points. 

To determine the two breakeven prices of an iron condor, we must:

  1. Subtract the net credit received from the short put strike
  2. Add the net credit received to the short call strike.

Let’s next break this down, starting with the put spread breakeven.

Lower Breakeven Price (Puts):

$450 – $11.38 = $438.62

When the stock is trading at $438.62 on expiration, the 450 put will be worth $11.38 while all the other options will expire worthless. This amount is also the credit we took in, so breakeven should make sense. 

Higher Breakeven Price (Calls)

$550 + $11.38 = $561.38

When the stock is trading at $561.38 on expiration, our short call will be worth $11.38 while all the other options expire worthless. Again, this is the net credit we took in, so this scenario leads to a breakeven.

Selling Iron Condors and Probability

Generally speaking, iron condors have a greater than 50% chance of success. They are known as “High-Probability” trades because of this. Understanding now that the maximum loss on these trades is greater than the maximum profit, this should make sense.

Iron Condors: Choosing an Expiration Date

Our example looked at options that had 60 days to expiration. Many iron condors that are placed have a duration of between 30-60 days. Why? 

As time passes, time decay, or “theta” sets in. Option sellers love theta. The 30-60 day range allows traders to collect quite a bit more time premium than options that expire in 7 days. 

For example, a one-point SPY Iron Condor expiring in 3 days is currently bid at 0.13. That same spread expiring in 17 days is bid at .39, triple the premium!

Iron Condors: Choosing Strike Prices

Deciding which strike prices you want to sell is a two-step process.

  1. Select the call and put option you want to short
  2. Select the corresponding options you want to buy

The width of these spreads (or the distance between the strike prices) must be the same if the trade is to be considered an iron condor.

So which options do you choose?

Start by looking at the Greek “delta”. Amongst other uses, the delta of an option tells us the odds that option has of expiring in-the-money. If an option has a delta of 0.16, it has a 16% chance of expiring in-the-money. 

Now since we are selling both a call and a put, we must add these deltas together to determine the odds these options have of expiring in the money. If both of our options have a delta of 0.16, they will dually have a 32% (16%+16%) chance of expiring in-the-money. The below image shows these deltas on the tastyworks trading platform.

If the options together have a 32% chance of expiring in-the-money, they must therefore have a 68% chance (100%-32%) of expiring out-of-the-money, which is our goal being sellers!

When To Sell Iron Condors

The best time to sell an iron condor is when volatility is high. Why? The higher the implied volatility, the greater the premium you will collect. Remember, when you are a net seller of options, you want to take in as much credit as possible. Ideally, the options you sell will expire worthless, and the full premium will be collected.

As a rule of thumb, sell iron condors when:

  1. Volatility is currently high
  2. You expect this volatility to decrease

Final Word

The iron condor is a great risk-defined strategy for market-neutral traders. 

As mentioned before, the best time to sell an iron condor is when implied volatility is elevated. As long as this volatility settles, you will probably be in good shape. Many times, however, volatility can build upon itself. 

It is always wise to step back and take the general temperature of a stock (or ETF or index) before placing an iron condor. If you believe the volatility will be short-lived, you will have a high chance of success. 

However, during volatile times (like the pandemic) shorts can be breached. But the best part of this strategy is its risk-defined nature. Unlike selling options naked, here, you know exactly how much you can lose.

As stated by the Options Industry Council, it is wise for traders to monitor short in-the-money options as they may be at risk of assignment

Recommended Video

Next Lesson

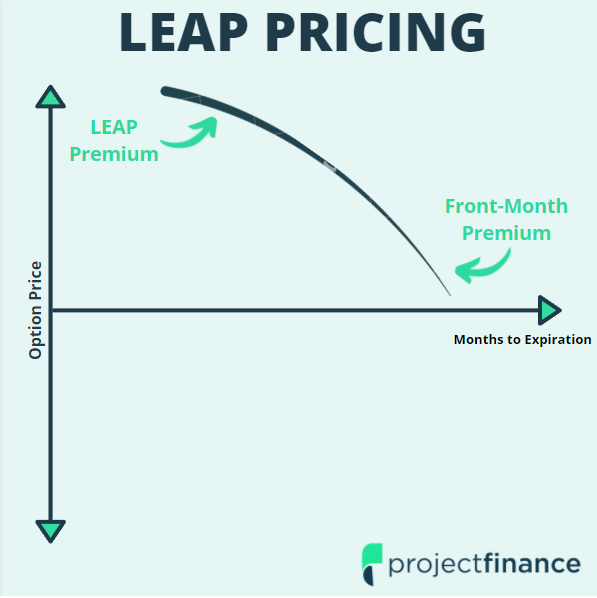
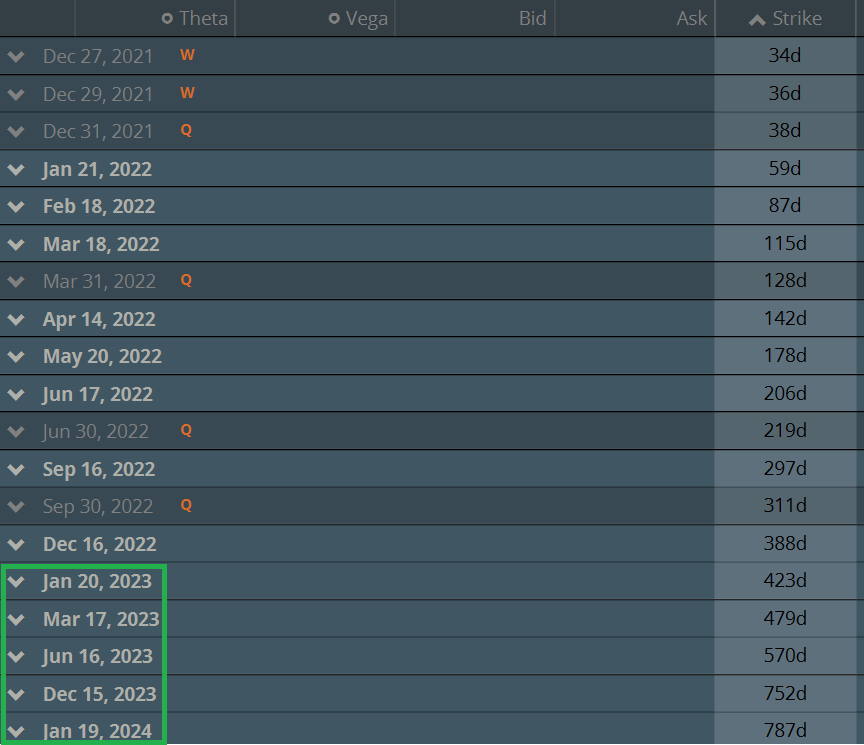
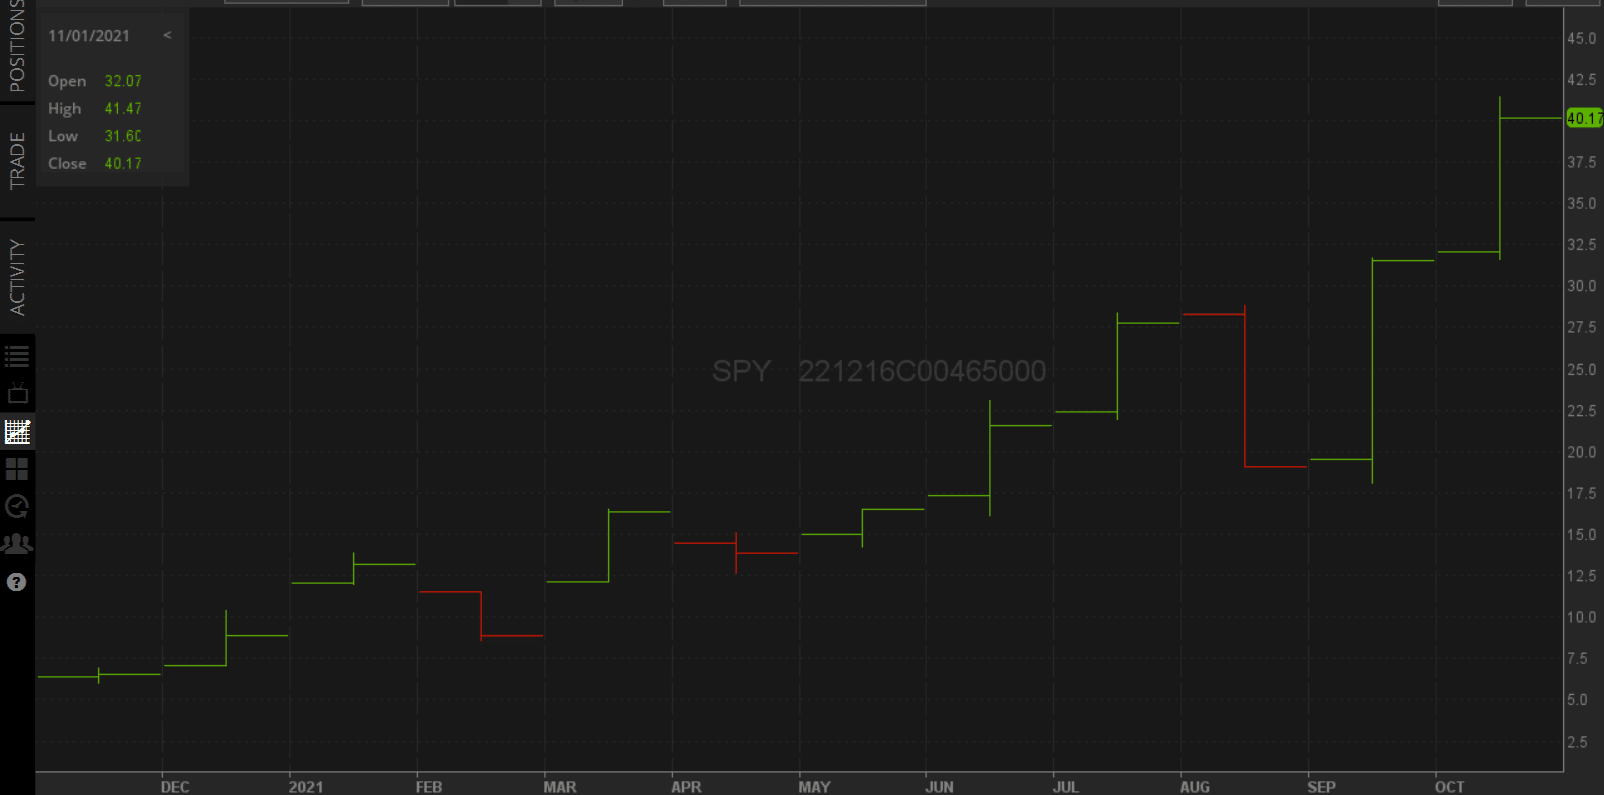
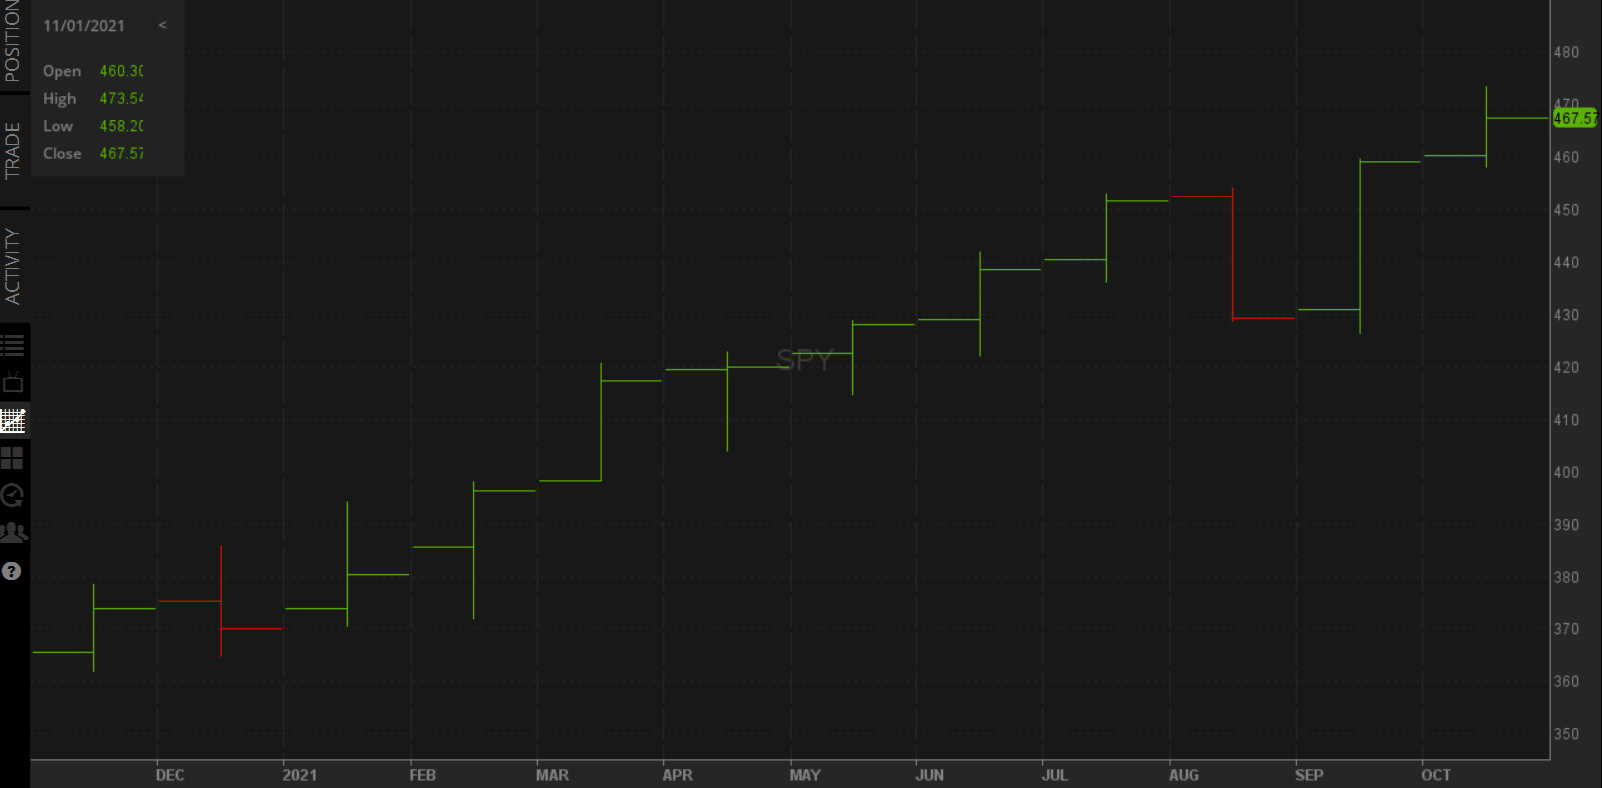
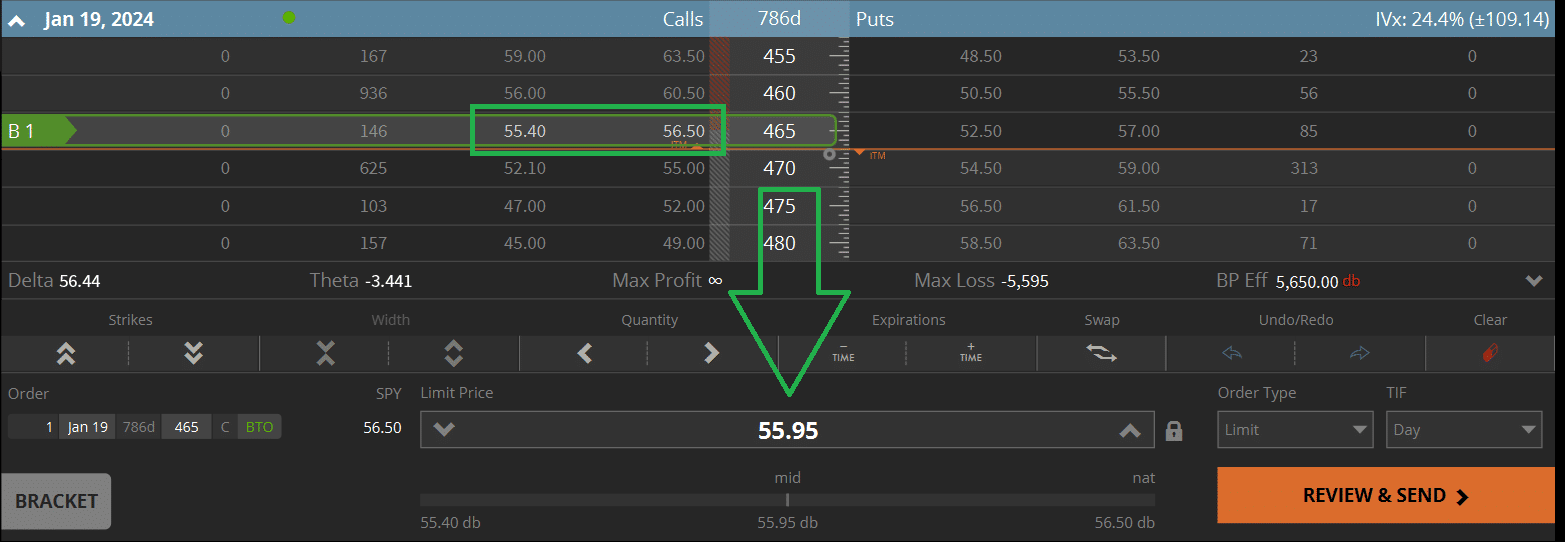
Long-Term Equity Anticipation Securities (LEAPS) Explained

LEAP Option Chart

The vast majority of options traders place trades that have a lifespan of 30-60 days. For this reason, those who utilize options are often referred to as “traders” rather than “investors”.

But not all options expire in this narrow window. Some options expire several months or even years in the future. These types of derivatives are known as long-term equity anticipation securities, or simply LEAPs.

According to the OIC (Options Industry Council), LEAP calls enable investors to “benefit from stock price rises while risking less capital than required to purchase stock.”

Although LEAPs do indeed offer less principal risk when compared to equities, the probability of success is less in LEAPs than stocks.

Because of their long lifespan, LEAPs (though still options) act more like investment vehicles than trades. Long-term options are best suited for long-term bullish (or bearish for puts) investors on an underlying stock or security.

Should LEAPs find a home in your portfolio? In this article, projectfinance will make an argument for (and against) LEAPs.

TAKEAWAYS

  • LEAP options have expiration dates of more than one year in the future
  • Long-term options are always less liquid than short-term options
  • The wide bid-ask spread in LEAPs is attributed to low open interest and volume
  • When compared to short-term options (such as front-month options), LEAPs are less sensitive to time decay 
  • The leverage of LEAPs allows for magnified profits and losses when compared to buying the underlying stock/ETF

What are LEAPs in Options Trading?

Long-Term Equity Anticipation Securities (LEAPs) Definition: In options trading, LEAPs refer to call and put options which have expiration dates that are more than one year in the future.

There is no set time frame that defines a LEAP, but generally, options that have an expiration date that is greater than one year from the present are considered LEAPs.

Let’s take a look at how SPY (S&P 500 ETF) LEAPs appear on the tastyworks trading platform. 

SPY Options Chain

SPY LEAPS

We’re going to focus on the bottom portion of the above image, where LEAPs are circled in green. 

Today is November 23, 2021. Some of these options don’t expire until January of 2024! We can see to the right of the month that these options expire in 787 days. That’s a lot of time!

These options are known as long-term equity anticipation securities.

We assume in this article that you have already mastered the basics of options trading. If options are new to you, check our free, comprehensive guide on the subject below!

The best way to understand LEAPs in both calls and puts is by comparing them to more popular, short-term options. Let’s get started!

Short-Term vs Long-Term Options: The "Spread"

Generally speaking, the closer an options series is to expiration, the more popular those options are. “Front-Month” (or week) options are the next to expire, and listed first on an options chain. Take a look at the below image, which shows call options on SPY set to expire tomorrow.

SPY Front-Month Call Options

What we are interested in here is the “bid-ask” spread (the two columns to the left of the “days to expiration” column).

Let’s focus on the 467 call strike. This option can currently be sold at 2.46 and purchased at 2.47. This means we can enter and exit this position right now and only 0.01 would be lost. 

How do these spreads look on longer-term options? Let’s take a look!

SPY LEAP Call Options

From the above LEAP options chain, we can see the spreads for the at-the-money call options have widened from being one penny wide to $4-$5 dollars wide!

Additionally, the premiums are quite a bit higher – the greater the time to expiration, the higher the premium will be. 

So what do these wide spreads mean?

If we were to buy at the ask price, and immediately sell at the bid, we would lose about $4. When taking into account the multiplier effect, that’s a $400 loss on a one lot!

LEAPs, therefore, are considerably less liquid than their shorter-term counterparts.

This liquidity problem is caused by two factors: volume and open interest.

Volume and Open Interest in LEAPs

  • An options volume tells us how many contracts in that particular expiration and strike price have traded all day. 
  • An options open interest tells us how many contracts are currently in existence for a particular option.

Both of these play a huge factor in determining the bid/ask spread that we talked about earlier. The more volume and open interest an option has, the tighter its spread will be.

If you take a moment to look at these metrics in both short-term and long-term options below, you will understand why LEAPs have such wide spreads.

SPY Short-Term Options Volume and Open Interest

SPY Call Short Term Volume and Open Interest

SPY Long-Term Options Volume and Open Interest

PY Call Long Term Volume and Open Interest

Let’s take a look at the 470 calls on the top options chain first.

These options will expire tomorrow; 27k contracts have traded so far today (and it’s only the morning!)

Additionally, we can see the open interest for the 470 call is 12.9k contracts.

Now, how do these metrics look on the LEAP options chain below?

Zero of the 470 strike price calls have traded today. And the open interest? 623. Compare these numbers to the ones above, and you’ll see why the markets for these two options expirations are so different. 

Short-Term Options vs LEAPs: Time Decay

When you’re trading short-term options, you’re paying very close attention to time decay. Time decay is also known as “theta”, which is one of the option Greeks.

If you’re long an option that is set to expire in a few days and the underlying stock price has not been moving, your option will decrease in value. 

This is bad news for long option traders. Short option traders, however, love time decay because it leads to the option falling in price. 

LEAPs are not as sensitive to time decay, or theta, as short-term options. Since there is more time to expiration, the stock has a better chance of rising (for calls) or falling (for puts) to a set strike price. 

Undulations in the stock price do indeed affect the pricing of long-term options, just to a much smaller magnitude than options expiring a few days, or weeks, away.

Short-Term Options vs LEAPs: Implied Volatility

So we learned above that theta is not as detrimental to long-dated options when compared to short-dated options.

But what about implied volatility? What impact does implied volatility have on the pricing of LEAPs?

Generally speaking, the implied volatility of long-term options is greater than that of short-term options. This is part of the reason why LEAPs are so expensive. 

Nobody has any idea what is going to happen a year or two down the road. Market-makers, therefore, charge a premium for this uncertainty in long-term options. 

As a rule, the higher the implied volatility, the greater the premium for long-term options will be. 

If you want to buy a LEAP, the best opportunity will probably be during a low-volatility environment. 

LEAPs: Leveraged Return Potential

One options contract typically represents 100 shares of stock. Because of this immense leverage, options offer traders the potential for huge returns, as well as losses. For LEAPs, these profits (and losses!) can be magnified.

If you were bullish on SPY one year ago today, you would have made far more money if you decided to purchase a long-term call option when compared to the exchange-traded fund (ETF) itself. 

Let’s say you decided to take this risk, and you purchased a SPY DEC 16, 2022 call option one year ago today.

The below image (from the tastywork platform) shows your return on this option (click to lighten and enlarge).

SPY DEC 16 2022 Call Chart: One Year

One year ago today, the above SPY option was trading around $5. Today, that option is trading at $40. You would have netted a 700% return!

Now what if we had purchased stock instead?


SPY Stock Chart: One Year

Over the past year, SPY stock increased from $365 to $467 per share. This makes for a very attractive return of 28%.

When compared to our LEAP, however, 28% suddenly doesn’t sound too great. 

This example is rare; most of the time, over the long-run, stocks/ETFs outperform options. Our example does, however, give us an idea of the great leveraged returns that options offer. 

Final Word

On top of all the other types of risks that come with options trading, LEAPs introduce yet one more: liquidity risk. 

If you want to trade long-term options, it is vital that you try and get filled at the mid-point. 

How do you do this?

If a LEAP option is bid at $55.40 and offered at $56.50, your best bet would be to place an order (either buy or sell) at the middle point. This point would be about $55.95 (as seen below).

Getting Filled at the Mid-Point

If you don’t get filled here (and really want to be in the trade) start working that price up (if you’re buying) or down (if you’re selling) in 0.05 or 0.10 increments. 

If you still aren’t getting filled, it is probably best to avoid that option. 

In more liquid products (like SPY) you’ll have a better chance of getting a decent fill than more exotic stocks and ETFs.

Thanks for reading and happy trading!

Next Lesson

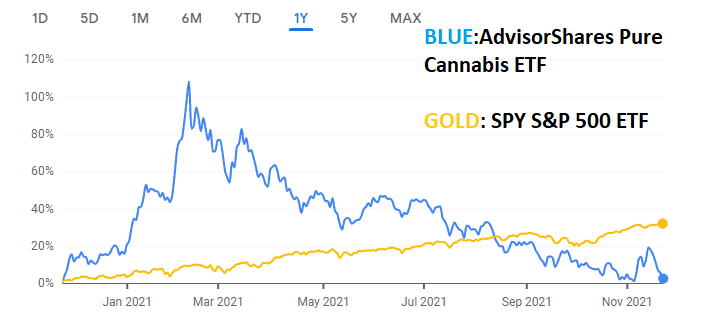
PSDN: AdvisorShares Poseidon Cannabis ETF Explained

Cannabis Leaf Caution

The investment firm Poseidon recently teamed up with AdvisorShares to launch a new leveraged cannabis ETF: the AdvisorShares Poseidon Dynamic Cannabis ETF (PSDN).

What makes this ETF stand out in comparison to other cannabis funds is its leverage. By using swaps and derivatives, PSDN aims to apply moderate levels of leverage on up to 150% of the portfolio’s assets. This leverage will inevitably lead to more volatility. Therefore, PSDN is better suited for very bullish investors with higher risk tolerance. 

Should this leveraged ETF find a home in your portfolio? For your review, projectfinance has dissected the fund’s prospectus.

TAKEAWAYS

  • PSDN invests in the cannabis and hemp industry
  • The fund is actively managed, making it more agile to market changes
  • Because of its active management style, PSDN charges a high expense ratio of 0.92%
  • PSDN is well diversified, investing in cannabis sub-sectors which include software tech, biotechnology, pharma, internet enabled devices and agriculture
  • PSDN will also seek opportunities from both IPOs and mergers in the cannabis space
  • PSDN leverages its portfolio by trading derivatives, including “swaps”

PSDN: Expense Ratio

The first thing I look at before investing in a fund is the expense ratio. Over the past few years, the fees that exchange-traded funds (ETFs) charge have been drastically decreasing.

So what does AdvisorShares/Poseidon’s PSDN charge? I found it tucked away in the bottom corner of the fund’s information page.

  • Management Fee: 0.80%
  • Other Expenses: 0.12%
  • Net Expense Ratio: 0.92%

The net expense ratio for PSDN is 0.92%, twice as high as the average ETF fee of 0.40%. Why do they charge so much?

Leveraged ETFs require more maintenance than passively managed funds. Because of this work that must be performed, the expense ratios on such funds are generally high. PSDN’s net fee of 0.92%, however, is extremely high.

As this ETF is brand new, we must allow some time to see if the funds performance merits such a high fee. 


PSDN: Investment Strategy

The “fund objective” of PSDN is rather generic, stating they simply wish to seek, “long-term capital appreciation”. 

The fund’s investment strategy, however, gives us a better idea of its unique approach. 

PSDN is not, therefore, a pure cannabis play. The companies in which they invest must make half of their money from marijuana and hemp. Where does the other half come from?

What will make this fund attractive to most investors is the second part of their investment strategy: investing in derivatives. Let’s take a closer look at that next. 

PSDN: Leverage Utilized

What differentiates PSDN from other popular cannabis ETFs (like CNBS and YOLO) is their proposed use of leverage. 

There is little information on what derivative instruments, exactly, the fund plans on utilizing to gain this leveraged exposure. PSDN’s prospectus states that “total return swaps” will be included.

Swaps are like options contracts and futures in that they are both derivatives, but that’s where their similarities end. 


  • Swaps are customized derivatives that trade in the over-the-counter (OTC) market
  • Options and futures are standardized securities that trade on public exchanges

Unlike options, swaps are private agreements between parties. Though many types of swaps are indeed regulated by the government, counterparty risk is still present. The risk with swaps is that one party may not follow through on the prearranged agreement.

PSDN: Market Sectors

The PSDN ETF includes a large range of sectors within the cannabis industry. Below are a few of the sectors on the radar of Poseidon/AdvisorShares’ fund:

PSDN: Top Ten Stocks

Poseidon’s PSDN fund currently owns around 30 stocks. This is not a very well-diversified ETF.

Additionally, the top-ten holdings comprise more than 70% of the fund’s value. Note the first security on the list: GREEN THUMB INDUSTRIES SWAP REC.

If you’re able to find out what, exactly, this represents, please let me know!

PSDN: Top 10 Holdings

Company/Security Portfolio Weight
GREEN THUMB INDUSTRIES SWAP REC
12.19%
REC AYR WELLNESS INC
8.51%
VERANO HOLDINGS CORP SWAP REC
8.31%
TRULIEVE CANNABIS SWAP REC
8.09%
ASCEND WELLNESS HOLDINGS SWAP REC
8.08%
CRESCO LABS INC SWAP REC
6.86%
WM TECHNOLOGY INC
5.92%
CURALEAF HOLDINGS INC SWAP REC
5%
JUSHI HOLDINGS INC SWAP REC
5.40%
PLANET 13 HOLDINGS SWAP REC
5.02%

data from advisorshares

Cannabis Stocks vs S&P 500

So how does the cannabis industry stack up to the S&P 500? 

If you’re going to be investing in an ETF, you’d hope that ETF has been outperforming the market -particularly when there is leverage involved.  

The below image compares the one-year performance of AdvisorShares’s YOLO Cannabis ETF (blue) with the SPDR S&P 500 Trust ETF (gold).

SPY vs YOLO

SPX vs YOLO

Chart from Google Finance

Although cannabis stocks began the past year with a roar, they have since quieted down. A lot. The S&P 500 has easily outperformed the cannabis industry as a whole in 2021. And in 2022? Who knows what will happen. 

However, I’m not sure I would want to own a non-leveraged cannabis ETF in this presently under-performing sector! 

Final Word

Getting involved with leveraged securities can be a dangerous game. If you don’t understand completely what comprises a product, it is probably best to stay away. Swaps and derivatives can blow up fast. I’ve learned the hard way!

I’ll leave you with this advice. 

Years ago, I was thinking about buying a cafe (I know nothing about restaurants).

I asked a restaurateur friend what his thoughts were.

“If you have to ask what you’re getting involved with,” he replied, “the restaurant business isn’t for you.”

With that being said, if you truly want to learn more about leveraged ETFs, check out our video below!

Recomended Articles

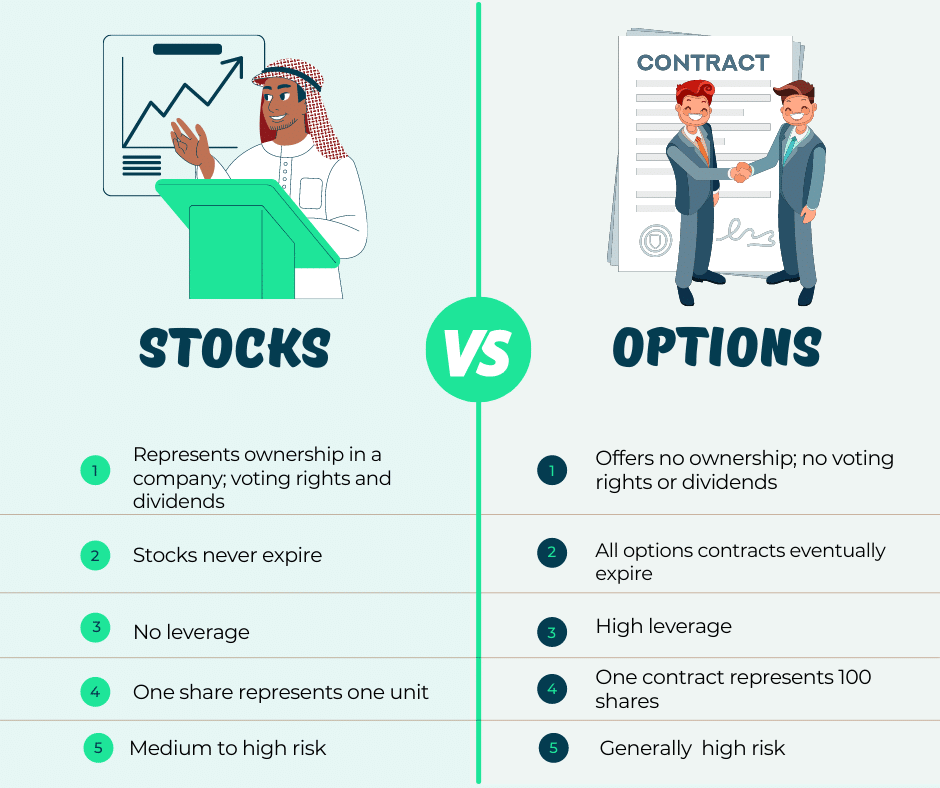
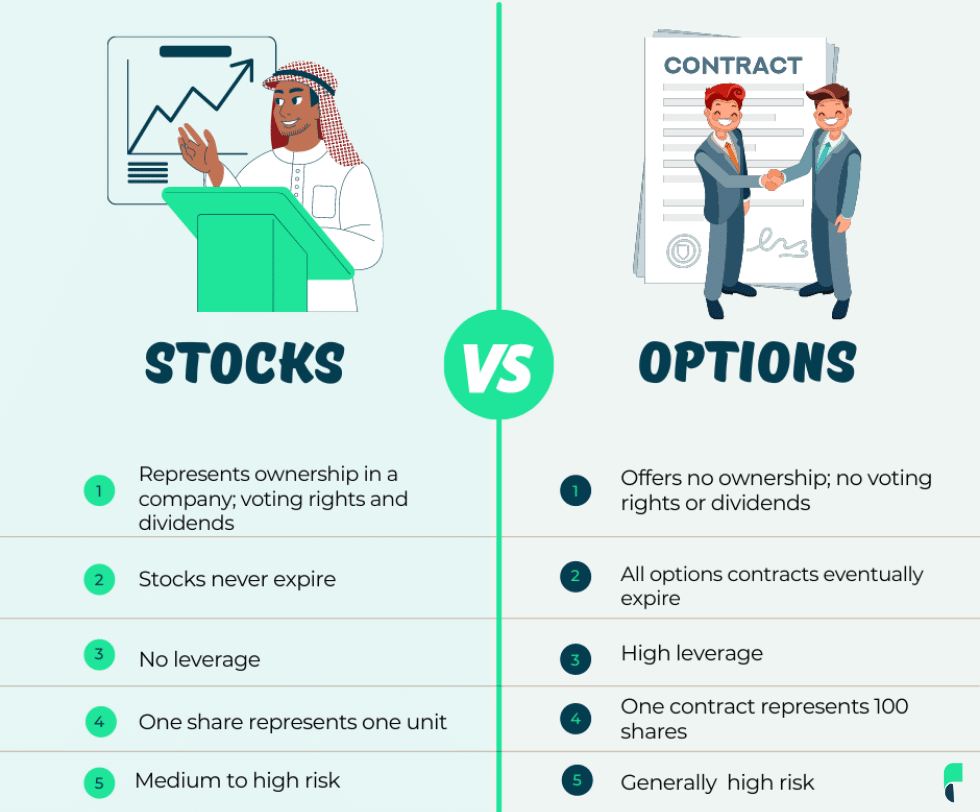
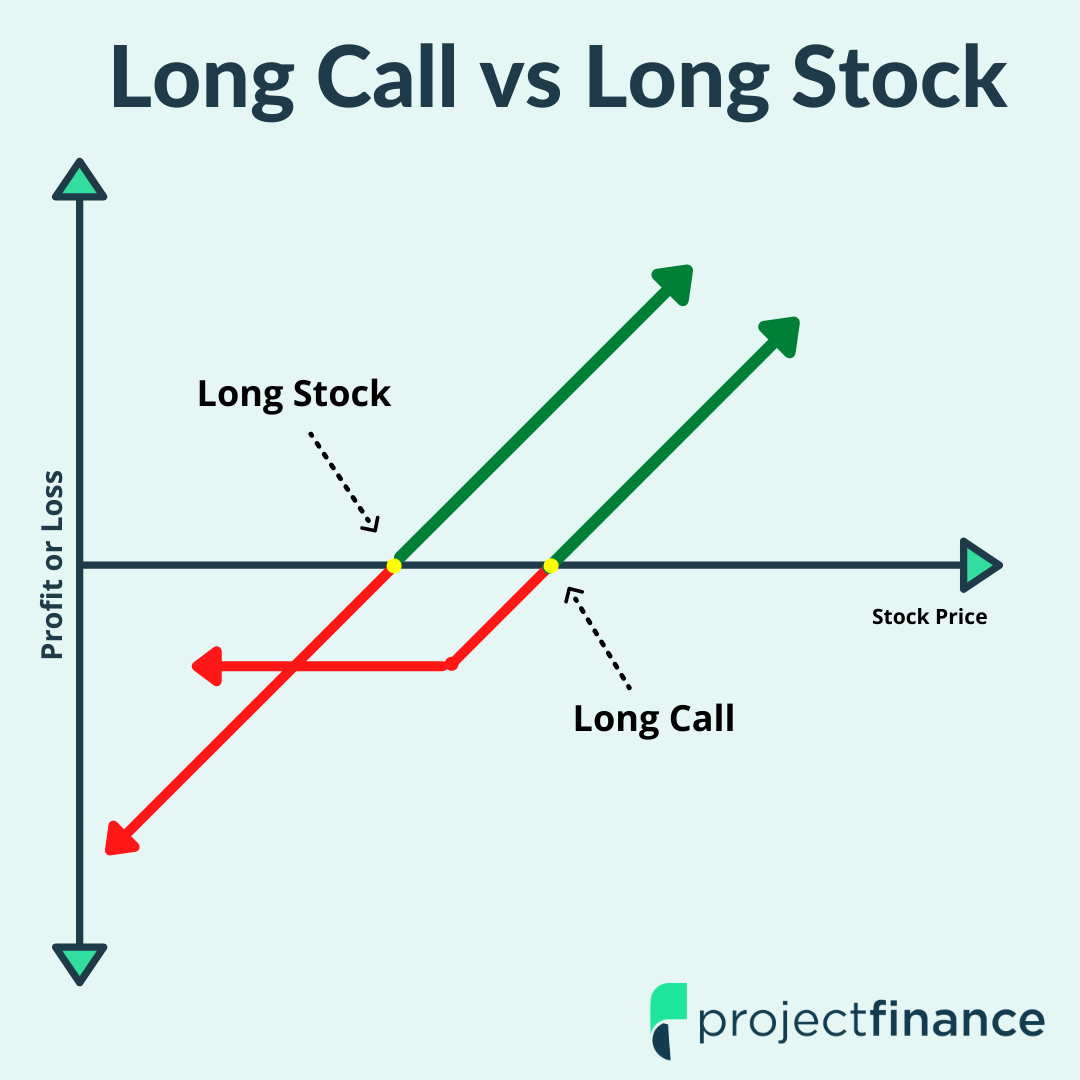
5 Ways Stocks Differ From Options

Comparing stocks to options is like comparing apples to oranges. They are completely different types of securities.

If you own a share of a company’s stock, you own a portion of that company. This comes with added benefits and rights, such as dividends and voting rights. Stock ownership is referred to as “equity“. 

Options are “derivatives“, meaning their value is derived from that of an underlying stock (or ETF, or any asset, for that matter). They have nothing to do with the company – think of them as “side-bets”.

Let’s take a look at a few key options characteristics before we move on.

  1. One options contract typically represents 100 shares of stock. This is known as “leverage” and has the potential to magnify both profits and losses quickly. 

  2. All options are either calls or puts. A long call position is bullish, while a long put position is bearish. In both types of these options contracts, a “strike price” and an “expiration date” are set.

  3. Unlike stock, all options will eventually expire.

  4. An options “moneyness“, (which tells us where the options strike price is in relation to the stock price) at expiration will determine whether a contract has value or not. 

  5. Stock is generally a longer-term investment. Options are shorter-term trades.

TAKEAWAYS

  • For long-term investors, stocks are almost always the better option.
  • Like stocks, options contracts can be bought or sold. The holder (owner) of an option contract has the right to either purchase stock (calls) or sell stock (puts) at the contract’s strike price.
  • Options are usually leveraged at a ratio of 100:1, meaning one contract represents 100 shares of stock. This leverage increases risks. 
  • Most (not all) stocks pay dividends. Options do not pay dividends. 
  • Both options and stocks are considered high risk. However, certain options trading strategies have considerably more risk than stocks. 

Options vs Stocks

STOCKS OPTIONS

Ownership

Represent direct ownership in a company; can vote and receive dividends

No direct rights, but long options holders have the right to convert their contract to either long stock (calls) or short stock (puts) 

Multiplier Effect

One share represents one indivisible unit of capital

One options contract typically represents 100 shares of stock

Expiry

Shares of stock (equity) never expire

ALL options contracts have an expiration date, ranging from one day to years away

Security Style

Stocks are generally long term investments 

Options are generally short-term trades

Risk

Medium to High Risk

Generally high risk, but this depends upon the options trading strategy utilized

This article looks at the main differences between stocks and options.  In order to truly understand these differences, you must understand the mechanics of options trading, which can take some time.

The good news? projectfinance has created perhaps the most intuitive guide out there to aid you in this process. Check out our, “Options Trading for Beginners” guide here.

For those ready to move forward with the comparison between stocks and options, let’s get right to it!

1. Ownership: Stocks vs Options

Let’s start off with one of the major differences between stocks and options: Ownership.

Ownership Rights in Stock

When you own shares of a company’s stock, you own part of that company. Being an owner comes with its benefits. Here are a few perks that come with owning equity in a company:

Perhaps the most important right on this list is the ability to receive dividends. You may not want to spend your weekends digging through the payrolls of a company of which you own 10 shares of stock, but you’ll probably want to receive that dividend. 

Though dividends may seem small on paper, they really add up over time! In fact, over the past 20 years dividends have accounted for 43% of the S&P 500s historic return! Take a look at the below image from BNY Mellon.

S&P 500 Dividend Growth Chart

Data from BNY Mellon Investment Management

IMPORTANT! Not all companies pay dividends! Up-and-coming growth companies tend to invest superfluous income back into the company rather than distribute it to shareholders.

Ownership Rights in Options

Options Contract Definition: An options contract gives the owner the right  to purchase (call) or sell (put) 100 shares of a company’s stock at a specified price (strike price) by a predetermined date (expiration date).

Traders’ long options contracts have none of the four rights listed above for stock investors. In a company’s eye, options traders do not exist.

Why? 

Options contracts are “derivatives.” These contracts are exchanged between market participants who are not involved with the company. As we saw in the definition, options contracts give the holder the right to either buy (for call options) or sell (for put options) shares of the underlying stock at a specific price by a specific date. When this happens, it is called “exercising” your option. 

When a long call is exercised, it is typically transferred into 100 shares of long stock. When that happens, you have all of the rights listed above. But before this transformation occurs, you will have zero rights.

Put options, however, are transferred into short stock. Short stock (like options) has no rights. 

2. Multiplier Effect: Stocks vs Options

We mentioned in the above paragraph that an option contract represents 100 shares of stock. Let’s take a closer look at that now.

Multiplier Effect in Stock

One share of stock represents one divisible unit of capital. If you want to determine what percent ownership a single share of stock represents in a company, simply divide one share of stock by the total share of stock that the company has outstanding.

Multiplier Effect in Options

One options contract almost always represents 100 shares of stock. This produces a ratio of 100:1.

You may have heard that options trading is a risky business, and you’d be right. Because of this multiplier effect, options contracts have profound leverage. 

If a stock is trading at $50/share, it will cost you $50 to purchase one share. 

If an options contract is trading at $2, it will cost you $200 to purchase one contract. Why is this? Because of the multiplier effect of 100! Therefore, in order to determine the true cost of an options contract, you simply need to move the decimal point of the quoted price two places to the right.

3. Lifespan of Stocks vs Options

Time and Money

Next up, let’s take a look at the different lifespans of stock and options.

Stock Lifespan: Potentially Infinite

Stocks have no listed expiration date. Over time, most companies will eventually go bankrupt, merge, or get bought out, but these events are often unseen. Some companies have been around for a very long time. State Street Corporation, for example, has been around since 1792! 

Options Lifespan: Finite and Predetermined

Unlike stock, every single options contract has a predetermined expiration date. If by this date your long call or put option is “out-of-the-money”, it will expire worthless and you will have lost the entire premium paid. 

As time passes and the underlying stock price drifts away from the strike price of an options contract, time decay will set in. This is known as “theta”, and is the reason why most beginner options traders are unsuccessful. Theta is one of the option “Greeks” which traders use to help manage risk. 

It is true some options contracts are more long-term, with Long-Term Equity Anticipation Securities (LEAPS) having lifespans of more than two years. However, no option contract spans centuries, like many stocks do,

4. Investment Style: Stocks vs Options

Stock traders and options traders frequently have different investment philosophies. 

Stocks Are Investments

Generally speaking, the mindset of stock investors and options traders is vastly different. Most people who purchase stock do so with the intent of holding the position long-term, riding the ups and downs of the company’s profits and losses, hoping, somewhere down the road (maybe years), to sell that stock for a profit. 

Stock inventors generally utilize the “set it and forget it” method. After purchasing a stock, they don’t have to check the position every day, nor do they have to manage it. They just sit back, collect dividends (sometimes), and hope the price appreciates. 

Option Are Trades

This is different for options traders. Why? 

We mentioned before that all options have a strike price and an expiration date. If the underlying price moves away from an options strike price, a trader will need to take maintenance action to 1.) avoid further losses or 2.) avoid being “assigned” (for short options positions). 

Over the long run, stock investors tend to outperform options traders. However, this isn’t always the case. The success of an options trader depends dually upon that trader’s savviness as well as a certain amount of luck.

Why luck? 

Generally speaking, we have a better idea about what is going to happen to the price of a security over the long term. If you believe in Apple, buying shares of AAPL may very well pay off in the long-term. But what’s going to happen tomorrow at AAPL headquarters? Nobody can foresee this. 

Because stocks don’t expire, they have the ability to ride out short-term volatility. Options? Not so much.

5. Risk: Stocks vs Options

Jumping over risk

Last up, let’s take a look at the fundamental risk profiles of both stocks and options.

Stocks Are High Risk Investments

When compared to treasuries, bonds, and money markets, stocks are considered risky assets. 

So stocks are indeed risky. When you diversify your stock positions across numerous companies, however, this risk can be mitigated. Exchange-traded funds (ETFs) offer a great way for investors to diversify. 

However, everything is relative. When comparing stock investing to popular options trading strategies, the former is indeed less risky in nature. 

Options Are VERY High Risk

Options trading is an intricate and complicated world. There are indeed options trading strategies that you can put together that lower your overall risk when compared to stock. But this article is focused on the more popular strategies such as buying calls and puts. 

When compared to buying stock, buying options is riskier. 

This is a wide assumption and made from an “overall” viewpoint. 

In theory, however, options typically have less principal risk than stocks. 

Why?

A call option on AAPL is going to cost you a lot less than buying 100 shares of AAPL stock (which is the amount one options contract represents).  Therefore, your total principal risk when trading options is less than that of stock! Check out the graph below, which shows how the max loss on stock is greater than a call option (where you will only ever lose the premium paid).

However, over time, time decay (AKA “theta“) sets in, and long options often lose money. AAPL stock probably won’t go to zero; an out-of-the-money call bought on AAPL, on the other hand, probably will go to zero.  

Additionally, notice in the graph how the stock needs to move up quite a bit for a long call to breakeven (yellow dot). Breakeven here is determined by strike price + premium paid.

With stock, breakeven occurs the moment you purchase (or sell) the security. 

Final Word

Buying a share of stock is one of the simplest ways to invest. You click a mouse button, and voila, you’re filled. All you need to do is (hopefully) collect dividends, and wait for the price to appreciate. 

Options trading can get extremely complicated. Huge sums of money are made and lost every day in the options markets. If you’d like to learn more about options trading, check out our guides below!

Next Lesson

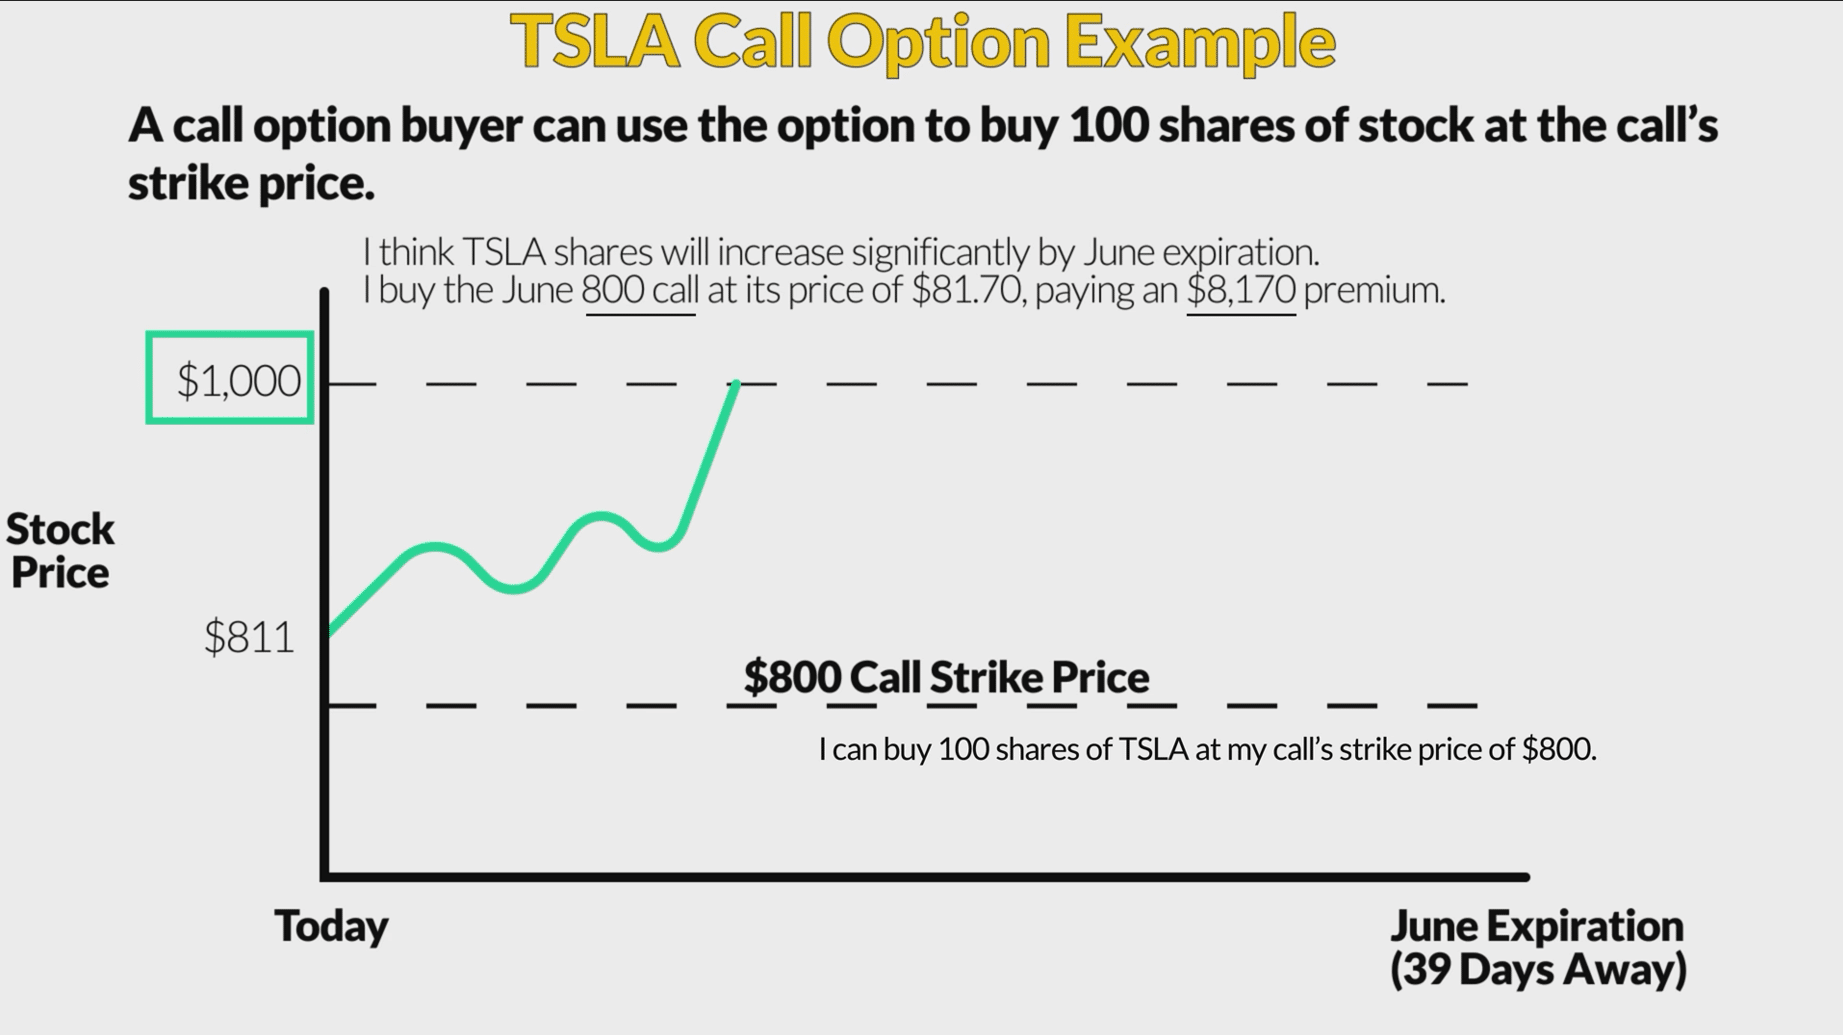
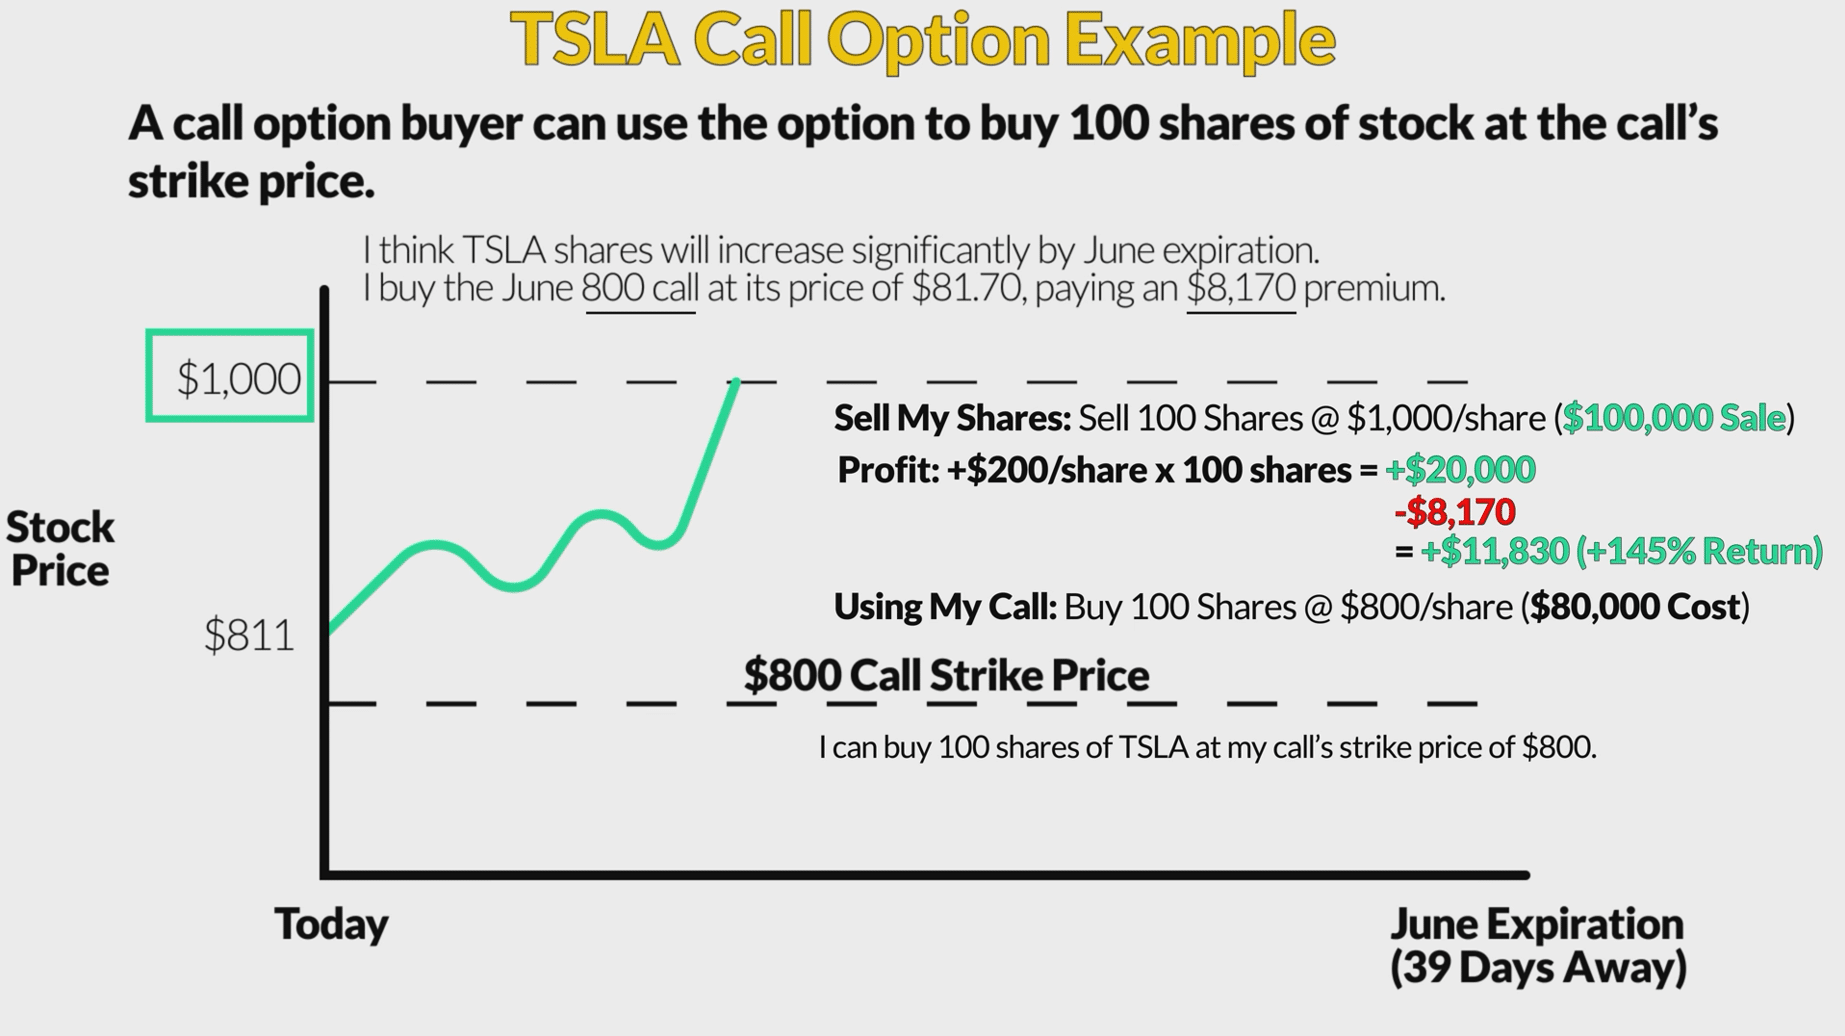
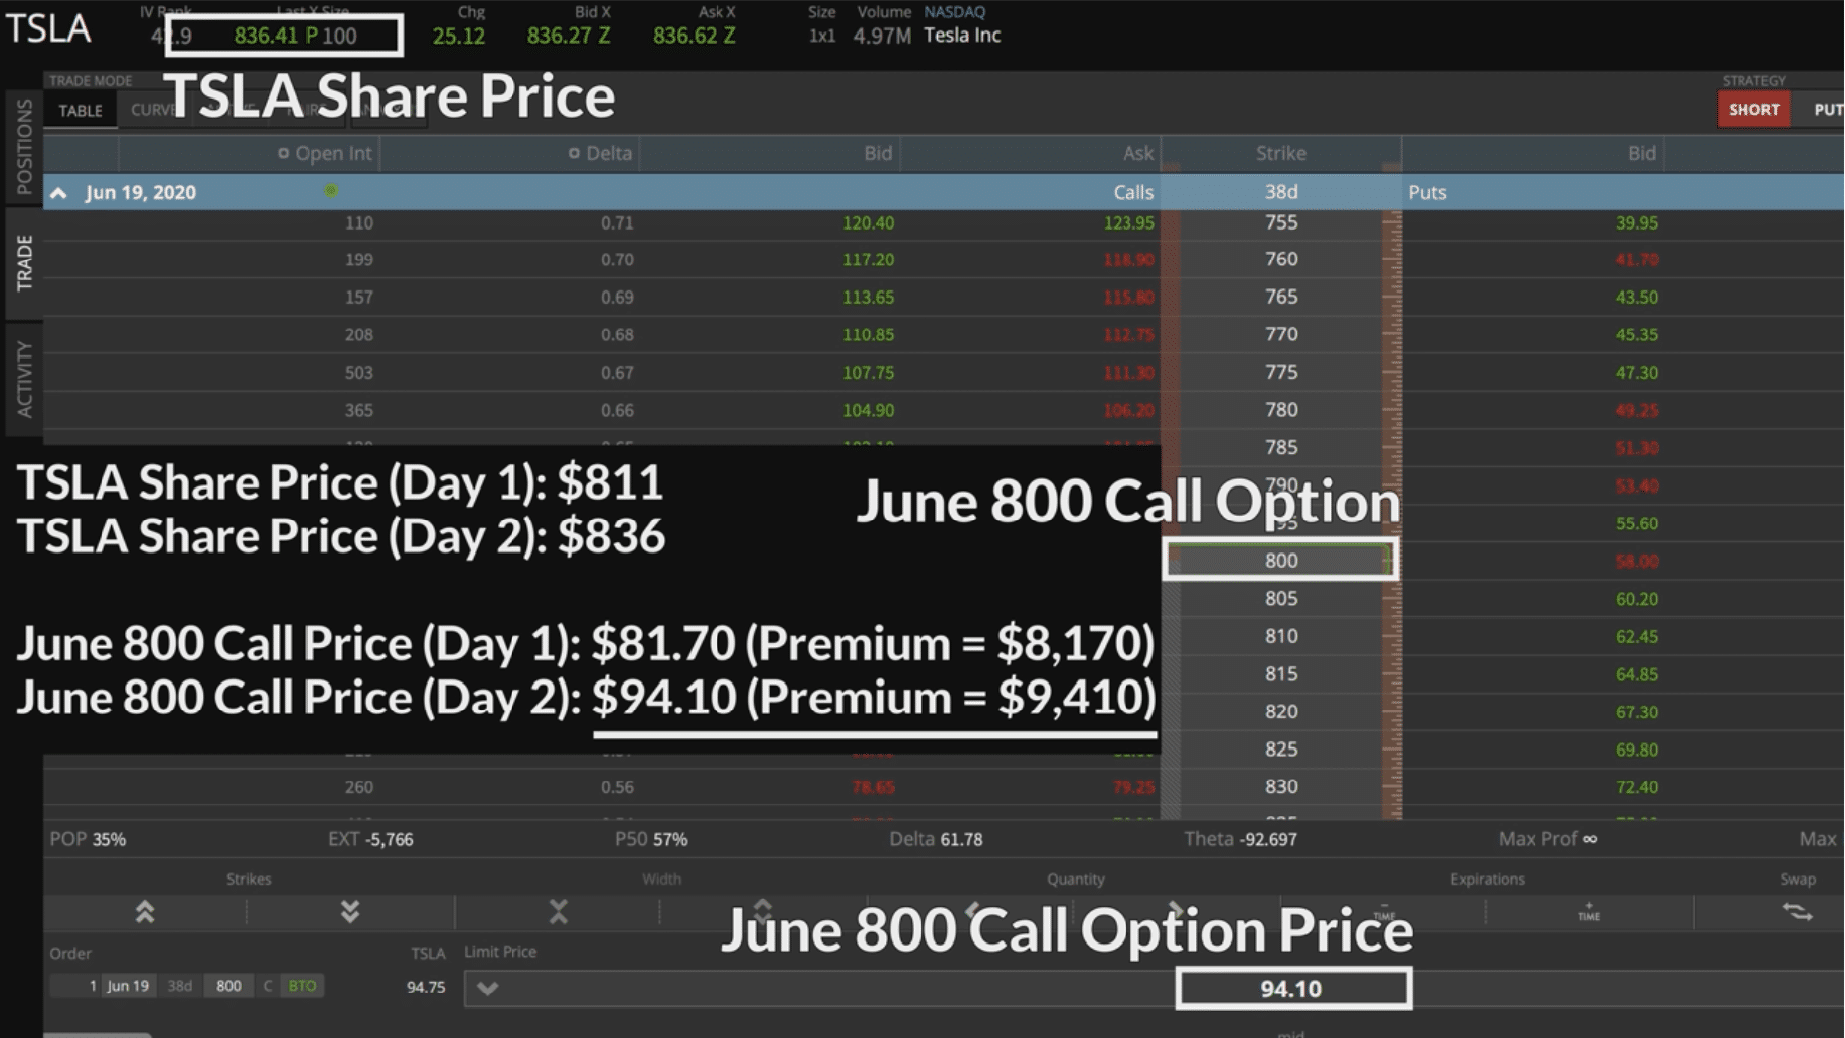
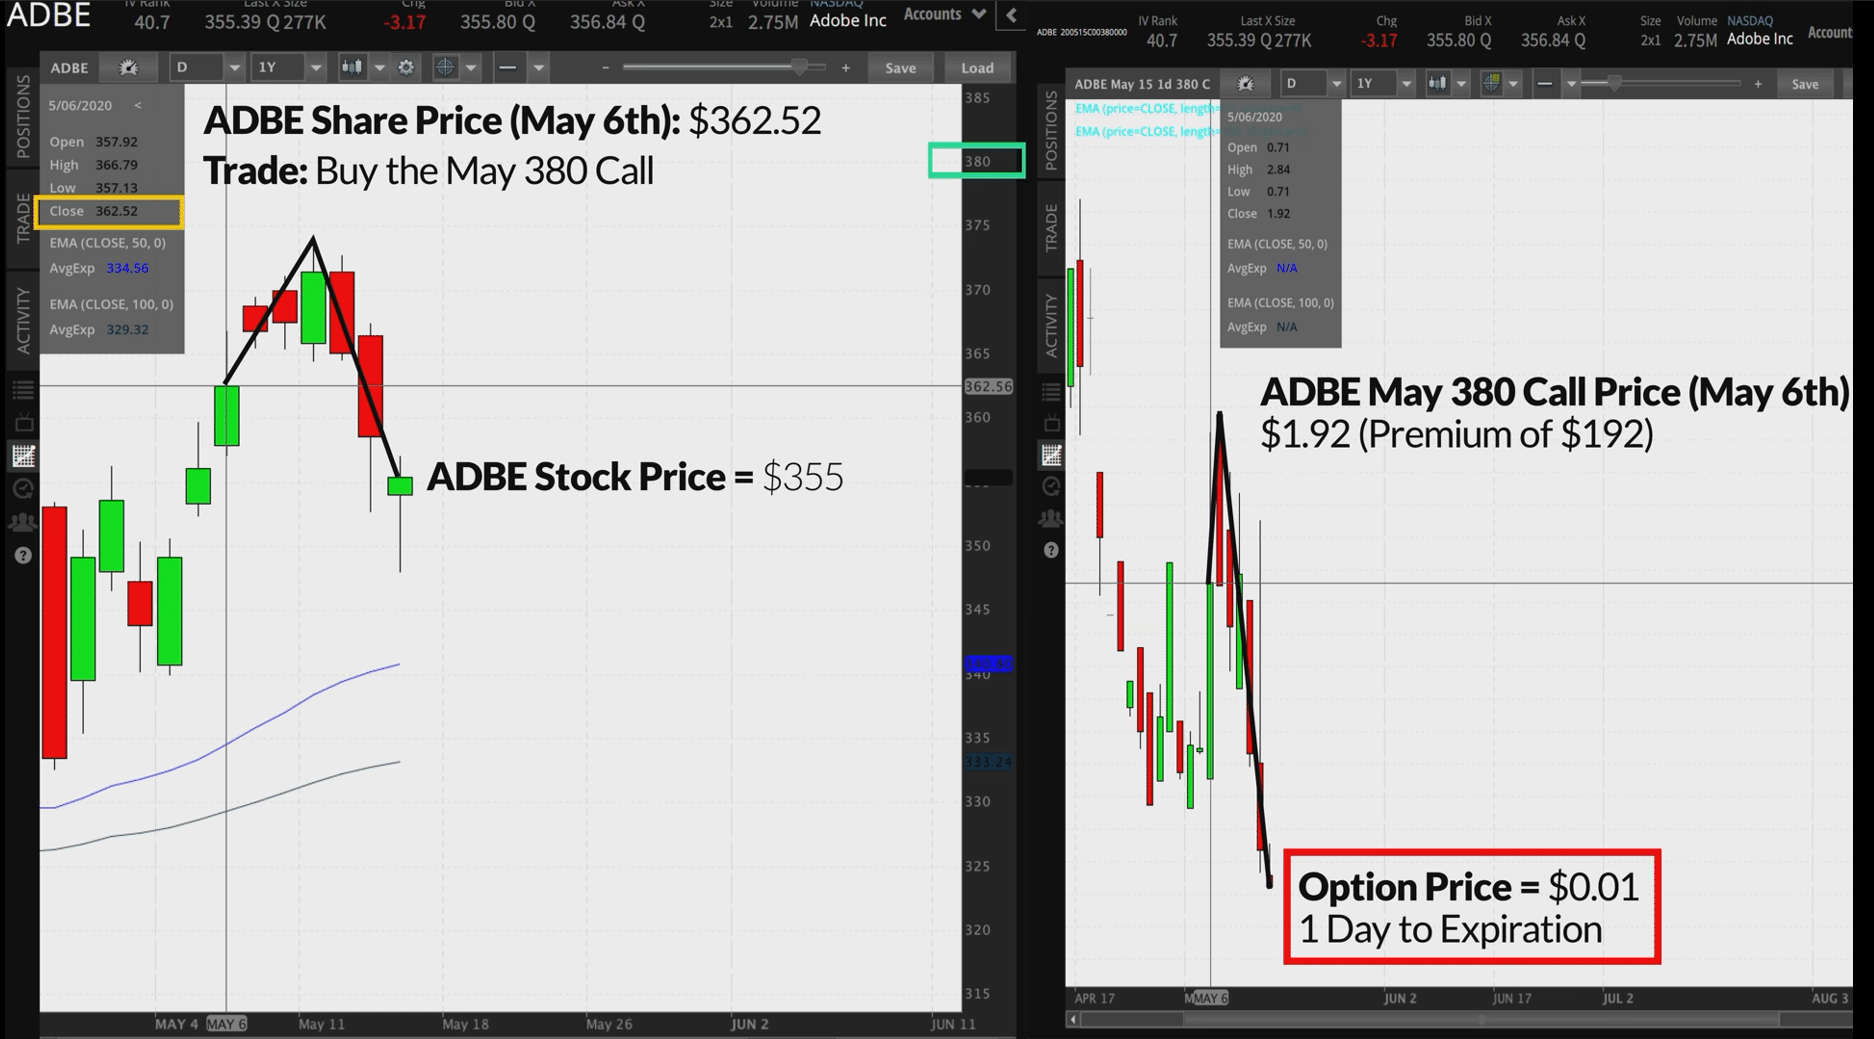
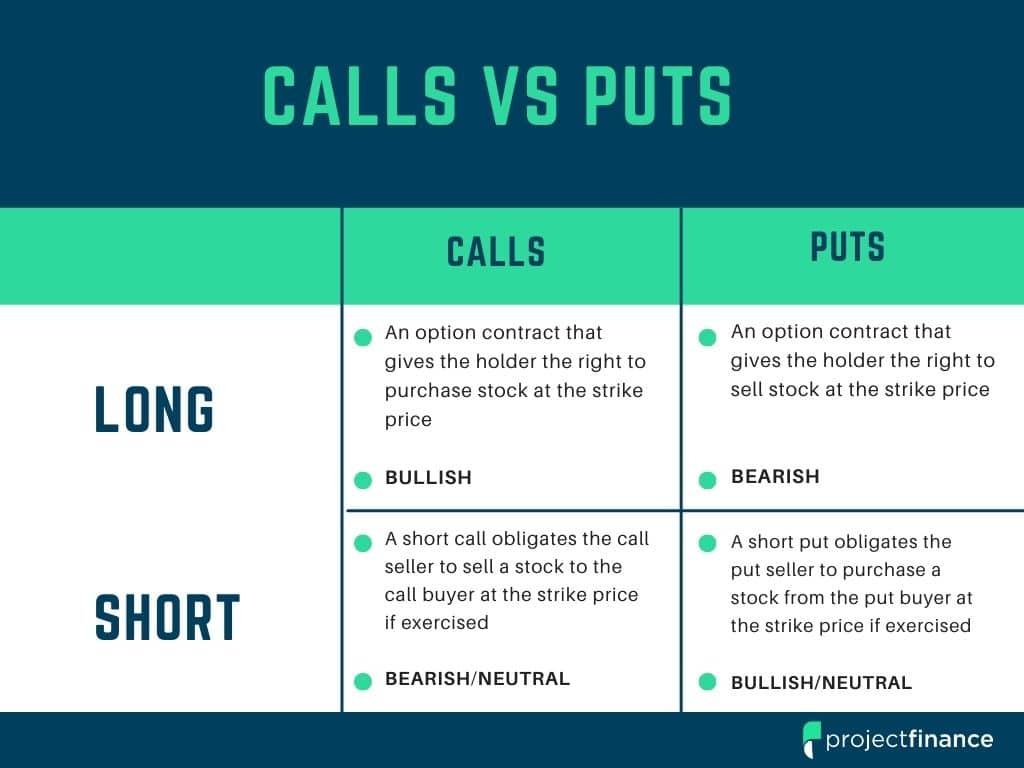
Calls vs Puts in Options Trading Explained: The Ultimate Guide

Call Option Definition: A call option is a contract between a buyer and seller that gives the buyer the right to purchase 100 shares of the underlying security at the specified strike price. 

Put Option Definition: A put option is a contract between a buyer and seller that gives the buyer the right to sell 100 shares of the underlying security at the specified strike price. 

Call Option vs Put Option: Put options are bearish market bets while call options are bullish market bets. 

The first step in any beginner options trader education is understanding the fundamental difference between calls and puts.

In the stock market, there are only two types of options in existence: calls and puts. You can combine these options in numerous ways, creating strategies like the “vertical spread”, “iron condor” and “butterfly”.

Just like stocks, you can both buy and sell options. This article, however, is going to focus mostly on the differences (and similarities) between the basic long call and put options strategy. 

Should you want to continue your education, we have provided a few links to more advanced options trading lessons at the end of this article. 

If you are brand new to options, perhaps a better starting place would be comparing stock to options.

     TAKEAWAYS

  • Calls increase in value when the underlying stock rises and are thus bullish

  • Puts increase in value when the underlying stock declines and are thus bearish

  • Both calls and puts decrease in value when the underlying stock stays the same

  • Calls and puts both represent 100 shares of the underlying asset (stock); calls convert to long stock and puts convert to short stock

  • Maximum profit in calls is infinite; maximum profit in puts is defined

  • Calls are in-the-money when the strike price is below the stock price

  • Puts are in-the-money when the strike price is above the stock price

Calls vs Puts: Similarities

Before we understand how calls and puts differ, it will help to first understand how these two option types are alike.

Why? All options include standardized terms. Understanding the mechanics of these terms will make the differentiating of calls and puts much easier.

Before we look at 6 ways calls and puts differ, let’s first learn 6 ways they are alike!

1. Both Calls and Puts Are Derivatives

Derivatives are NOT stocks. With stocks, you have certain rights, such as the right to vote and receive dividends. Options have no such rights.

2. (Long) Calls and Puts Have the Right to Be Exercised

For American-style options, the owners of both long calls and long puts have the right to exercise their options contract at any time. All stock options are American-style. 

  • When a long American style call option is exercised, 100 shares of stock are purchased at the contract’s “strike price.”
  • When a long American-style put option is exercised, 100 shares of stock are sold at the “strike price.”

European-style options, on the other hand, can only be exercised at option expiration. These options include index options. The underlying product of index options does not offer shares. These types of products offer advantages to traders that sell call and put options as early exercise is not possible. 

3. Short Calls and Puts Have Assignment Risk

Because long American-style options can be exercised at any time, traders’ short call and put options can, in theory, be “assigned” at any time. Understanding the assignment process is important for short options traders. However, this usually only happens when an option is in-the-money and “extrinsic” value is very low.

  • When a short American-style call option is assigned, 100 shares of stock are sold at the “strike price.”
  • When a short American-style put option is assigned, 100 shares of stock are purchased at the “strike price.”

4.) Calls and Puts Both have “Time Decay” Risk

All options have a time frame. In an environment where the stock price and implied volatility remain constant, both call and put options will shed value as their expiration date approaches. This is known as the options Greektheta

Theta is bad for option buyers as this causes calls and puts to shed value. Short call and put options, however,  profit from theta as time decay eats away at the premium sold.

5.) Calls and Puts Both Represent (Usually) 100 Shares of Stock

Both call and put options (almost) always represent 100 shares of the underlying stock. This creates a multiplier effect of 100:1. This great leverage is the reason for the great risk and reward potential that options are known for.

6.) Calls and Puts Both Rise in Value With Volatility

In the options market, the market price of calls and puts increase with rising implied volatility. The Greek “vega” tells us how sensitive an option is to changes in implied volatility.

Volatility is a positive for long options because it causes the value of both calls and puts to increase. This is negative for short options for the same reason.

So now that we understand how these types of options are alike, let’s see how they differ next!

1.) Calls vs Puts: Market Direction

In terms of market direction, calls and puts have completely different profiles. 

  • Long call options are bullish on the underlying security.
  • Long put options are bearish on the underlying security

Long Calls and Market Direction

Long Call

The above graph represents the profit/loss profile of a long call at expiration, where X represents the strike price of the call bought.

By studying the above chart of a long call at the option’s expiration, we can see that this options strategy becomes profitable as the underlying share price increases. 

However, the underlying must rise in value fast and momentous in order for a call buyer to become profitable.

The further out-of-the-money a call option is, the greater the stock will need to rise in price to achieve profitability. In options trading, moneyness refers to the price of a stock in relation to an options strike price.

We aren’t going to focus too much on short options in this article, but if you’d like to get an idea of their payout profiles, just switch the green and red lines around in our respective call (and put) chart.

Long Puts and Market Direction

Long Put Chart

The above graph represents the profit/loss profile of a long put at expiration, where X represents the strike price of the put bought.

In order to understand put options, just take everything we learned about calls and flip it around. Puts increase in value as the underlying stock/security falls in value. 

For a put option to be profitable, the stock must fall hard and fast. Just because a stock is down on a day doesn’t necessarily mean a put option will increase in value. 

Like calls, the moneyness of a put option will determine how it reacts to changes in the underlying price.  

2.) Calls vs Puts: Share Representation

As we learned from the “similarities” of calls and puts earlier, both types of options give the owner the right to “exercise” their option. This exercisement results in 100 shares of stock.

However, the type of stock that these options settles to is completely different!

  • A long call option settles to 100 shares of long stock when exercised.
  • A long put option settles to 100 short shares of stock when exercised.

So at what price is this stock bought or sold? The strike price of the option.

Long American style options can be exercised at any time. 

However, this exercise/assign process rarely happens.

Why?

When you exercise an option early, you forgo that option’s “extrinsic” value. Both call and put options are composed completely of extrinsic and/or intrinsic value.

Extrinsic and Intrinsic Value

extrinsic intrinsic value
  • Intrinsic value represents how deep in-the-money an option is, or simply how much value the option has on its own.
  • Extrinsic value is made up of time and implied volatility. This value accounts for what could happen to our option in the future. Time is money!

Almost all in-the-money options have both extrinsic and intrinsic value. Out-of-the-money options are all extrinsic value.

Since extrinsic value is lost when an option is exercised, both in and out of the money options are rarely exercised.

Think of it this way – if a stock is trading at $148 and you are long the 150 call, why exercise your right to buy the stock at $150 when you can buy it in the market for $148, two dollars cheaper? You wouldn’t! You would just sell that option in the market. Options don’t have to be exercised to be profitable.

3.) Calls vs Puts: Maximum Profit

Calls become profitable as the underlying security rises in value; puts become profitable as the underlying security falls in value. 

The maximum profit scenario, however, is much greater in calls than that of puts. Let’s see why next. 

Maximum Profit in Call Options

The maximum profit on a long call is infinite.

Why?

A call option is a derivative financial instrument. The price of a call option is derived from that of a stock

A stock can (in theory) go as high as infinity. There is no ballast holding it down – it can fly to the moon.

NOTE! Our Maximum loss and profits are referring to only long options. Short options have MUCH MORE risk. 

Maximum Profit in Put Options

We mentioned above that since a stock can go to infinity, the value of a call option on that stock can as well.

But what about put options? 

Unlike calls, puts profit when a stock goes down in value. So how low can a stock go? Zero.

A stock can never go below zero, therefore, the maximum profit on a long put option is tethered to zero.

4.) Calls vs Puts: Maximum Loss

Whenever you purchase an options contract (call or put), the most you can ever lose is the option premium paid. You can compare this to stock – if you buy Apple (AAPL) at $150/share, the most you will ever lose is $150/ share.

If you purchase a call option for $2, the most you will ever lose is this $2. However, because of the “multiplier effect” of 100 we discussed earlier, the quoted price of an options contract does not represent the total dollar risk. An options contract quoted at $2 will cost us $200 – out total at-risk money. 

For both call and put options, the maximum loss (or risk) is always the debit, or “premium”, paid.

5.) Calls vs Puts: Moneyness

option moneyness chart calls and puts

All options contracts exists in one of three moneyness states:

  • In-The-Money
  • At-The-Money
  • Out-Of-The-Money

Call options are in-the-money when the strike price is below the stock price. Call options are out-of-the-money when the strike price is above the stock price. 

Put options are in-the-money when the strike price is above the stock price. Put options are out-of-the-money when the strike price is below the stock price.

Options almost always exist in one of these two moneyness states. However, when an options strike price is trading near the stock price, traders refer to these options as being at-the-money.

6.) Calls vs Puts: Dividends

Buying stock comes with benefits, such as receiving dividends. 

We mentioned at the beginning of this article that neither calls nor puts receive dividends.

Call options do, however, react to dividends!

Why? Call Options give the owner the right to convert their contract into long stock. If the amount of a dividend gained is greater than the extrinsic value lost by early exercising, it makes sense for a long call position to be exercised.

Put options are converted to short stock. Since short stock does not receive dividends, it would not make sense to exercise a put during a dividend event.

Final Word

Comparing calls to puts is like comparing apples to oranges. Though they are both standardized in the same fashion, they react completely differently to rises and falls in a stocks value. 

However, in some regards, they are indeed similar. If a stock doesn’t go anywhere, both calls and put will decrease in value. If the implied volatility of a stock increases, on the other hand, they will both rise in value together. 

Calls vs Puts: FAQs

The main risk of call options is time decay. When stock price and volatility remain the same, options shed value. This is because of the Greek “theta”. Call sellers, however, profit from theta. 

Calls and puts are opposite types of securities. Puts would be better to buy if you believe a stock is going to fall in value while calls would be beneficial if you believe a security is going to rise in value. However, for both calls and put to be profitable, the price of the stock must either fall (puts) or rise (calls) by a large amount. 

Selling put options are better suited when you are neutral or slightly bullish on a security. Call options are best for very bullish markets.

If you buy a call option and the price of the underlying asset does not rise significantly, you will not make money. Selling a put in this situation would make money. However, selling puts has far greater risk than buying calls. 

Next Lesson

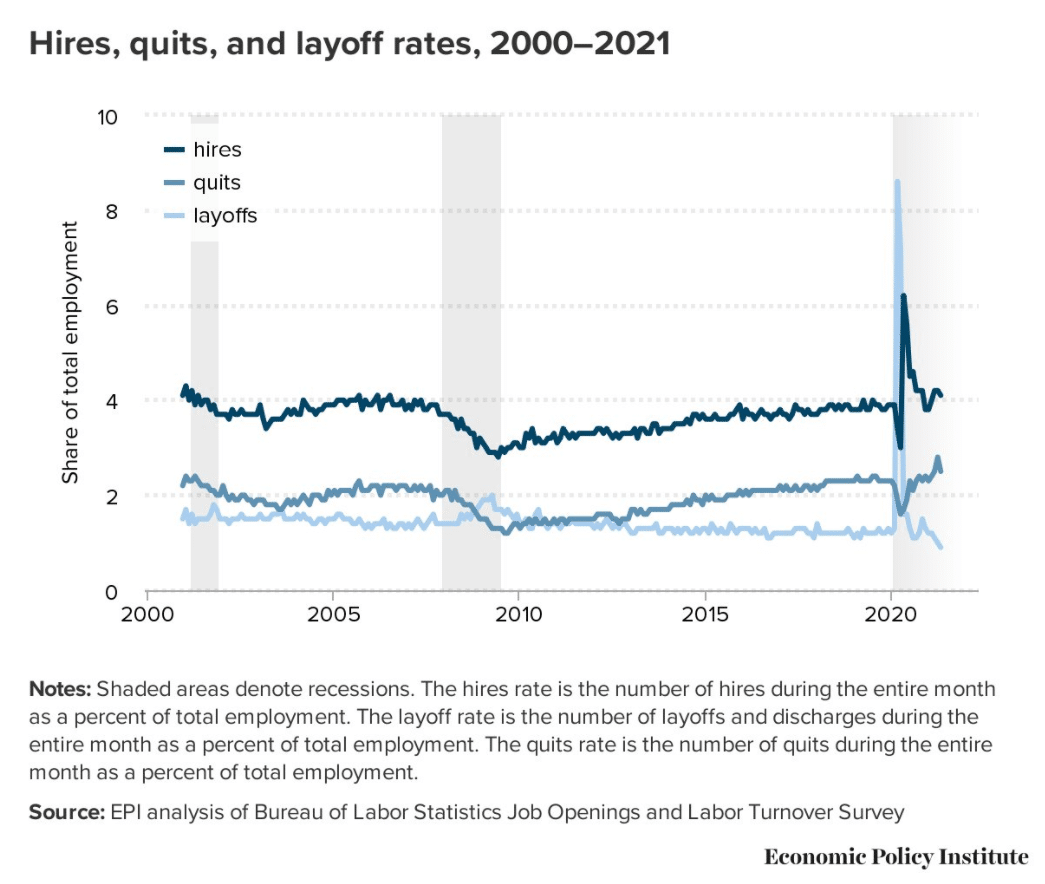
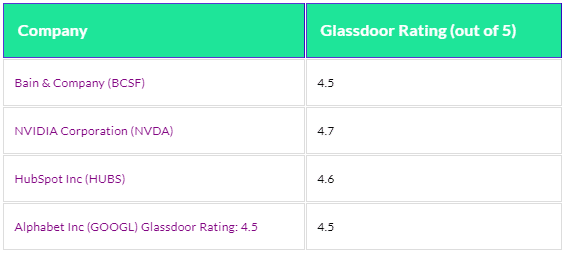
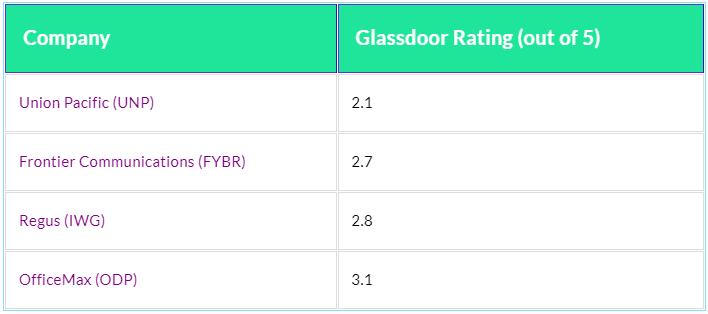
The Great Resignation, Entrepreneurship and Stocks

The pandemic has changed the way American’s view the workplace, and mostly for the worse. A mass exodus of employees known as “the Great Resignation” is putting many employers on edge. Understanding this shift in talent is vital for investors: a company is only as successful as the employees that constitute it. 

In this article, projectfinance will take a closer look at the reasons for these departures, as well as the rise of entrepreneurship. Additionally, we will examine a few companies/industries which may benefit/lose from this unparalleled shift of labor.

 Highlights

  • 95% of employees are considering changing their jobs.
  • Many of those quitting their jobs are becoming entrepreneurs.
  • The Great Resignation may provide investors with numerous opportunities. 

Employees Aren’t Happy

Monster.com recently released shocking results from a poll they took. The results are almost impossible for investors to ignore and present a nightmare scenario for HR professionals:

  • 95% of employees are currently considering changing jobs
  • 92% of employees plan to change industries
  • 63% of employees have been searching for a new job for the past 1-3 months

This search has been fueled by a historically unparalleled job-seekers market.

Why the Unhappiness?

According to Monster, burnout and a lack of growth opportunities accounted for 61% of the discontent. 

Adding to this stress, many more employees are being forced to return to the workplace. 

Teleworking has fallen quite dramatically from its height of 35.5% in May 2020 to its current level of 14.4% (July 2021).

But this alone can’t possibly make up for such discontent in the labor force.

When I think about the mass exodus of American workers I first begin to wonder why. How is it possible so many Americans are throwing away lucrative careers?

The American Way Redux

The security and stability a job offers can make it difficult to walk away from. It gets in our blood and changes who we are. This dependency runs parallel to the pillars of American thought, as written about beautifully in Ralph Waldo Emerson’s “Self-Reliance”.

I began my career 15 years ago at a small company where quite literally every employee loved their job. That little company has since been bought three times, and on my last day, I didn’t know a single employee who was happy. 

If I could change the words of Tolstoy a little bit, I could say, “All happy companies are all alike; every unhappy company is unhappy in its own way.”

Perhaps we, as a nation, were not able to see our unhappiness until we were able to step back.

The 800-Pound Gorilla From a Distance

In this great step back, Americans have gained perspective. Americans look back at their old workstation, train, and managers through a telescopic lens. Through that lens some are seeing Goliath, or that “800-pound gorilla”, flapping its arms in a desperate, ostensibly caring gesture (insurance reasons), to get us back. 

Many Americans are saying, “No thanks, Mr. Gorilla.” 

In April, a record 4-million employees shook their heads together. Take a look at the center line on the below chart from the Economic Policy Institute.

So where are all of the people that constitute this sharp rise going? What are their plans?

Entrepreneurship on the Rise

A lot of people are following in the footsteps of their parents and grandparents by starting their own businesses. According to NPR:

It will be a long and arduous journey for these ambitious souls. Barriers to entry are high in many sectors. Sheer luck will play a large contribution to their success. The Chamber of Commerce shows us just how hard:

  • 80% of small businesses survive their first year 
  • 70% of businesses survive only 2 years
  • 50% of businesses make it to the five-year mark

There will be the inevitable “return to thy master”, with millions of employees returning to their old employers with their tails between their legs. 

But a few will indeed make it, and they will require more employees, and soon they will capture the gorilla’s attention.

American isn’t the only country whose citizens are rolling up their sleeves and going their own way; Forbes reported that the number of individuals filing to start their own company has been skyrocketing around the globe.

Great Resignation Winners

If the Great Resignation stays the course, it will have a material impact on stocks and industries. Here are a few ideas as to which industries and companies may benefit from the great shift in labor.

Nasdaq Growth

Thomas Edison once said that “Discontent is the first necessity of progress.”

The most discontent of workers in today’s labor market is relatively young, most of whom are in their early and mid-career. They have a lot of time in front of them. So what is it young people know?

Technology. An extraordinarily successful company I used to work for had a tech department that was run almost exclusively by ex-Starbuck employees. I can’t help but wonder where all these kids quitting their dead-end retail jobs will take our economy in ten years. 

In addition to retail workers leaving their jobs, “high-tech” employees were also at the top of the resignation list. High-tech typically employs some of the brightest minds in the country. What will they create when given complete liberty?

An exchange-traded fund well suited for up-and-coming tech companies is Invesco’s NASDAQ Next Gen 100 ETF (QJJJ).

Small-Caps

But the tech industry will not alone benefit from the Great Resignation. A predicted low-interest-rate environment for the foreseeable future should help to be a catalyst to the success of all new businesses. With talent shifting from large-caps to smaller capitalized companies, indexes such as the Russell 2000 can’t be ignored. 

Though small-caps are currently priced at very high levels, getting some exposure in the next dip could prove lucrative.

A broad-based ETF, such as Vanguard’s Small-Cap ETF (VB) could pay off well in the future.

Artificial Intelligence

Remember when artificial intelligence (A.I.) used to be the predominant fear of the US workforce? Well, post-pandemic, it’s still there. 

Back in 2018, Elon Musk actually said of A.I., “Mark my words — A.I. is far more dangerous than nukes.”

The Great Resignation will only precipitate the evolution of A.I. in the workplace. Companies are beginning to recognize that they no longer require “someone” to fill a role, but “something”.

Exchange-traded funds like The ROBO Global Robotics & Automation ETF (ROBO) are positioning themselves to capitalize on this shift to robotics and automation-enabled products.

Top Reviewed Companies

Not all employees looking for new careers are hoping to start a new business. Many simply want to be treated better. 

So what companies treat their employees the best? According to Glassdoor, a few of the best publicly-traded companies to work for, as rated by present and past employees are:

responsive winners

Great Resignation Losers

Just as the Great Resignation will have its winners, there will be losers as well. 

Retail

No industry is losing more employees in the Great Resignation faster than the retail industry. 

According to Kate Morgan at the  BBC

Why? Many retail and service workers (deemed “essential” during the pandemic) feel themselves to be overworked and underappreciated. As a result, many of these employees are beginning to think long-term. They are willing to make short-term monetary sacrifices to obtain upward mobility.

Opportunities in Retail

With that being said, there are some retail companies that are very well-positioned.

Amazon (AMZN), Wal-Mart (WMT), and Costco (COST)  all have very promising futures. The pandemic’s long-term impact on these companies can’t be ignored, and they should weather the storm just fine.

Healthcare

Perhaps the most critical sector in the country, healthcare, has been losing a lot of talent. From March 2020 to March 2021, Forbes reported that this industry had an increase in resignations of 3.61%. For the future of this country’s health, that number is very scary.

Worst Reviewed Companies

Nearly all job candidates will check their potential future employers out on review sites like Glassdoor.

Not all reviews are positive. The Great Resignation shows us that salary is not everything anymore; people care how they are treated

Here are a few companies that could be hemorrhaging talent due to their low ratings.

Final Word

As of right now, many believe the Great Resignation will not have a material impact on the economy. Just like inflation, many experts are calling the phase “temporary”. 

However, you will never regret being prepared for the day if/when they are proved wrong.

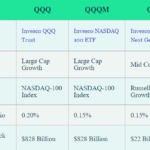
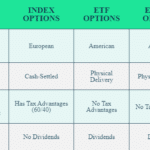
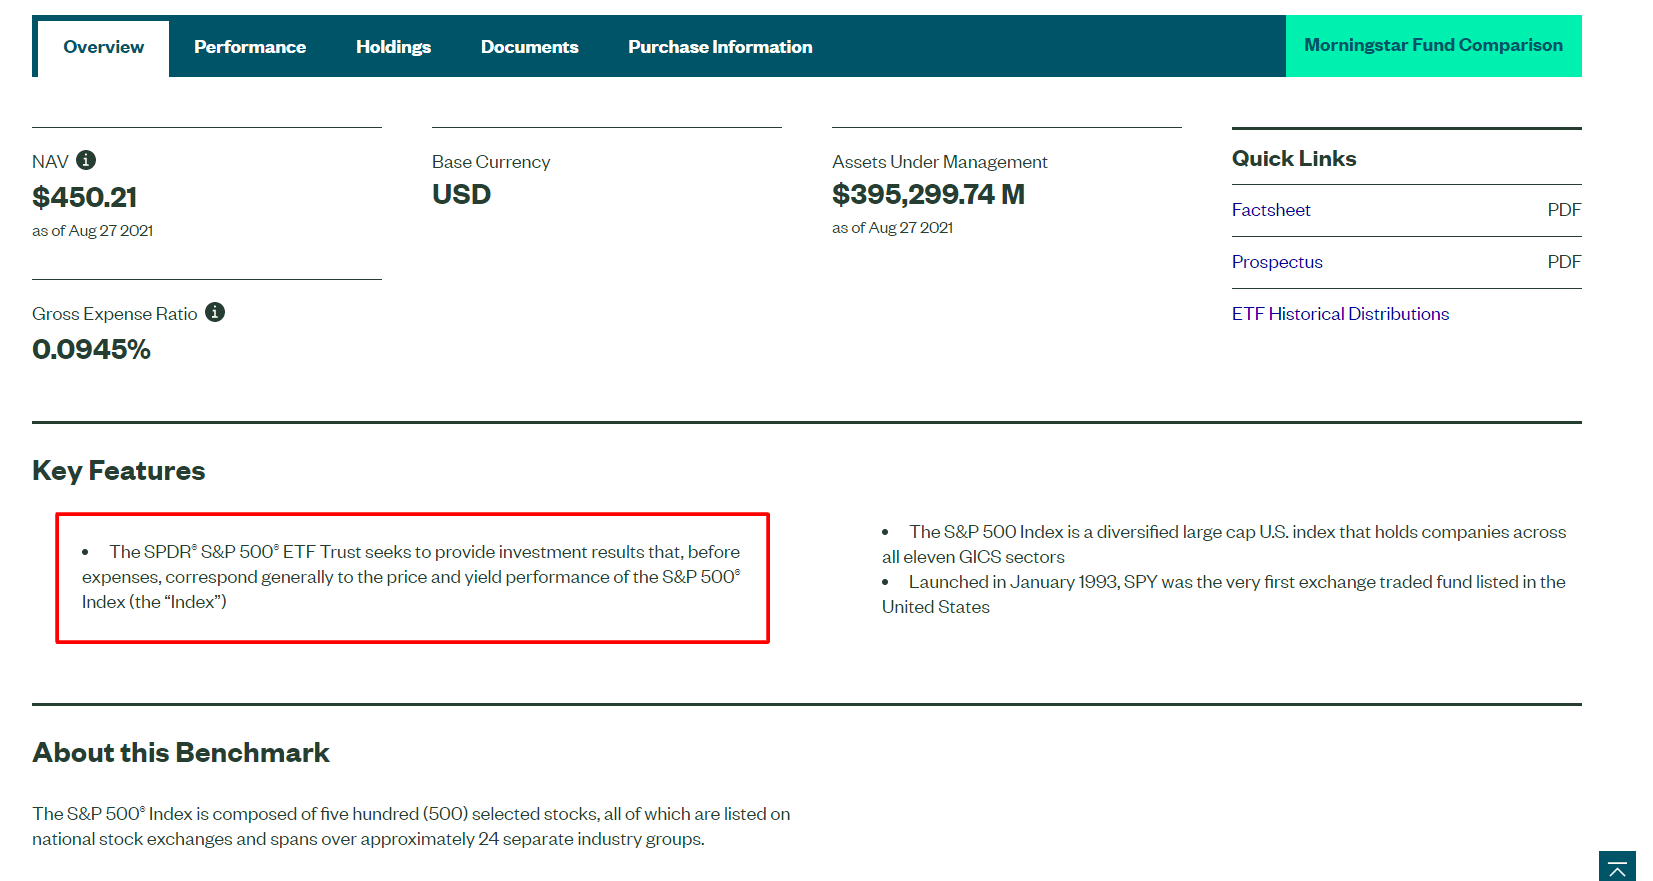
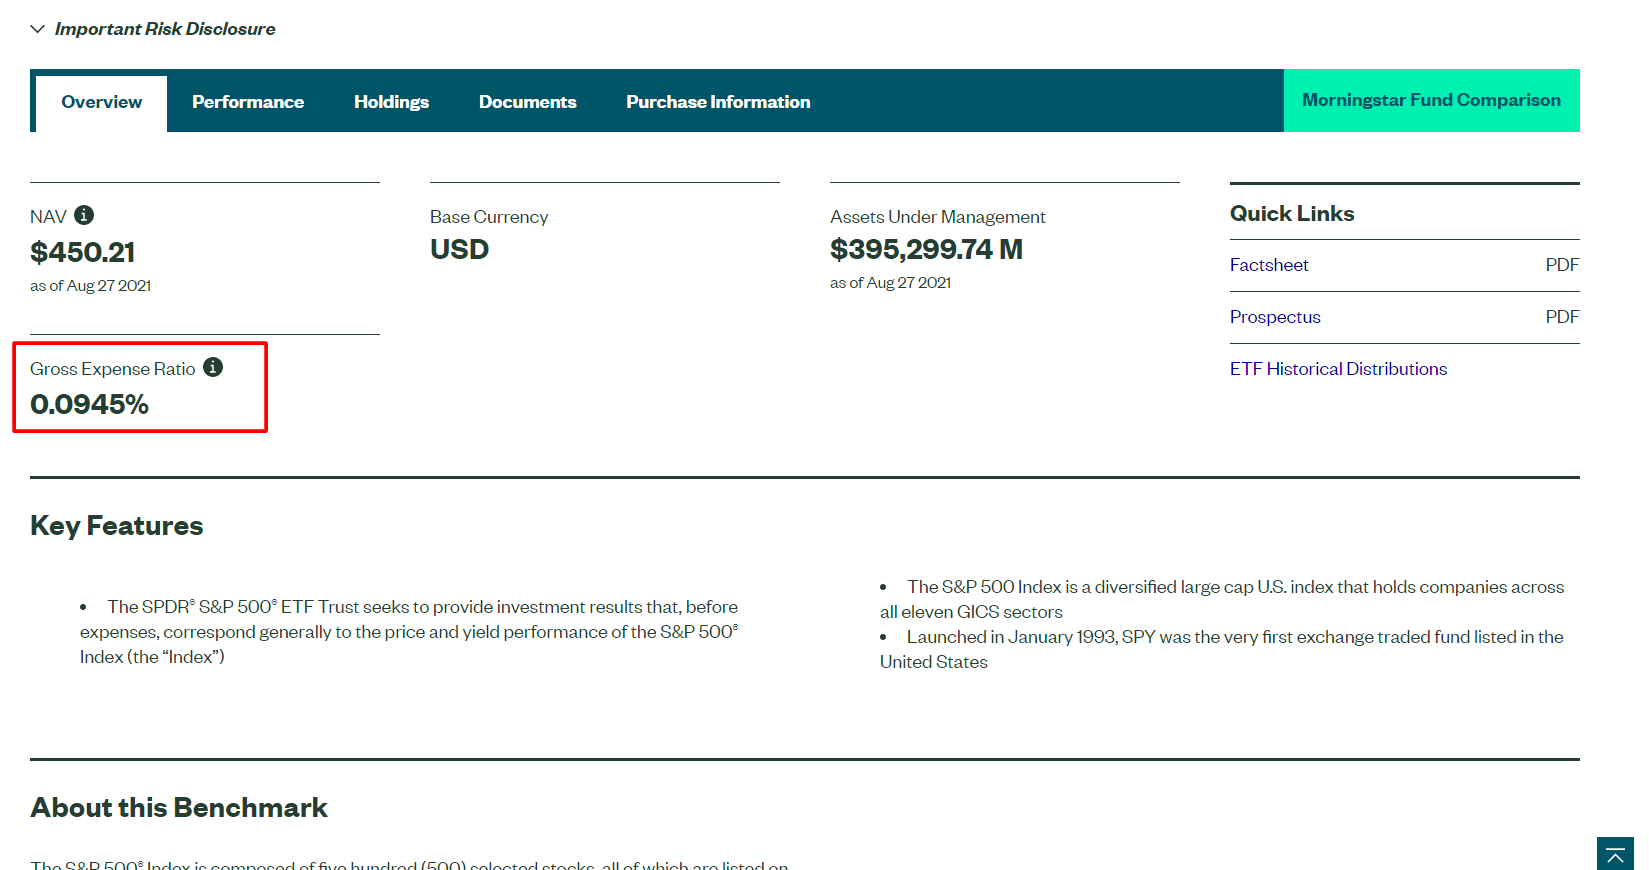
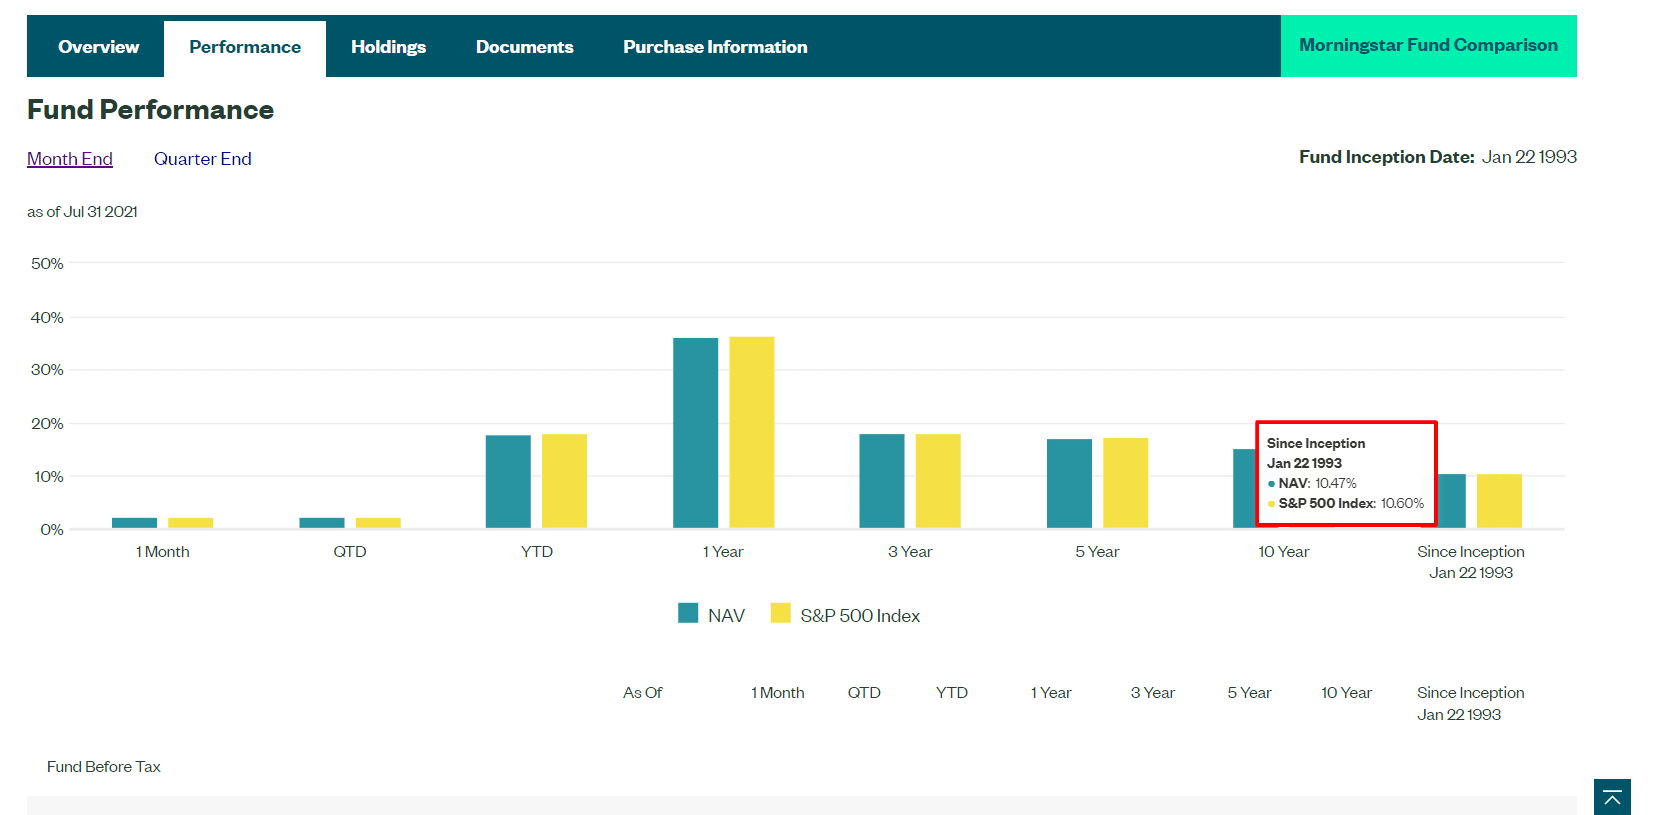
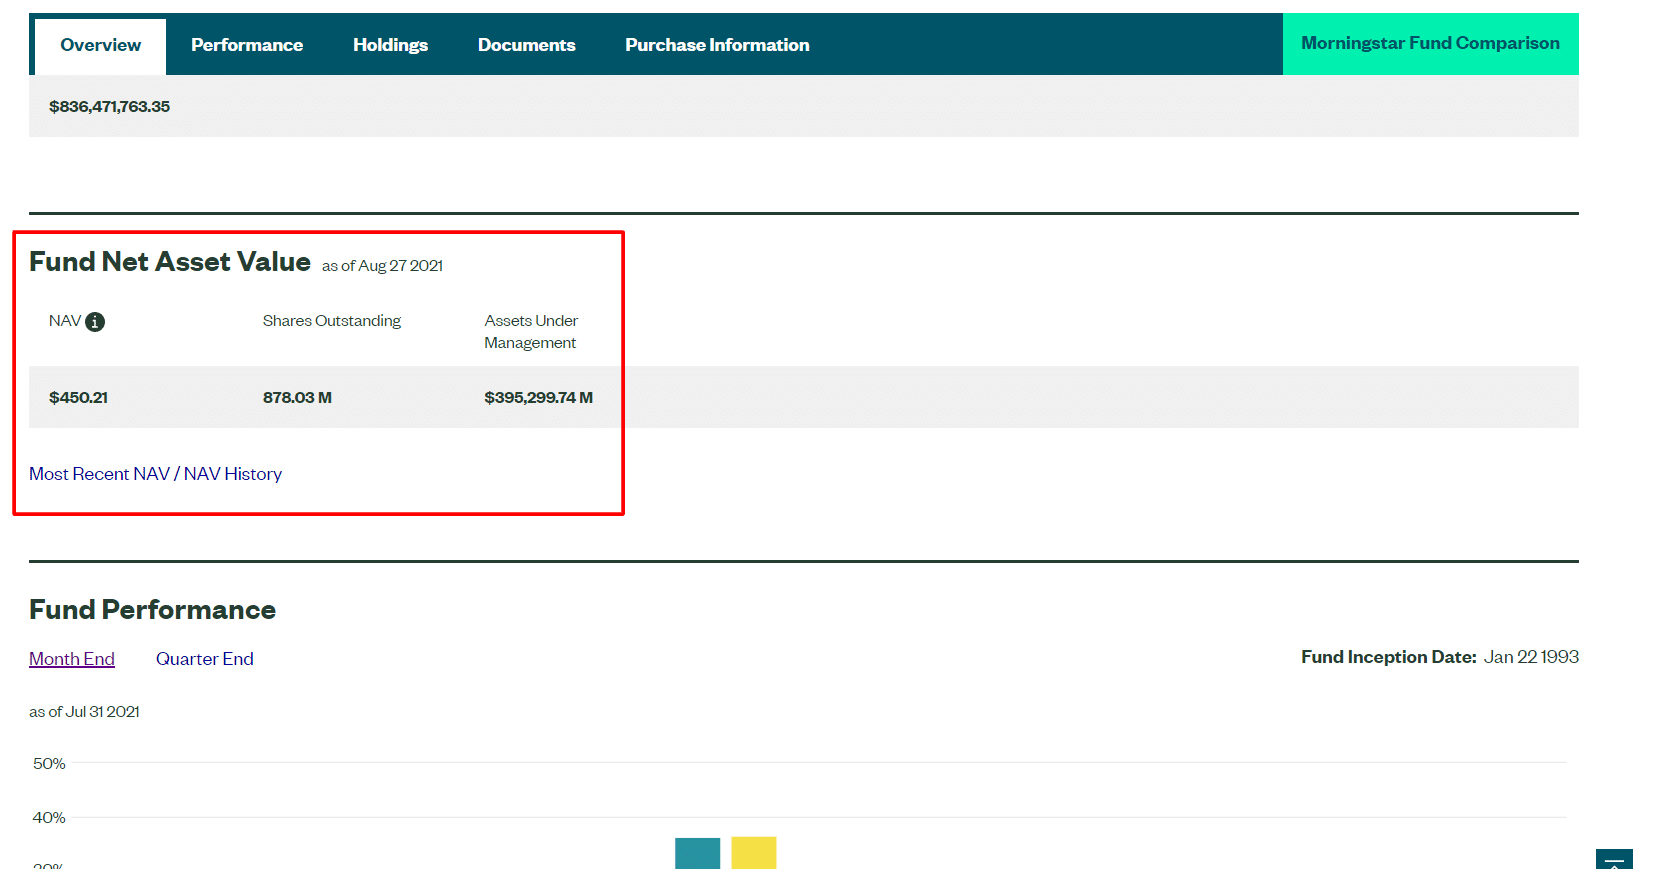
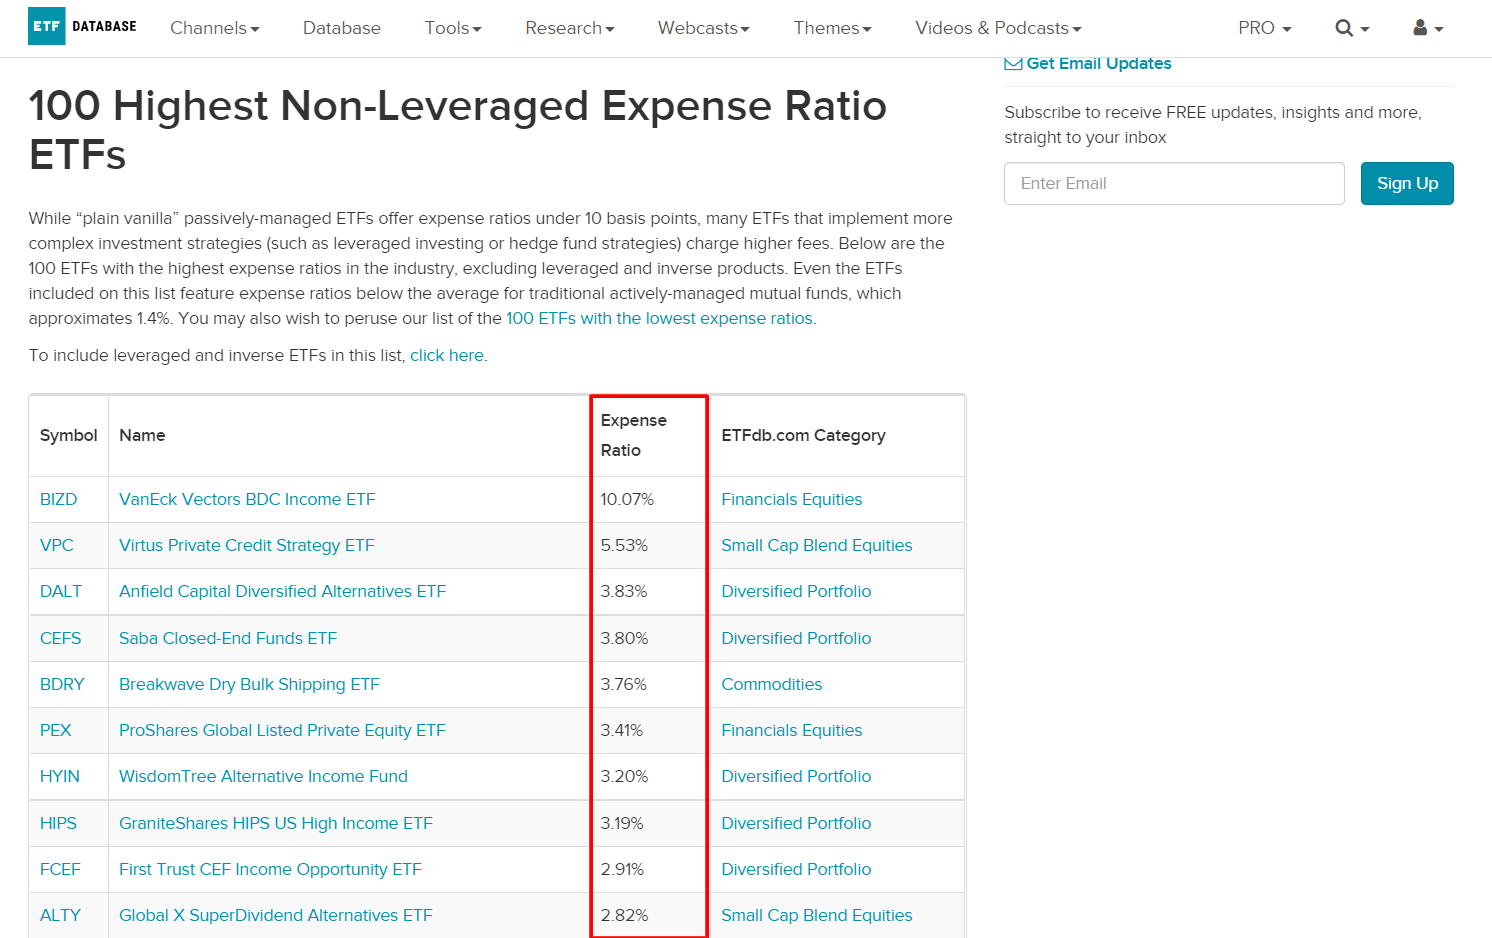
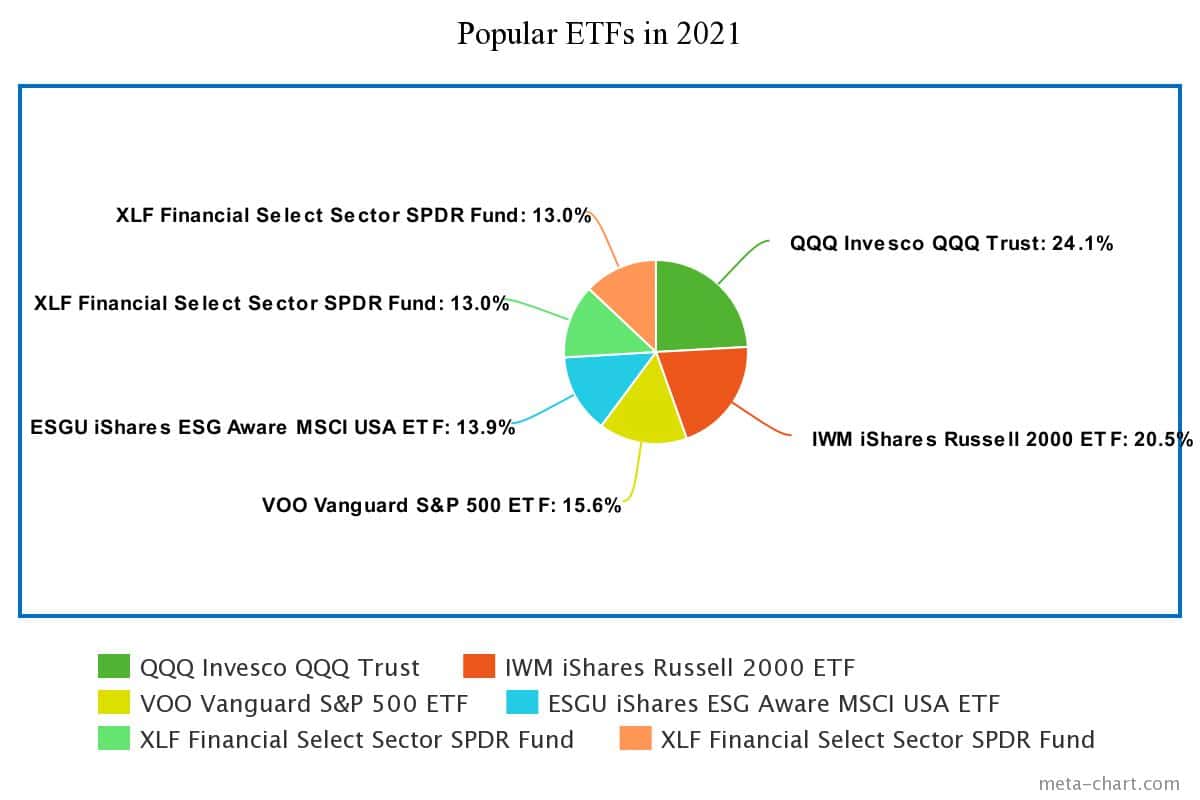
ETFs Explained: Investing Basics

The popularity of exchange-traded funds (ETFs) has been skyrocketing in recent years. In 2003, there were only about 100 ETFs. Today, there are over 2,000.

Although mutual funds still contain a greater amount of assets when compared to ETFs (your 401k is probably all in mutual funds), ETFs are rapidly catching up. 

In this article, projectfinance is going to explain why investors are flocking to ETFs and leaving traditional mutual funds in the dust. We will cover topics such as how ETFs are formed, what to look at specifically before purchasing an ETF (fund objective and fees), how an ETF maintains price stability, and why ETFs are superior to mutual funds. 

First off, we are going to learn what exactly an ETF is. Although you probably know the broad strokes of how ETFs work, let’s paint the whole picture of an ETF with the painting analogy.

   Highlights

  • Exchange-traded funds (ETFs) pool together investors money to invest in baskets of securities.
  • Unlike mutual funds, ETFs are traded on exchanges, allowing for greater liquidity.
  • An ETFs prospective informs investors about important information such as the fund objective, expense ratio, relative price performance, and net asset value. 
  • “Authorized Participants” help to keep the fund’s NAV in line with the price of the underlying securities that compose it.
  • Mutual funds have minimum investments; ETFs don’t. Mutual funds are illiquid; ETFs are generally very liquid; mutual funds often have two fees; ETFs have one.

What is an ETF?

ETF is an acronym for “exchange-traded fund”. An ETF falls under the ETP (exchange-traded product) umbrella .

Here is the textbook definition of an ETF.

Exchange-Traded Fund (ETF) Definition:  An exchange-traded security that tracks one (or more) asset types, including indexes, sector’s and commodities.

Pretty simple, right? ETFs represent a bundle of securities that typically trade within an asset class on an exchange.

If you’re fortunate enough to have a 401k plan, you are probably familiar with mutual funds. If you were to look up the definition of a mutual fund, you would find a very similar definition with one very important exception: mutual funds are NOT traded on exchanges in the open market. 

Having the ability to trade your security on exchanges is a huge bonus to investors. Just like shares of stock (AAPL or AMZN), you can purchase and sell ETFs in real-time and get filled at prices that you determine. Mutual funds? Not so much. 

In order to understand the mechanics of ETFs, let’s start off with an analogy comparing an ETF to an investment in the art world.

Simple ETF Example: Painting Analogy

Painting

Since I’m writing this article in Figueres, Spain, I thought the art of Salvador Dali would be appropriate. 

Let’s say that you were part of that small crowd that adores Dali. The above work (we’ll call it a painting) goes up for auction and sells for the insanely high price of 100 million dollars. You were at the auction, but you had only $500 to invest. Wouldn’t it be great if you could buy a piece of the painting (perhaps a tiny blotch of paint) for only $500? 

That way, if, in 10 years, the painting were to double in value, you will make a profit of $500. 

This “pooling” of funds is essentially what an ETF is. By combining your money with others, you can create enough wealth to buy complete artworks (or asset categories). So how would it work here?

“Creating” an ETF Fund

The creator (or seller) of the painting would create a “fund” and hold said painting in this fund. Next, the creator will issue 20 million shares to make up the whole 100 million dollar value of the fund. 

Since the fund’s assets are worth 100 million, and the creator issued 20 million shares, then each share must be worth (100/20) $5/share. 

This setup allows us to buy a share of this fund for only $5. We can then partake in the increase and decrease of the painting’s value over time.

But where do we do the buying and selling of our shares? 

How about if we had a central location with brokers and traders that could help facilitate these transactions?

“Listing” an ETF Fund

Lastly, the fund’s creator would publicly list these $5 shares on a stock exchange. 

After this step is complete, investors from around the world can buy shares of this fund, therefore giving everyone exposure to our 100 million dollar painting. 

Since we wanted to invest $500 in the painting, how many shares were we able to buy?

Simply dividing our total investment ($500) by the per-share price ($5) gives us exactly 100 shares of the painting. 

Now let’s say five years pass and that painting is now worth $200 million dollars. How much will our initial investment of $500 be worth?

Bingo. $1,000. We can then sell our shares back in the open market to lock in our profit. 

An ETF operates just like this painting example; it is a method of dividing a portfolio of assets into numerous shares. By doing so, we allow investors of all different sizes to participate in the ownership of the fund’s assets. 

Again, buying an ETF is very similar to buying shares of a company. If you were to buy shares of Apple (AAPL), you would have a small piece of ownership of the company. Instead of having ownership in a single company, an ETF allows us to own numerous companies (or any asset class type, like energy) through a single fund. 

ETFs are therefore a great tool to democratize investing.

Real World ETF Example: S&P 500 ETF Trust (SPY)

If you understand the above painting analogy, you should have no problem with understanding how a real-world ETF works, such as State Street’s SPDR S&P 500 ETF Trust, or simply SPY.

The SPY ETF is the most popular ETF in the world. It trades more than any single company’s stock does in the world over a given day. Why?

Because of what it attempts to track- the S&P 500 index. This weighted index tracks the market capitalization of the 500 largest companies listed on stock exchanges in the United States.

In order to track this index, SPY, therefore, purchases ALL of the component stocks that make up the S&P 500 on a weighted basis.

So we can see why people would want to buy SPY now. Currently, you can purchase one share of SPY for $450. That means for $450, you get exposure to ALL companies within the S&P 500. That sounds like a great idea! But there are many ETFs that track the S&P 500; why is SPY so popular?

Let’s take a closer look at the details of SPY to find out why this particular fund is so popular.

What is the ETF “Fund Objective”?

The fund objective of an ETF is simply what the fund is trying to accomplish. Some examples would be a growth in investor value, income generation, or even a combination of both. In short, a fund wants to make us money; the fund objective tells us how they plan to go about this. 

So in order to determine what SPY is trying to accomplish, where do we go? To the source of course!

All companies that list ETFs have a website dedicated to informing the public of important fund information, such as the fund objective, holdings, and relative performance. This is generally known as the fund “prospectus”. A prospectus informs investors about key fund details. You can find State Street’s SPY fund information here

Let’s take a closer look at the details on this page next. 

SPY Fund Objective

Below, you will find the fund objective of State Street’s SPY fund, listed here under “Key Features”.

SPY Fund Objective: The SPDR® S&P 500® ETF Trust seeks to provide investment results that, before expenses, correspond generally to the price and yield performance of the S&P 500® Index (the “Index”).

Pretty straightforward, right? 

Also listed on this page is a VERY important feature that all ETFs have: a fee.

SPY Expense Ratio

ETFs are not free. Some are incredibly cheap (like SPY), but they ALL must charge something. This isn’t, after all, charity. If somebody is going to not only purchase all 500 stocks within the S&P 500 but make sure the price continues to match that of the holdings, work must be performed. 

For SPY, this fee is very low, coming in at around 0.09%.

What does this mean for us?

This means that if we invest 10k in SPY, we will pay only $9 in management fees for holding SPY over the course of the year. 

A fee of about 0.09% (or 9 basis points) is incredibly low. 

But what about the ETF’s relative performance? Its objective is to trace the S&P 500, but is it actually doing this? This brings us to our next point. 

SPY ETF Price Performance

Also included on the fund’s information page is its relative performance.

We can see from the above image that SPY is doing a pretty darn good job of achieving its objective of tracking the S&P 500. The fund’s Net Asset Value (NAV) from inception has gained 10.47% per year compared to the S&P 500 Index NAV of 10.60%. Considering the work and money required to purchase the individual stocks composing the S&P on your own, that’s quite good indeed. 

So what exactly does NAV mean? Let’s dive into that next. 

Fund Net Asset Value (NAV) Explained

The below image shows us the NAV of SPY. Additionally, you will see the total number of shares outstanding and the funds assets under management (AUM).

SPY NAV

So what exactly is NAV? Let’s look at the formula first. 

Net Asset Value = Fund’s Assets – Liabilities / Total Number of Shares.

In the SPY example, since there are no liabilities, we simply divide the fund’s assets by the total number of shares. This gives us a per-share price of about $450.

Now if you were to forgo the ETF option and buy every one of the stocks within the S&P 500 individually, you would need A LOT more than $445. Amazon (AMZN) alone would cost you over 3k!

Not All ETFs Are Created Equally

Before we move on, it is important to note that not all ETFs act as SPY. Many (if not most) ETFs underperform their benchmark and charge very high fees to do so. 

The average ETF fee is 0.53%. Compared to SPY, this average annual fee is quite high; but when compared to the average annual mutual fund fee of 1.42%, this number is quite small indeed. 

Take a look at a few of the high fee fund’s ETFDB lists below. These fees are ridiculously high and should be avoided in just about every single circumstance.

Let’s take a look at a few more examples of ETFs you should probably avoid. 

Fear of Missing Out ETF (FOMO)

One ETF in particular that stands out for its exorbitantly high fees is the Fear of Missing Out (FOMO) ETF. This ETF tries to provide investors exposure to popular stocks, such as “meme” stocks. For exposure to only 76 stocks, a management fee of 0.90% seems quite high to me!

Leveraged ETFs: ProShares UltraPro Short QQQ (SQQQ)

Proshares SQQQ ETF is another fund that got our attention for its high fees. This ETF is known as a leveraged inverse ETF. SQQQ tracks the QQQ ETF inversely, at a ratio of 3:1. This means that, in a perfect world, this fund will increase in value by 3% on a day that the QQQ ETF decreases in value by 1%. On the contrary, if QQQ increases by 1% on a given day, SQQQ should decrease in value by 3%. 

This ETF, therefore, requires a lot of manpower and trading. The result of this work performed is reflected in SQQQ’s expense ratio of 0.95%. This means that over the course of a year, this ETF is already down 1% in a constant market. 

Though leveraged ETFs are used quite effectively by investment professionals for short-turn hedging, the general retail investor should probably avoid them. They are not designed for long-term investors. Why? Their ratio (whether it be 2:1 or 3:1) usually does not last in the long run. Volatile markets chip away at the NAV of leveraged ETFs. 

If you’d like to learn more about the mechanics of leveraged ETFs, please check out our video below.

Leveraged ETFs for Beginners

To conclude this section, you should always go through the below checklist before investing in an ETF.

  1. Check the fund’s expense ratio.
  2. Make sure the fund actually tracks its benchmark.
  3. Make sure the funds NAV trades in line with its representative underlying products. 

So you may have been wondering how it is possible that ETFs are able to correspond their price to match the holdings within. There is indeed a feature of ETFs that allows for their prices to correspond to their holdings. Let’s look at that next!

ETF Price Stability Explained

The Net Asset Value (NAV) is essentially the true share price that represents how much the value of the fund’s assets is divided by the number of shares. Because ETFs trade on public markets, the share price of ETFs can fluctuate with supply and demand. Shares of ETFs therefore can sometimes trade at a discount, or premium, to the actual value of the fund’s holdings.

So what keeps the ETF shares in line with the NAV?

Authorized Participants

Traders called “authorized participants” are called upon to help level out the price of an ETF when its share price deviates from its NAV. Here’s the definition of an AP.

Authorized Participant Definition: An organization that has the ability to change the supply of ETF shares, thus providing liquidity for their representative fund. 

APs, therefore, have a relationship with an ETF issuer. APs are chosen at an ETFs launch. Their job is to keep the share price in line with the NAV. Whenever a premium or discount is present, they step in and correct it.

Authorized Participant Example: SPDR S&P 500 ETF (SPY)

Let’s say SPY shares are trading at a premium to their Net Asset Value (NAV). Can you guess how the Authorized Participant (AP) would correct this?

An AP would go out into the market and purchase all stocks that SPY holds (the S&P 500). By doing so, the AP increases the price of their ETF. Sounds like a lot of work! 

In return for providing this service, the AP receives shares of the ETF (SPY in this case) from the issuer. The AP will then sell these shares in the open market. These two actions combined help to chip away at the premium and bring the NAV in line. 

If the ETF is trading at a discount, the AP will sell shares of the underlying and buy up the ETF: just the opposite as above.

So, in short, the AP battles price imbalance by:

  1. Buying/selling the underlying shares
  2. Buying/selling the ETF itself.

These actions combined are often enough to stabilize an ETF price. APs aren’t the only ones to profit from price imbalances; if traders see an imbalance in price, they too can take advantage by participating in arbitrage.

Why You Should Avoid Mutual Funds

So hopefully by now, you’ll have a good idea of why investing in ETFs makes more financial sense than investing in mutual funds. Let’s really drive this home now.

1. Mutual Funds Typically Have Minimum Investments

For most mutual funds, there is a minimum initial investment. This often ranges between $500 and $5,000.

ETFs have no minimums. Ever. You’ll only ever need to pay the share price. And with fractional shares, you can even avoid this.

2. Mutual Funds Are Illiquid

Liquidity allows us to quickly buy and sell a security with minimal loss. Think of trading Apple (AAPL) stock. You can buy it and sell it on an exchange through your broker immediately for almost the same exact price. You also have no idea as to the bid-ask spread.

Mutual funds do NOT TRADE on public stock exchanges. You can’t buy and sell them whenever you want. Usually, you can only trade them once per day. You will have no idea at what price you will get filled. Typically, the price is the last trading price of the day. This doesn’t help you much if you want to sell a fund first thing in the morning before the market tanks 2%!

Additionally, some mutual funds have a “lock-in” period. This means you can’t sell the funds until a certain amount of time has passed.

In addition to being traded on exchanges, ETFs have no lock-in periods. 

3. Mutual Funds Have Higher Fees

Mutual funds actually have 2 fees!

1.) Expense Ratio

Like ETFs, mutual funds have an expense ratio. However, on a whole, mutual fund fees are much higher than ETF fees.

2.) “Load” Fees

Mutual Funds have “load” fees; ETFs don’t. 

There can be both “front-end” and “back-end” fees for mutual funds. This means you have to pay a flat percentage to sometimes both enter and exit a mutual fund.

ETFs have no load fees. Ever. 

Hopefully, you now realize there is seldom a case when a mutual fund beats an ETF. 

So what are some of the more popular ETFs? Let’s take a look at a few next.

Popular ETFs in Each Asset Class

Below you will find a chart illustrating the ETFs that have had the most inflows of funds over the past year. 

Popular ETFs in 2021
Chart from projectfinance; data from www.etf.com

ETFs are not limited to only stocks; they cover a wide array of asset classes. Here are some of the more popular ETFs across various asset classes:

More on ETFs

Next Lesson

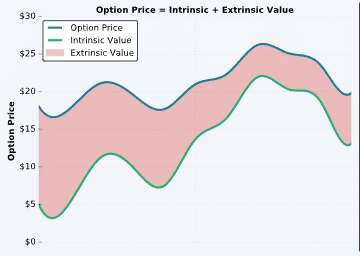
Options Trading for Beginners: The ULTIMATE Guide

Option Trading for Beginners

Options trading is complicated stuff. Period. There’s no way around this. There is a lot to learn. 

So what’s the best way to approach any complicated subject? By breaking it down into its parts of course. That’s what we hope to do here.

If you feel overwhelmed when going through the proceeding material, just remember that you’re not alone – almost all newbie option traders struggle when they first start. I know I did. After working as an options broker in Chicago for fifteen years, I’m still learning new things about options trading. Truly understanding how financial derivatives trade goes beyond the definition of simple calls and puts. 

Options Trading is NOT Stock Trading

Let’s get this out of the way immediately: options trading is not stock trading. If you wanted to go long Tesla (TSLA) equity you’d simply buy the stock. 

If you wanted to establish a bullish position on TSLA via options trading, you’d have about 10 million combinations of calls and puts to sift through. 

It is because of this vastness that options trading is more of an art than a science. 

If options trading is therefore considered both a language and art, then the best practitioners of this language are artists. 

Now perhaps you don’t have to be the “James Joyce” of options trading to make money, but you do have to acquire a certain fusion of creative and mathematical artistry. 

This article is huge. It was written as a complimentary guide to Chris Butler’s “Options Trading for Beginners,” which has become the go-to options training guide for beginners on YouTube. There is a lot within it. If you prefer to watch the video, or simply want to supplement your education, feel free to check it out below!

Options Trading for Beginners Video

In this guide, we will teach you the most important option trading concepts and ideas through the usage of numerous visualizations, explanations, and real-world examples.

So let’s get right into it!

Basic Option Characteristics

Let’s start by taking a look at a few characteristics that all options contracts have in common. Understanding these key characteristics will also help you understand how options (financial derivatives) differ from stock (equity).

  • Unlike stock, all option contracts expire. Once this date (known as the “expiration date”) passes, the option contract is invalid. They cease to exist. Stocks, on the other hand, never expire.
  • Since all option contracts expire, this means you must choose the “duration” of your trade. What are your choices? Many. You can trade options expiring today, or you can choose to trade options that expire years from today! These “long-term” contracts are known as “LEAPS” (more on these later).
  • In addition to having an expiration date, an options contract must have a “Strike Price” An option is converted to stock at this strike price. 
  • If you own a “call” option with a strike price of $105, you can convert that option to stock at the price of $105 per share. How would this be useful? Let’s say that the stock you bought the call on is trading at $120/share. Would you rather buy the stock at $120/share or $105/share?
  • The option contract multiplier is the number of underlying shares an options contract represents.
  • Usually, options have a 100 contract multiplier.

The “multiplier” concept really must be understood intuitively before we can proceed. Let’s take a moment to look closer at this characteristic that all options contracts possess. 

Option Contract Multiplier Introduction

We spoke earlier of breaking down a whole into its parts. That will come in handy here. Let’s start with a stock comparison. 

If you wanted to purchase one share of stock trading at $120 per share, it would cost you exactly $120. Simple enough.

Options contracts operate differently. An option is not stock; an option is a contract that allows you to either buy or sell stock.

We know already that an options contract has an expiration date and a strike price. But how many shares does an options contract represent?

Typically, the “Options Contract Multiplier” is 100 shares. This means that owning one options contract gives you the right to either buy (for a call) or sell (for a put) 100 shares of stock, at a specific strike price, by a specified date. 

Why is it 100 shares? Because this value makes options trading “standardized”. If all options contracts represent a different amount of underlying stock, wouldn’t that be a nightmare?!

This “multiple” trait of options also somewhat complicates options pricing. To get the true value of an option, we must therefore multiply its quoted price by 100.

Options Contract Multiplier Example

Since a call or put option almost always represents 100 shares of stock, how much money would it cost you to purchase an options trading at a current market price of $5? 

  • Option Price: $5.00
  • Option Premium: $500

An option quoted at $5 would cost you $500 to purchase. In reality, all you need to do is move the decimal point two places to the right. Though this may seem complicated at first, it’s quite intuitive once you understand how the “multiplier” factor works. 

So now that we understand the core characteristics of options trading, let’s build on our knowledge and discuss the two different option types.

Call Option Introduction

All options contracts fall under the category of calls and puts. 

We are going to first explore call options. Remember, options are “derivatives”. Their value is derived from the value of their representative stock. You can’t simply own a “call option”; you must own a call option on an underlying stock or index. For example, you can own a Tesla (TSLA) $750 strike price option contract. 

So what is a call option exactly? 

Call Option Definition:  A call option (or simply “call”) is a financial instrument that allows an investor to purchase 100 shares of stock at the strike price specified within the options contract (strike price) on or before the expiration of that option.

So what does that mean? Let’s take a look at the characteristics of a call option now to better understand this. Don’t worry if this fly’s over your head; next on our list is a simplified analogy. 

OK, so this is the textbook explanation of a call option. Chances are, you still have more questions. Let’s move onto the “house-buying” analogy now to really drive home how call options work. 

Call Options Simplified Example #1: Buying A House

Home

Perhaps the best way for new options traders to understand how calls work is the house buying analogy

Let’s say you are in the market for a home. You find a house for sale that interests you. You think the home will increase in value, therefore you believe it to be a good investment.

However, at this point, you don’t have the liquidity necessary to purchase the home. We’ll say the cost of this home is $200,000. You can’t buy it today, but you’d like to have the option to buy that home between now and two years from now. 

In the real estate market, you would be out of luck. 

Let’s pretend for a moment that the housing market works as the options markets work. First off, let’s take a look at our inputs. 

We have a “strike price”, which is $200,000. Additionally, we have an expiration date, which is 2 years away (when our contract will expire). Since we already know what these terms mean, let’s go ahead and make an options contract!

So what “trade details” do we have so far?

Strike Price: $200,000

Option Expiration: 2 Years From Today

The above “call option” that we just created gives us the right to purchase that house in 2 years from today (or sooner) for a price of $200,000.

Sounds like a good deal to us! But what about the seller of that home? Think they would agree to this? Heck no! What if the house price falls; you’re not entitled to purchase the house. This makes zero sense to the seller. 

Ok. But what if we paid them for this right? Hmm. The seller of that house is interested. How much will you pay them for this right?

An Introduction to Option Premium

The seller of the home agrees to the contract, as long as you pay them a premium. 

Let’s say you agree on a premium of $10,000. So for the right to purchase this home between now and two years from now at $200,000, you must pay the seller of that home $10,000 today. Let’s add that to our trade details.

Strike Price: $200,000

Option Expiration: 2 Years From Today

Option Premium: $10,000

So let’s say one year has passed, and that home is currently valued at $350,000. 

Home Price Increasing

Wow! That’s a huge surge in price. So what does that mean for us?

Well, we bought a “call” option at the $200,000 strike price for $10,000. This means that if the value of the home rises above $200,000 plus the premium we paid, we will “breakeven” on the trade. Our breakeven price is thus $210,000.

But that house is valued at $350,000 today! Are we going to exercise our contract, and purchase the home at $200,000? You betcha!

How much did owning this call option make us? 

Since we breakeven at $210,000 (strike price + premium) and the value of the home is $350,000 one year into the contract, we would make $140,000 on the trade today.

How do we do this? By “exercising” our $200,000 strike price call option and purchasing the house. 

That would indeed be an amazing trade. But what if things didn’t go our way? What if, in two years, the value of that home went down in value?

Call Options Simplified Example #2: Buying A House

Let’s look at the same trade with a different outcome. Again, here are the details of our trade:

Strike Price: $200,000

Option Expiration: 2 Years From Today

Option Premium: $10,000

Let’s say that in this scenario, the value of the home decreased in value from $200,000 to $150,000 in the days leading up to the expiration of our 2-year contract.  

This trade has gone against us. How much did we lose?

They are called “options” for a reason. We don’t have to exercise our right to buy this home – it is our option. And we paid dearly for this right, $10,000 to be exact. In order to understand our max loss in this outcome, take a moment to study the below visual. 

Home Price Falling

So are you going to exercise your right to purchase this home for $200,000 when it’s valued at $150,000? No thanks. 

But we are going to lose something here, and that something is the premium we paid, or $10,000. 

What is the value of our call option at this moment? Well, zero. 

Remember, two years have passed and that option is expiring presently. The value of that home has a 0% chance of rising to $200,000. 

If you wanted to sell the option to purchase this home at $200,000, nobody would be willing to buy it. The call will “expire worthless”, perhaps the two most dreaded words for those who purchase option contracts.

Call Option vs Buying the Home in the Open Market

So we lost $10,000, and that sucks. But what would we have lost if we simply purchased the home in the first place? We would have paid $200,000 cash for it. When the value of the home fell to $150,000, we would have lost $50,000. 

Now that $10,000 loss doesn’t sound too bad, does it?

This is used simply as an example. In the real world, most option premium buyers lose money. Why? Because prices typically don’t rise as fast as they did in our example. Additionally, if you had simply bought the home in the first place, you probably wouldn’t have sold that home when it was valued at $150,000. You would have waited for a bullish housing market. 

With options, you don’t have the luxury of time. Options expire. Every single one of them, at some date in the future. Don’t think that simply buying call options will make you money. The vast majority of “premium buyers” lose money over time. 

Now that we understand the fundamental of call options, let’s take a look at a real-world example of a call option on Tesla (TSLA) stock.

Tesla (TSLA) Call Option Example

The below image (as all of our trading software images) comes from the tastyworks trading platform.

The above image highlights the various option chains on TSLA stock. We selected an option expiring on June 19th, 2020, which expires in 39 days. Additionally, we can see that we have a strike price of 800. 

Also, note that the stock is currently trading at $811. That is very important. 

Don’t be intimidated by the extra numbers here; remember, we know what both expiration date and strike price means. That’s all you’re seeing on this screenshot; just a whole lot of different contracts on that same “house”, which is now TSLA stock.

So what does this image tell us? If we buy the TSLA 800 strike price call expiring on June 19th, 2020 (39 days away) we will have the right to purchase TSLA stock at any point in time between now and that option’s expiration date for a price of $800 per share. 

What we’re going to add here, when compared to the home buying example, is a “multiplier”.

Options Contract Multiplier Explained

When we purchased our house, our multiplier was 1. Our contract represented one house.

That is going to change here. Our TSLA call option does not represent one share of TSLA, it represents 100 shares. We touched upon this before.

Because of this, we must multiply the options price by 100 to get the true cost of the premium. 

Call Option Example TSLA

We can see that the bid for this option is 78.65 and the ask is 84.75. So what can we purchase this option for? Somewhere between these two prices. This is known as the “Mid” point (the “middle” of the bid and ask), and you can see it at the bottom of the screen: $81.70. 

So buying this option would cost us $81.70. But what is our true cost, or premium? Simply multiply this number by 100:

  • Option Price: $81.70
  • Option Premium: $8,170

This is therefore a very expensive option. Not all options are this expensive. But why is this one so expensive?

TSLA Call Option Pricing Explained

Remember, the owner of a call option can exercise their right to purchase 100 shares of the underlying stock at the strike price specified in the contract. 

If you purchase this TSLA June 800 call option, you believe TSLA will increase in value dramatically.

Below you will find a visual of our trade in addition to the “trade details”. 

TSLA CALL multiplier

Current Stock Price: $811

Strike Price: 800

Option Expiration: June (39 days away)

Option Premium: $81.70

So we bought the 800 strike price call option for $81.70. 

Let’s say that in two weeks from now, TSLA has had a massive rally. The shares rallied from $811/share (the share price when we bought the call) to the share’s current price of $1,000/share. 

We have in our possession a financial contract that gives us the right (but not the obligation) to purchase 100 shares of TSLA at $800/share (our strike price).

Are we going to exercise this right? You betcha! 

Let’s say we just exercised our option and purchased 100 shares of TSLA at $800/share. 

What happens now?

TSLA continued

Since we are exercising our right to change the option into long stock, we have to now pay for the stock. Since we are buying 100 shares of the stock at our strike price of $800, this will cost us $80,000, as seen in the chart above. 

Remember, TSLA shares are currently trading for $1,000/share. We just bought 100 shares at $800/share. If we immediately sell these shares in the market we will have netted a profit of $200/share. Since we own 100 shares that profit will be $200 x 100, or $20,000.

Remember! Just like in the house example, we paid for this right. How much? $81.70, or $8,170 in out-of-pocket premium. Because of this, our profit just went down. By how much? Simply subtract $8,170 from $20,000 to get our net profit, which is $11,830 in profit, or a 145% return.

Why Tesla (TSLA) Premiums Are So Lofty

So why are the premiums in TSLA options so lofty when compared to other stocks of a comparable value? 

Because TSLA stock has huge swings. It is very volatile. It may go up 25% in a month, just as easily as it may go down 30%.  Option premiums take into account these swings. 

If the historical price of that house we were looking at earlier only deviated between 190k and 210k, wouldn’t the call option we purchased on that home be cheaper? 

The greater the odds a stock has of breaching our strike price, the greater the premium will be for options on that stock.

Before we move on to a few more interesting examples, let’s first answer one question that almost all new options traders have.

Do You Have to Exercise an Option to Make a Profit?

No! Option traders rarely, if ever, exercise their options contracts. You do not have to exercise your option to realize a profit. 

So what do you do? Sell the contract in the open market, just like you did when you originally purchased the contract. Just like you would with stock. 

So why are we using exercisement in our above example?

You must first understand the mechanics of options trading. 

In theory, you could exercise your call option here, but in reality, traders rarely (if ever) do it. But understanding the exercise (and subsequent “assignment”) process is integral to understanding how options work. You must understand that an option’s value comes from its ability to trade like shares of stock at the strike price rather than the stock’s current market price. 

In our above example, we showed how exercising our option would allow us to purchase TSLA at $800/share and immediately sell that stock at $2,000. Remembering that, let’s move onto something very important: the options pricing law.

Option Pricing Law

An option’s price will ALWAYS include the benefit (profit) that it will provide the owner if they were to exercise the option.

In other words, when we sell that TSLA call option in the open market, its extra value will be embedded in the price. Therefore, there is no need to exercise our right to purchase the underlying stock. 

Let’s take a look at the details of our trade to better understand this:

TSLA Call Strike Price: $800

TSLA Stock Price: $1,000

Since we can make $200 from exercising our call, that call option must have that extra value included in its price. That extra value can be seen in the options premium, which must equal that $20,000 profit we would receive should we exercise our call. 

Therefore, our call options must be worth at least $200. If the option price is $200, then the premium of that option must be $20,000.

When we look at this from a wide view, we can see this is similar to trading stock. We want to buy the option low, then sell it high. On a very elementary level when comparing stock trading with options trading, the only difference is you need to change the multiplier.

Let’s now return to our TSLA call and see what became of it after some time. 

What Happened to Our TSLA Call?

So let’s say one day has passed since we bought that TSLA call for a price of $81.70. 

As it turns out, the stock has increased from $811/share to $836/share. Since the stock went up by quite a bit in a short amount of time, can you guess what happened to our call option?

Bingo! It went up in value. 

We can see from the above image that the premium of that call option we purchased (or went “long”) increased in value from $81.70 to $94.10. Nice!

So how much did we make on this trade? We simply subtract 94.10 from 81.70, which gives us a profit of 12.40. 

So what’s our net profit? Simply moving that decimal place over two places gives us a net profit of $1,240.

This gives us a percentage profit of 15%. Remember, this was during a time when the stock only increased 3% in value. If we would have held the stock only, we would have made much less on a percentage basis than owning the call option.

Options Give Traders Leverage

The reason that our call option was able to make 5x more returns than the stock during the same time frame is because of the great leverage that options provide. Remember, one option contract represents 100 shares of stock. 

It isn’t uncommon for an option to increase 100%, even 300%, over a time period when the stock only moves 5%. 

On the flip side, you will see your profits decline just as fast when the markets turn against you.

However, when you purchase an option, you can only ever lose the premium you paid: you can only ever lose 100%, but you can also make 300%, or even higher. 

Recap: What We've Learned About Call Options

Let’s do a brief recap of what we’ve gone over so far.

  1. Call options represent one of two types of options (“put options” are next!).
  2. A call option gives the buyer the ability to buy 100 shares of stock at the call’s strike price.
  3. A call option becomes more valuable as the share price increases.
  4. You do not have to exercise a call option to realize profits.
  5. Options provide for leveraged return (and losses!).

So far, we’ve looked at the sunny side of options. But there is also a dark side. In fact, most “premium buyers” lose money over time. Let’s next look at how a call option can lose money.

How Long Call Options Lose Money

When you buy a call option, you must be right about the direction of the underlying stock price. The stock must go up in value, and go up quite fast. If the stock stays the same or goes down, you will lose money. That means, in theory, you will only make money 33.33% of the time. 

Let’s revisit our house example to understand how a call option can lose money over time.

Home Price Falling

In our house example, we bought a call option with a strike price of $200,000 for a premium of $10,000.

In the second outcome (seen in the above image) the house value declined in value from $200,000 to $150,000. Since the valuation of the home is lower than our strike price of $200,000, the option has no benefit. We lost the entire $10,000 in premium. 

If we still want to buy the house, we’ll just buy it at its current market price. 

Let’s now look at a trade where a call option does not make money due to a subsequent fall in stock price.

Adobe (ADBE) Call Option Example

On the left-hand side of the below image, you will see the stock price of ADBE; on the right-hand side, you will see a chart that tracks our specific options price (you can chart specific option prices just as you can chart stocks!).

So in this example, we decided to purchase a call option on ADBE with an expiration of May 18th. Here are our trade details:

ADBE Stock Price at Entry: 362.52 

Call Strike Price: 380 

Days to Expiration: 12

Option Price at Entry: $1.92 ($192 Premium)

Looking at the bold line on both charts, we can see what happens to both the option and the stock as time passes and that May 18th expiration approaches. 

We bought the ADBE May 18th 380 call, so we believe the price of ADBE would be above 380 by May 18th. 

However, we can see that is not what happened. With only one-day left until expiration (on May 17th), the option we paid $1.92 for is only worth $0.01!

Why? 

Well, the price of ADBE stock fell from $362.52 to $355, not anywhere near the price of our 380 strike price call! 

What are the odds that ADBE rallies from $355/share to $380/share in one day? Not great. That is why our call option is only worth a penny. Who the heck wants to buy ADBE for $380/share when it’s trading at $355/share?

ADBE Stock Price at Entry: 362.52 ——-> $355

Call Strike Price: 380 

Days to Expiration: 12 Days——-> 1 Day

Option Price at Entry: $1.92 ($192 Premium)

So what do we do now? Well, probably nothing. If/when that option closes out-of-the-money (more about option “moneyness” to come) at expiration, it will expire worthless. The next trading day, it will simply disappear from your account. No action is required. We will simply have lost the entire premium of $192 paid. 

We’ll dive deeper into closing options later on, but for now, just know that as the stock price drifts further away from your strike price, your option contract will approach zero. 

OK! Ready to move on to “puts”? Take a break, then let’s plow ahead!

Put Option Introduction

Long Put Chart

We mentioned in the last section that all options contracts are either calls or puts. We went over call options in our last example, but what are put options?

Let’s take a look at the textbook definition, then we’ll explore what a put option really is.

Put Option Definition:  A put option (put) is a financial market derivative instrument that gives the holder the right to sell a stock at a specified price, by a specified date to the seller of the put.

Ok, that probably didn’t help you much. I know it didn’t help me when I began learning this stuff 15 years ago. Let’s break it down into a few bullets.


So since put options give us the right to sell a stock, doesn’t it make sense that the value of a put option increases as the stock price falls

Let’s look at an example.

IWM Put Option Example

The below screenshot (taken from the tastyworks trading platform) shows us the options chain for IWM, which is an exchange-traded fund (ETF) by iShares that tracks the Russell 2000 ETF.

Here are the initial details of our trade.

IWM Share Price: $130.71

Expiration: June (38 Days Away)

Strike: 130 Put

Option Price: $6.24 ($624 Premium)

Just to reiterate, the mechanics here are all the same as those of call options.

  1. Our maximum loss is still the premium paid ($624).
  2. Our multiplier is still 100.
  3. We are making a very directional bet (bearish instead of bullish now)

The only difference is here, we believe the stock is going to go DOWN in value as opposed to up. 

So we are long the 130 put when the stock is trading at $130.71. This means we believe the stock is going to go down in value. By how much? Well, at least to $130/share. 

But even if the stock is at $130/share at option expiration, we still won’t make money. Why? Just like with calls, the stock has to move far enough to cover the premium paid. 

In this example, we paid $6.24 for the call. So, the stock must fall to $123.76 before we start making money. How did I come to this number? Simply subtract the premium (6.24) from the strike price (130).

Now let’s take a look at how this trade plays out.

IWM Put Option Trade Outcome

Here’s a visual of how our trade played out after only 1 day. 

IWM Share Price: $130.71 —–>$122.72

Expiration: June (38 Days Away)

Strike: 130 Put

Option Price: $6.24 ($624 Premium) —-> $11.30 ($1,130 Premium)

So what happened here? The stock went down in value. If we had a call, we would be shaking our heads; but since we own a put, we are celebrating. 

The stock has gone down in value by about $8/share. Since our put option gives us the right to sell 100 shares of stock at the strike price 130/share, our put options value has gone up. Wouldn’t you rather sell stock at $130 as opposed to $122.72, the current stock price?

Short selling can be confusing, but for now, just know that when you sell something, you want it to go down in value to buy it back cheaper. 

In theory, you can sell 100 shares of this stock right now for $130/share, then immediately buy it back for $122.72/share, netting us a profit of $7.28/share. Remembering that a put option represents 100 shares of stock, this gives us a profit of $728 (not considering the premium paid).

However, as we learned before, exercising your options is NOT the best way to realize your profit. You will actually lose money by exercising your option (more on this later) as opposed to outright selling the option in the open market. 

Right now, we can sell that option for $11.30. Since we bought it for $6.24, that gives us a net profit of $5.06, or $506.

Profitability of Shorting Stock vs Owning a Put

Our put netted us a profit of +81%. During this same time, the stock only fell by -6.1%. How is this possible? 

Just as we talked about with calls, this is because of the great leverage that options offer us. On the other hand, we can equally lose money just as fast when the underlying stock goes against us.

Losing Money Buying Puts

So what would happen to the profit/loss on our put option if the price of IWM went up instead of down

In the above trade example, we looked at the profitability after one day. Let’s fast forward now to expiration and see how our put performed.

WM Put Purchase Losing Money

In this example, IWM closes above our strike price of 130 at expiration. This is not good news for our put. 

How much did we lose? The entire premium of $624 paid. Who in the world would want to sell stock at $130/share when that stock is trading at $135/share on expiration? Nobody. Therefore, we will lose it all. 

Let’s take a look at another put example now on Nvidia (NVDA)

Nvidia (NVDA) Put Option Example

The below image shows two charts on NVDA; on the left-hand side, we see a stock chart of NVDA; on the right-hand side, we see a chart of our put option on NVDA. Note the upward trending stock price; that is not good news for a long out.

And here are our initial trade details:

Initial NVDA Share Price: $283

Expiration: May 18th 

Strike: 280 Put

Option Price: $11 ($1,000 Premium)

So we can see that after we bought our put, the stock surged higher. How did our long put fare? Not well! 

As expiration nears, the price of NVDA skyrockets from $283/share to $321/share. Our put option gives us the right to sell 100 shares of NVDA at $280/share. As the stock trends higher and expiration nears, that put options approaches 0 in value. Ouch!

Initial NVDA Share Price: $283 —-> $321

Expiration: May 18th 

Strike: 280 Put

Option Price: $11 ($1,000 Premium) —->$0.00

So what will happen if our put option is out of the money at expiration? It will expire worthless and disappear from your account. No action is required on your end. Even if you wanted to sell it, you probably wouldn’t be able to. Why? 

Well, would you pay for the right to sell stock at $280/share when it’s trading at $321? Nobody else is willing to pay either.

This is an example of the downside of leverage; you can lose it all just as fast as you can triple your initial investment. 

This leads us to another interesting subject.

Buying Puts vs. Shorting Stock

Put buying does offer investors an additional benefit when compared to selling short stock, and that involves risk. 

Given the amount of leverage that options offer, this may come off as counterintuitive, but options actually offer less risk than selling short stock. 

Why? When you sell short a share of Apple (AAPL), what is your maximum loss? In theory, it is infinite. There is no cap on how high AAPL can run. 

If you were alive in 2021, you surely heard about the Wall Street vs Reddit GameStop (GME) battle. In a matter of weeks, GME went from about $10/share to $300/share. If you were to short one share of GME at $10, your losses would be $290/share, about 30X your initial investment. 

Put options, however, have defined risk: it doesn’t matter how high the stock goes, your maximum loss will ALWAYS BE the premium you paid. 

However, in order to profit on a put, you need the stock to go down fast. Similar to call options (only flipped around), if the stock stays the same or goes up, you will lose money. 

You may even lose money if the stock falls! How? The stock may not fall fast enough or by enough percentage to reach your long put strike price – premium paid. 

For more information on shorting stock (and GME) please read our article Long vs Short Explained.

Option Price Components (Intrinsic & Extrinsic Value)

Next on our options education journey comes the price components. Let’s look at the definition, then break it down. 

Option Price Components: An option’s price consists of two distinct parts: intrinsic value and extrinsic value, aka time value (theta). Intrinsic value measures an option’s profitability based on the strike price when compared to the stock’s market price. Time value (extrinsic value) refers to the portion of an option’s premium that is ascribed to the amount of time remaining until the expiration of the option contract.

So far, we have discussed the two most basic options trades that an investor can place; “long call” and “long put”. You must understand both of these thoroughly before we move on. If you don’t understand the foundational call and puts, you won’t understand the innumerable ways that you can combine them. That’s when things get interesting. 

In addition to understanding calls and puts, you must also understand what intrinsic and extrinsic values are. Having a solid grasp of these terms will help you better understand more complicated options strategies, such as “iron condors” and “calendar spreads.”

So let’s get right into it. 

So far, we have studied how an option contract trades as it does, but we haven’t yet understood why

Chances are, you have been asking yourself some questions in the above examples. A lot of those questions will be answered in this segment, which will explain why an option is priced the way it is. 

Two components make up the entirety of an options price.

Intrinsic Value Explained

Though you may not know it, you probably already know what intrinsic value is. 

Remember that home example, when the home was valued at $350,000 and we were long the $200,000 call? Keep that in mind. 

Here’s one definition of intrinsic (divorced from options): Intrinsic value is a property of anything that is valuable on its own

Keeping in mind “valuable on its own”, the intrinsic value here would be 350k-200k, or $150k. This is the amount that the option is valuable on its own, not including external factors. Therefore, the intrinsic value, or the least amount of money that we should accept for this home, is 150k.

In other words, intrinsic value is the amount an option is “in-the-money” by, more on this term later (though it’s pretty straightforward!). 

So that was a call example, but what about the intrinsic value of a put?

Again, just flip everything on its head for puts. If you own a put option with a $130 strike price, and the stock price is $120, that tells us our put is in-the-money by $10. This is the least amount of money we can sell the options for. Also, (going back to our definition) you can look at that $10 portion of the options premium as the value of the option that is valuable on its own. 

Intrinsic Value of Options

Let’s take a look at one more example.

TSLA Trade Details:

Call Strike Price: $800

Stock Price: $1,000

So we are long a TSLA $800 call with the stock trading at $1,000. What’s the intrinsic value of our call?

Bingo. $200. Simply subtract the stock price from the call price, and you will have your intrinsic value. 

TSLA Trade Example: Introduction to Extrinsic Value

So if intrinsic value is the least amount of money we should sell an option for excluding external factors, don’t you want to know what those external factors are? Sure! We want to sell our option for as much as possible. The external factor portion of the value of an option is known as “Extrinsic Value”.

Let’s take a look at a real-world example here on Tesla (TSLA).

Call Strike Price: 800

Stock Price: $836.41

Intrinsic Value: $36.41

Current Option Price: $94

Hopefully, you were able to figure out the intrinsic value here. What should be interesting to you is the option is not valued at its intrinsic value of $36.41, but much higher, coming in at around $94.

So where does that almost $60 in extra premium come from? Extrinsic value. Remember, the value of an option is either extrinsic or intrinsic value. If it’s not one, it’s the other. 

Let’s explore extrinsic value next!

Extrinsic Value Explained

Option Premium

An option’s extrinsic value is the portion of the option’s price that exceeds its intrinsic value. Sometimes, this value is referred to as “time value”.

Pretty simple, right? Extrinsic value is simply everything leftover from intrinsic value. 

So if intrinsic value is determined by the amount an option is in-the-money by, what determines extrinsic value?

An option’s extrinsic (aka “time value”) is the portion of an option’s price associated with the potential for the option to become more valuable as expiration approaches. 

Doesn’t that make sense? Over time, extrinsic value sheds as the option has less time to meet/exceed the strike price.

Let’s revisit the TSLA trade example from above.

Call Strike Price: 800

Stock Price: $836.41

Intrinsic Value: $36.41

Current Option Price: $94.10

Extrinsic/Time Value: $57.69

Time to Expiration: 38 Days

We can see that the intrinsic value of the option is $36.41. We learned that before; this is simply the amount an option contract is in-the-money by. 

If this were the only factor at play, the option would be priced at $36.41. But it’s currently priced at $94.10. This price exceeds the intrinsic amount by $57.69.

Guess what that $57.69 represents? You got it. It represents the option’s extrinsic value.

So why does that extrinsic value exist?

TSLA shares are incredibly volatile. They swing all over the place. 

This option currently has over 30 days to expire. During this time, there is a lot of potential for the stock price to swing higher yet.

If you’re a science buff, you could call the extrinsic value the options “potential” energy and the intrinsic value the options “kinetic” energy. 

Extrinsic Value Over Time

We learned that an option’s “extrinsic value” is synonymous with an option’s “time value”. Let’s understand why. 

In the above TSLA trade, the options extrinsic value was high because there were over 30 days left in the options life. That is plenty of time to send that option to the moon should investors like Elon’s next tweet. 

So what happens to that options’ extrinsic value over time as expiration nears? Bingo. It goes down. That is assuming the option stays in-the-money. 

When An Option is All Extrinsic Value

We mentioned earlier that intrinsic value represents the portion of an option that is inherently valuable. You can see that value. But what about options that are “out-of-the-money”, like those losing trades we covered earlier?

The value of out-of-the-money options is ALL extrinsic value. And since extrinsic value sheds as expiration approaches, guess what their extrinsic value will be at expiration if the option remains out-of-the-money? Zero. Their intrinsic value is also zero. That should explain why those options expired worthless.

Let’s now see this in action.

Extrinsic Value Comparison Using AAPL Options

Take a moment to study the below image. 

In the above options chain, we have selected several different call options. Though their expiration dates are different, there is one constant theme: they are all out-of-the-money, meaning the strike price is above the stock price. 

This means that the options have no intrinsic value. But they do have some value, and that value is extrinsic, 100% extrinsic value to be exact. 

This simply means that their value is derived completely from the time value, or hope, that the stock price will rise above our 305 strike price before expiration. 

Now take a look at the January 305 call options with 246 days until expiration trading at about $34. Compare that with the January 305 call option expiring in 1-day trading at about $4.60. 

That’s a huge price difference! (when we say price, we also mean extrinsic value, since the option is ALL extrinsic value).

Greater Time = Greater Extrinsic Value

This should make sense. The January option allows for a TON more time for AAPL to breach its strike price than that of the May option, which expires tomorrow. 

So let’s say we went ahead and bought that January AAPL 305 call for $34 ($3,400 premium). We’ll also assume that all of the 246 days have passed, and AAPL hasn’t budged one bit, but traded at $304.92 during the duration of the trade, all the way to expiration. 

So what happens to our call option premium? In an environment where the stock price remains the same, our option is going to slowly decay, as seen above. With one day to expiration, this option will be trading at a fraction of its initial price. 

We mentioned earlier that if you buy a call or put option, and the price of the stock doesn’t budge, you will lose money on that option. Hopefully, now you will understand why. 

So far, we have used the terms “in-the-money”, “at-the-money” and “in-the-money”. Chances are, you have a general idea of what these terms are by now. Let’s take another look at them before we move on, as understanding them is integral to what we will learn next.

Option "Moneyness" for Beginners (ITM, OTM, & ATM)

option moneyness chart calls and puts

All of the “moneyness” terms (in-the-money, out-of-the-money, & at-of-the-money) describe an options strike price relative to the stock price. Therefore, they also tell us whether an option has intrinsic value or not.

In-the-Money (ITM) Options

Any option with intrinsic value is said to be “in-the-money (ITM)”.

ITM Call Options: Strike Price Below the Stock Price

ITM Put Options: Strike Price Above the Stock Price

Let’s revisit our TSLA trade briefly

Call Strike Price: 800

Stock Price: $836

So since this option has intrinsic value, it’s ITM. It’s that simple. 

Out-of-the-Money (OTM) Options

Any option without intrinsic value is said to be “out-of-the-money (OTM)”.

OTM Call Options: Strike Price Above the Stock Price.

OTM Put Options: Strike Price Below the Stock Price

Here’s an example from our previous IWM trade. 

Put Strike Price: $130

Stock Price: $130.71

Since the strike price is below the stock price, this option is therefore trading out-of-the-money, or composed 100% of extrinsic value.

At-the-Money (ATM) Options

Any option with a strike price very close to the current stock price is said to be “at-the-money (ATM)”.

Call/Put Strike Price: $150

Stock Price: $150.13

The strike price of an option doesn’t have to be trading at the exact price of the stock to be considered ATM. In the above trade, either a call or put with a strike of $150 would be considered ATM with a stock price of $150.13 (even though technically the call is ITM and the put is OTM).

Introduction to Shorting Options

So far, we have learned how to buy calls and buy puts. This is where most options traders stop learning. It is perhaps because of this that most options traders lose money. 

I said before that options trading is a vast universe. To function in this universe, you must first understand how both buying and selling options work. Truth be told, more people make money selling options than by buying options. 

We are now going to go over the very basics of short selling options. Even if you don’t want to short options “naked” (or sell without any protection), you must understand how selling options work if you want to incorporate options trading strategies such as “iron condors” and “vertical spreads”.

We asked you before to think of options trading as learning a new language. You have learned so far the basic grammar and vocabulary of buying options; let’s now extend that to selling options. 

Now that you’re ready, let’s start by making an analogy to the stock market. 

Buying vs Shorting Stocks

In the stock market, you can either buy or sell shares of stock. If you buy stock, you’ll profit when the stock goes up. If you sell a stock, you’ll profit if that stock goes down in value. 

Let’s focus for a moment on selling stock.

Shorting stock refers to first selling a stock (that we don’t own) with the anticipation of buying it back later for a profit. This can get quite complicated, but for now, just think of it as easy and basic as buying stock, only flip everything on its head.

If we sell a stock for $100 (as seen above), then buy it back for $90, we will make a profit of $10/share. It’s that simple. 

So why can’t we do this with options? We can, and options traders LOVE selling options (also called selling “premium”).

Just like with selling stock, we aim to sell an option high and buy it back low at a future date.

Shorting Call Options Introduction

Short Call Option Graph
The above graph represents the profit/loss profile of a short call at expiration, where X represents the strike price of the call sold.

Now that we have a basic idea of what a naked call looks like, let’s take a look at a trade now.

Opening Trade: Short a Call for $5.00 ($500 Credit Into My Account)

Closing Trade: Buy the Call for $3.00 ($300 Debit Out of My Account)

So if we sold the option for $5, and bought it back for $3, we just netted a profit of $2, or $200 in premium. Easy right?

IWM Short Call Example

Now let’s take a look at a real-world example.

Here, we are looking at the IWM June 125 Call Option with 36 days to expiration. As we can see, the current share price of IWM is $120.59.

First of all, what does that tell us about the call options price? Does it have intrinsic value or is it only extrinsic value?

Since the strike price is $125, and IWM stock price is $120.59/share, we can tell that the option is out-of-the-money, therefore, its value is 100% extrinsic. In other words, its price is all “time value.”

As we discussed before, time value comes out of the option price as it approaches expiration. Remember that, then take a look at the below option price.

We can see that the price of the $125 IWM call option is $4.66, which means the premium is $466. When you sell or short an option, you don’t PAY the premium; you COLLECT the premium.

In this case, since the premium is $466, if we sell this option short, our account will be “credited” with $466. 

Sounds nice, doesn’t it? Of course, there’s more to it than this. 

Just because we collect the premium does not mean we have a profit; we must later CLOSE the trade and buy it for a lower premium to realize a profit. 

As the option price falls, and if the stock price remains below $125, the profit on this position will slowly increase. It is a very fluid process and takes a bit of time and patience. 

Shorting Calls Has Unlimited Loss Potential

Take a look at the below image, which shows how a short call reacts to a rise in stock price.

What should concern you on this chart is the upward trend of that red line. Remember, the maximum loss on short calls is unbound; the stock can go up forever. Just imagine selling short a $20 strike price call on GameStop (GME) only to watch it rally to over $300! 

Let’s return our short IWM call, which we sold for a premium of $466. Let’s compare that strike price with the strike price of a similar IWM option closer to expiration.

We can see above that the price of the 125 call option expiring in one day is trading at $0.23, or a premium of $23. 

This tells us that in a constant market, that option we sold short for a price of $4.66 with 36 days to expiration will be worth only $0.23 after the passage of 35 days. Why not zero? Well, there is still one day to go. 

If we sell an option for $4.66, and then buy it back for $0.23 later, we will make a profit of $4.43 (4.66-0.23), or $443 in premium off the trade. 

So knowing how much you can potentially lose on a short call, how does your broker let you place this trade? What do you have to “put down”? It can’t all be free!

Margin Required for Selling Options Short

You must have a margin account to sell short options. How much “margin” do you need to sell a naked call? 

That depends on the trade you are doing and the risk involved. The formulas that different brokers use can get quite complicated. Luckily, it’s calculated for us.

We can see that to sell this IWM call, tastyworks requires $1,958.70 to be held on margin, or “in reserve” should that trade go against you. This is a lot of money. Therefore, you must also consider “opportunity lost” when selling options. What else could you have used that money for?

Now let’s take a look at a “naked” call option that doesn’t work in our favor.

Netflix (NFLX) Short Call Example (Big Loss)

In this example, we are going to see a significant rise in stock price after we sell short a call option. 

Take a look at the below image. On the left-hand side, you will see a chart of the stock price; on the right hand side, you will see a chart of our short option.

Here are the details of our short trade:

NFLX Share Price: $370 

Expiration: June 

Strike: 400 Call

Option Price: $17 (Credit of $1,700 to our account)

In the above trade, we went short a call option (the 140 Call) for $17 just days before the underlying NFLX stock skyrocketed in value. If we were long that call it would be winner-winner-chicken-dinner, but we decided to sell it instead. 

Remember, trader’s sell short calls when they believe the underlying stock price is either going to stay the same, or go down in value. 

Before we examine our trade results after just a few days, I want you to recall the maximum loss you can incur on a LONG call; which is always the debit paid. If we bought this call instead of selling it, we would have had a maximum loss of $17 (or $1,700). 

But we sold it. 

So how much is our trade down after just a few days? More than $17, a lot more actually!

Here is our trade updated to reflect a rise in NFLX:

NFLX Share Price: $370 —> $440

Expiration: June 

Strike: 400 Call

Option Price: $17 —-> $62.50

Since the stock rallied $70 in a short amount of time, our short call option got hammered. We sold the call for $17. Therefore, the most we can ever make on this trade is that $17, or a premium of $1,700. 

But we lost money here, a whole lot. Since the option we sold for $17 is trading at $62.50, our loss is $45.50 so far on the trade (or $4,550). 

Ouch!

We lost $4,550 in a scenario where our maximum profit was $1,700. You don’t have to be a financial expert to know this isn’t a good risk/reward profile.

Short Call Breakeven Price Explanation + Illustration

Now, we are going to discuss how it is indeed possible to make money off of a short call option position when the stock price breaches the strike price of the call option we sold. 

This is because of something called “Breakeven Price”. Remember, to determine the profit/loss on an options position, you must also include the debit paid or the credit received. 

Let’s take a look at a visual to help you better understand this.

If you short a call option with a strike price of $400 for a net credit received of $17 (like we did above), at what price would the stock have to be in order for our option to be worth $17 or less at expiration?

This should be quite easy: since we sold the 400 call for $17, any stock price under $417/share will make our trade profitable. Remember, we want our short call to go down in value. 

In order to determine the breakeven point, we must determine the price at which our 400 call has an intrinsic value equal to our sale credit of $17. 

More simply, the breakeven on a short call position is simply strike price + option premium sold

Here’s another visual to help.

The above example shows NFLX stock closing at $417 on expiration. Since we sold the $400 call for $17, we would breakeven on this trade. 

If NFLX closed at $410/share instead on expiration, can you guess what our profit/loss would be?

Simply subtracting our option breakeven price from the market price ($417-$410) gives us $7, or a profit of $700.

So even though our short call was in the money at expiration, we still made money.

Shorting Put Options Introduction

Short Put Option Graph
The above graph represents the profit/loss profile of a naked short put option at expiration, where X represents the strike price of the put sold.

Last on our list is the short put strategy. Remember, all options trading strategies are a combination of long puts/calls and short puts/calls. 

 After learning the mechanics of short puts, learning more advanced strategies such as the “diagonal” spread should be quite easy. 

Similar to shorting calls, shorting put options involves selling options that you do not own. Shorting putting may take a bit of time to understand as it can come off as counterintuitive. 

Usually, when you short something, you believe the underlying price will go down in value. But with puts, just the opposite is true. If a long put makes money when the market falls, then selling that put must make money when the market rises.

It is because of this that selling put options is a bullish strategy.

Take a minute to process that. It will make what is to come much easier.

Activision (ATVI) Short Put Example

In this example, we are going to look at a short put option on ATVI.

And here are our trade details:

ATVI Share Price: $67

Expiration: May (2 Weeks Away)

Strike: 65 Put

Option Price: $1.75

So we just sold a put. What does that mean? It means we think the price of ATVI is either going to stay the same or go up. Even though we are BULLISH on ATVI, we are short an option. Again, since long puts lose money when the market goes up, short puts must make money when the market goes up. 

That is exactly what happened here; the stock price went up, and the value of our short put went down. That’s good news!

Breakeven is always a great place to start. Remember, breakeven is the expiration price of the stock where we will not make or lose money on our options. This was quite easy to calculate for calls. Put can be more complicated. Can you figure out our breakeven price here intuitively?

Since the breakeven for short calls is strike price + premium sold, the breakeven on short puts must be strike price – premium sold. Remember, puts have intrinsic value when the price is BELOW the strike price, just the opposite of calls.

Our strike price is 65. Our premium received was $1.75. Therefore, our breakeven price on this short put is $63.25/share at expiration (65 – 1.75).

So this trade ultimately looks like it was a winner. But that wasn’t always the case. Notice how the stock sold off in the early days of the options life? How was our short put performing then?

We can see that our journey to $0 was not an easy one. During the early days of the options life, the stock nosedived. This led to a subsequent rise in the price of our short put. 

We can see that at one point, our short put option was trading at $3.82! That’s more than TWICE what we sold it for! In other words (for a short time) we were losing more than we could have made on the trade (which is always the credit received on short options).

You must have nerves of steel to sell short options. 

But in the end, the stock rallied, and our option plummeted in price. Good news.

If we bought that option back for around $0.02 cents in the last days of trading, that would give us a profit of (1.75 – 0.2) $1.73, or $173 in premium. That’s a nice trade.

ATVI Share Price: $67 —-> $72.59

Expiration: May (2 Weeks Away)

Strike: 65 Put

Option Price: $1.75-—> $0.02

Thoughts on Holding Short Options Through Expiration

Now we could have just let that put expire worthless and collect the FULL $1.75 in premium, but that involves more risk. Who knows what the stock will do in its final days/hours of trading. Trade smart!

Great! Now you have learned the 4 basic options trades. You did it!

Implied Volatility Introduction

Implied volatility. Two of the most dreaded words in the option traders education!

But don’t be intimated. It’s not that complicated, I promise. 

If you want to trade options successfully, you must understand implied volatility. Period. That’s all there is to it. Let’s look at the definition, then understand what that definition means. 

Implied Volatility: A metric that represents the expected volatility of a stock over the life of the option.

Let’s break implied volatility down.

Implied: “Expected”.

Volatility: Magnitude of Stock Price Changes. 

So implied volatility (IV) is therefore simply the expected magnitude of stock price change. 

So what is it exactly that “implies” the expected move of a stock? Options! You can use options to your advantage even if you don’t want to trade them. They give you a window into the stability of a stock. 

Implied Volatility Example: Comparing Two Stocks

The first stock we are going to look at is Visa (V). 

Implied Volatility Example #1: Visa

Here are the details of our trade.

V Share Price: $179.09

Expiration: Jun 19

Strike: 180 Call

Option Price: $7.35

Since our call strike price is higher than the current stock price, we are dealing with an out-of-the-money call.

Therefore, that $7.35 in option premium is entirely extrinsic value

OK. Let’s load up the data on our second trade. (IV is understood best by comparison).

Implied Volatility Example #2: TDOC

TDOC Share Price: $178.96

Expiration: Jun 19

Strike: 180 Call

Option Price: $15.34

So both of these options (V and TDOC) are out-of-the money. Additionally, the strike price is the same. On top of that, the stock price is also about the same.

So why is there such a HUGE difference in premium?

The 180 V calls are trading at $7.35; the 180 TDOC calls are trading at $15.45.

The answer lay in implied volatility (IV). The IV for TDOC is much higher than that of V. The market is expecting TDOC shares to move more than V shares. It’s that simple. 

So why is this? Why would the market think this? Let’s look at their respective historic share prices to understand. 

Comparing Visa (V) and Teladoc (TDOC) Stocks: High-Low

Take a minute to compare the two stocks below. 

The above image compares the high-low trading range of TDOC to V. 

We can see that TDOC trades at a much wider range than V. For example, on May 14th, the high-low range on V was $6; on this same day, the high-low range on TDOC was over $13.

The “observed” volatility is thus greater in TDOC. 

In summary, if two stocks are trading at the same price and the premiums for the options at a particular strike price are greater for one of these stocks, that stock has a greater IV.

If you’d like to learn more about implied volatility, please watch our below video. This is important stuff folks!

Implied Volatility for Beginners

Next up is an overview of the exercisement/assignment process. Don’t worry, the hard stuff is now behind you!

Exercise & Assignment Explained

We touched on exercise & assignment earlier. Let’s now take a closer look at how options can in theory be settled. 

Frankly, you probably won’t need to worry about exercise and assignment much, but understanding the mechanics of this process is integral to your options trading education. Short call and put options are rarely assigned.

Long Option Traders Have the Right to Exercise

When you have purchased options, you can exercise them, which converts the contracts into stock (100 shares/option).

Exercise a Call You Own: Buy 100 Shares at the Call’s Strike Price.

Exercise a Put You Own: Sell 100 Shares at the Put’s Strike Price.

As we discussed, the value of this ability is why options become more or less valuable as the price changes, time passes or expectancy volatility changes. 

That covers the “exercise” portion, which the owners of call and put options have the right to do. 

But what about the “assignment” process?

Short Option Traders Get Assigned

If you decide to exercise your long options, doesn’t somebody have to give you those shares? That’s where assignment comes into play; short options sellers can only ever be assigned, they don’t have the right to exercise. 

When an option gets exercised, the trader who is short that option gets assigned, which is called options assignment. 

Short Call Trader Assigned: Assigned -100 Shares at the strike price.

Short Put Trader Assigned: Assigned +100 shares at the put’s strike price. 

When assigned on your short option, your options position is converted into the corresponding share position as described above. 

So what are the ways this process happens? Let’s look at that next.

Expiration and Automatic Exercise/Assignment

At expiration, any long options position that is in the money by one penny or more will typically be automatically exercised.

Long Option Assignment/Exercise

Let’s say you own a $105 call and the stock closes at $105.01. On expiration day, there is a good chance that the long call option is “automatically” exercised by your broker, thus converting that call into 100 long shares.

If you own a $110 put and the stock closes at $109.99 on expiration, there is an equally good chance your long put will be automatically exercised and you will automatically short the stock at $110.

This is done automatically by your broker.

Short Assignment/Exercise

So we looked at how long options can get automatically exercised; guess what happens to the trader who is short that very option you just exercised?

If you are short a $105 call and the stock closes at $105.01 on expiration day, there is a good chance that your short call option is automatically assigned by your broker, thus converting that call into 100 short shares. 

If you are short a $110 put and the stock closes at $109.99 on expiration, there is an equally good chance your short put will be automatically assigned and you will automatically buy the stock at $110.

Again, this is automated by your broker. 

Why? 

There is intrinsic value in these options, and if you don’t exercise them, you will forfeit this value. Your broker is looking out for you!

But remember, stock sometimes costs A LOT more than the option on that stock (just think how much 100 shares of AMZN would cost you!). So make sure you have the funds to hold those shares, or your broker will automatically liquidate them.

You won’t see the stock in your account until Saturday sometimes if it’s a Friday expiration, but you’ll definitely have the shares by market open the following day.  

This is why it is highly recommended to trade out of in-the-money options (long or short) before expiration.

Why Options Are Rarely Exercised Before Expiration

But what about “early” exercises and assignments? Long options can be exercised at any time; you don’t have to wait until expiration. Should shorts be worried?

This is a very common fear of new options traders. Here’s why you shouldn’t worry. 

Any extrinsic value that exists in an option will be lost when exercising it. In other words, if you are assigned on a short option position with extrinsic value, that’s free money to you!

Let’s see why next in the below generic trade example.

Stock Price: $105

Option: Long 100 call

Call Price: $10 ($500 Intrinsic Value; $500 Extrinsic value

If you exercise this option, you will buy 100 shares of stock at $100. But the stock price is at $105. This means you buy a $10,500 position for $10,000 (a $500 gain).

Nice gain, but you just gave up that extra $500 you could have got from the option’s extrinsic value! You could have made $1,000 had you simply sold the option as opposed to exercising it. 

If you were short this very call, wouldn’t you want the long party to exercise then! You betcha. 

This is why early assignment is rarely an issue.

Which Options to Trade? Consider Liquidity

So what stock should you be trading options on? Not all stocks. In truth, probably not MOST stock’s. 

Why?

Something called liquidity.

The more market participants you have, the greater liquidity you will have. Think of it this way. Let’s say you have tickets to some esoteric punk band that nobody’s ever heard of. Will it be harder selling these tickets when compared to, say, U2 performing at Wrigley Field? The U2 concert will probably have tighter markets, meaning you won’t have to sacrifice much of your initial purchase price when you sell the tickets. 

So how do you find options markets that have many participants?

As a general rule, stick to stocks that have a daily trading volume in the millions. In addition to the liquidity of the stock, we need to look at the liquidity of the options themselves. This can be done in three ways.

Open interest indicates the total number of option contracts that are currently in existence for a particular contract. You want to make sure you’re not the only party long a particular option!

The bid-ask spread is the amount by which the ask price exceeds the bid price for an option in the market.

If an option is bid at 1.40 and offered at 2.50, you’ll probably realize a loss right away. Why? You won’t be able to sell it anywhere near the offer price. You want TIGHT MARKETS when trading options. 

The SPDR S&P 500 ETF Trust (SPY) has the greatest liquidity in the world, and many times SPY options are only a penny wide. 

Lastly, you want to look at the volume of that particular option your trading. Option volume is the total number of option contracts bought and sold for the day, for a specific option.  

If a contract has traded 2 contracts all day, that isn’t a good sign. This is a subjective process, but you definitely want a decent amount of volume.

All of these three metrics can be found on the tastyworks trading software.

Stock with Great Liquidity

Here are a few stocks and ETFs (exchange-traded funds) with fantastic liquidity:

Index ETFs: SPY, IWM, QQQ 

Equities: AAPL, AMD, C, INTC, TSLA, FB, NFLX (Companies)

Index Options: SPX, VIX, NDX

Final Word

Phew. You made it! Congrats! That was a lot of information. Let’s recap quickly some of the key points we went over, starting with calls vs puts. 

Lastly, let’s fly over some of the more important information in a few bullets, then you’ll be done!

We will leave you on this final note. When starting off in options trading, it is important to trade small. Trade small, lose small!

Chances are, you have some additional questions. If we can’t help you directly, please feel free to reach out to the folks at Tastyworks. They are the best in the business!

Happy trading!

Recommended Reading

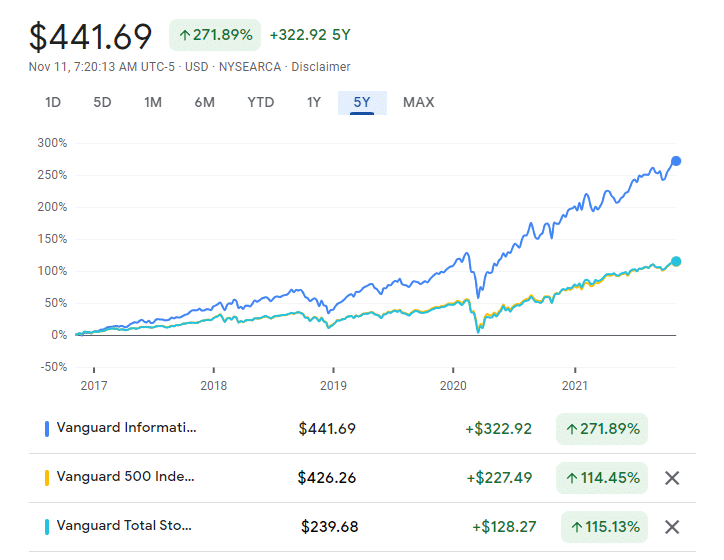
VTI vs VOO vs VGT: Here’s How They Differ

Vanguard ETF Comparison

VTI VOO VGT
Issuer:
Vanguard
Vanguard
Vanguard

Index:

CRSP US Total Market Index
S&P 500 Index
MSCI US Investable Market Index IT 25/50
Category:
Large Blend
Large Blend
Technology
Dividend Yield (30 day SEC):
1.15%
1.23%
0.58%
Expense Ratio (fees):
0.03%
0.03%
0.10%
Number of Stocks:
4,025
510
342
10 Year Return:
16.09%
16.17%
22.61%
Growth of 10k Over 10 Years:
$44,462
$44,783
$76,853
Risk (out of 5)
4
4
5

Data from Vanguard

Jack Bogle (founder of Vanguard) once said, “The greatest enemies of the equity investor are Expenses and Emotions.”

Vanguard set out to create funds that 1) were cheap and 2) took the emotion out of the equation.

And boy, were they successful! Vanguard currently offers more than 80 funds in the exchange-traded fund (ETF) space alone. Today, we’re going to compare three of Vanguard’s more popular “emotionless” index-tracking ETFs.

   Highlights

  • Vanguard’s VTI ETF tracks just about all market sectors and capitalizations in the US.

  • Vanguard’s VOO ETF tracks the S&P 500 Index. This index covers 80% of the market cap in the public space.

  • Vanguard’s VGT is a more niche fund, condensing its equities across the Information Technology space.

  • Over the past 10-years, the performance of VGT has far surpassed the performance of VTI and VOO; however, the risks with this ETF are greater.

VTI vs VOO vs VGT: Comparing Benchmarks

The first (and most important) difference between our three ETFs lay in the different indexes they represent and attempt (quite successfully) to track.

Most everyone has heard of the S&P 500 Index, which VOO tracks; but what is VTI’s underlying index, the CRSP US Total Market Index, all about?

Additionally, what about VGT’s MSCI US IMI Information Technology 25/50 Index? What the heck does that mean?

Let’s figure it out!

VTI: CRSP US Total Market Index

As stated in the fund’s prospectus, the ambitious aim of the Vanguard Total Stock Market ETF (VTI) is to track “the performance of a benchmark index that measures the investment return of the overall stock market.”.

So how, exactly, does Vanguard go about this? By composing an ETF that seeks to track the performance of the CRSP US Total Market Index

CRSP is the acronym for The Center for Research in Security Prices. The CRSP index (under the ticker CRSPTMT) is the brainchild of the CRSP organization, which is affiliated with the University of Chicago Booth School of business. Here’s how they define their index:

Vanguard does a fine job of tracking this immense index, which is why Morningstar gave the fund 4 stars

Vanguard’s VTI contains an impressive portfolio of over 4,000 stocks, mimicking that of the CRSP Index. What differentiates this index from the other ones on our list is its breadth; VTI doesn’t limit its exposure to only large caps (like VOO) or technology stocks (like VGT) but includes equities of all capitalizations classes (small-cap, mid-cap, and large-cap). 

Vanguard’s VTI fund focuses on domestic stocks. If an investor wanted to add international stocks to their portfolio, they could buy the Vanguard Total International Stock ETF (VXUS) and be completely diversified across all equities in existence.

VOO: S&P 500 Index Explained

Vanguard’s VOO ETF seeks to track the performance of the S&P 500 Index. This index is the most followed in the entire world. It has been the benchmark for innumerable funds since its inception in 1926. 

The aim of the S&P 500 Index (maintained by S&P Dow Jones Indices) is to track the performance of the largest 500 publicly listed companies in the United States.

Out of the over 4k publicly listed companies in the US, 500 of these contain 80% of the entire market capitalization. That’s impressive, and probably the reason Warren Buffet so strongly advocates for long-term investors to invest in cheap, S&P 500 Index funds like VOO.

VGT: MSCI US IMI IT 25/50 Index Explained

Vanguard’s VGT fund is information technology-obsessed. As stated from the fund’s prospectus, VGT “seeks to track the performance of a benchmark index that measures the investment return of stocks in the information technology sector.”

So what benchmark does it use? The MSCI US IMI Information Technology 25/50 Index (USD). That’s a mouthful! So what does this mean? Let’s go to the MSCI website to find out.

When you think about information technology, think Microsoft, Apple, NVIDIA, etc. When compared to VTI and VOO, VGT is much narrower in scope, containing only 342 stocks in its fund. However, this narrow breadth does not mean narrower profits; check out the below graph, comparing VGT (blue line) to the other two ETFs on our list over the past five years (which run together), ending in November of 2021.

VTI vs VOO vs VGT

VTI vs VOO vs VGT Chart

Chart from Google Finance

VGT is a great alternative to Invesco’s QQQ ETF, which charges a management of 0.20%, twice that of VGT. Additionally, VGT has been outperforming QQQ in recent years. 

Let’s take a look at our funds’ different expense ratios next!

VTI vs VOO vs VGT: Comparing Fees

All of the expense rations for our three ETFs are incredibly low. 

Bearing in mind that the average ETF fee is about 0.40%, they are all winners. An investor may be remiss to cut VGT out of their portfolio because of its slightly higher expense ratio; when you look at the performance of this ETF (which we touched on above, but will go into detail later), it is my opinion that VGTs meager 0.10% management fee is well earned.

VTI vs VOO v VGT: Sector Diversification

We touch briefly upon the different sectors our ETFs are invested in earlier. Let’s really drive that home now.

The below table shows the top sectors that VTI, VOO, and VGI invest in, respectively.

VTI vs VOO vs VGT: Comparing Top Sectors

Sector VTI VOO VGT
Technology
24.54%
24.65%
89.77%

Financial Services

13.88%
14.09%
8.12%
Health care
13.62%
13.62%
0.00%
Consumer Cyclical
11.81%
12.11%
0.00%
Communication Services
10.51%
11.29%
0.55%
Industrials
9.01%
8.39%
1.57%
Consumer Defensive
5.65%
6.21%
0.00%

Data from Vanguard

VTI vs VOO v VGT: Largest Stock Holdings

So we know the sectors these different ETFs invest in, but what specific stocks do they invest in within these sectors?

The below table lists the largest 7 holdings of each ETF on our list.

VTI vs VOO vs VGT: Top Stock Holdings

Rank VTI VOO VGT
1.
Apple Inc.
Apple Inc.
Apple Inc.

2.

Microsoft Corp.
Microsoft Corp.
Microsoft Corp.
3.
Alphabet Inc.
Alphabet Inc.
NVIDIA Corp.
4.
Amazon.com Inc.
Amazon.com Inc.
Visa Inc.
5.
Facebook Inc.
Facebook Inc.
Mastercard Inc.
6.
Tesla Inc.
Tesla Inc.
PayPal Holdings Inc.
7.
NVIDIA Corp.
NVIDIA Corp.
Adobe Inc.

Data from Vanguard

Notice how VTI and VOO have the same exact top 7 holdings. These ETFs are very similar in nature. Remember, the only difference between them is VTO includes small-cap stocks while VOO focuses only on large caps. 

VTI vs VOO v VGT: Price Performance

Last up, let’s take a look at the historical price performances of our three ETFs.

Average Annual Performance- Quarter End

Duration VTI VOO VGT
1-year
32.04%
29.96%
29.81%
3-year
16.04%
15.95%
26.96%
5-year
16.88%
16.86%
28.63%
10-year
16.61%
16.59%
23.07%

Data from Vanguard

Final Word

It’s impossible to pick a winner when comparing our three ETFs. Why? All of these funds have different risk profiles. In volatile times, VGT tends to decline faster than VTI and VOO, which perform very similarly. However, just the opposite is true in bullish markets. 

In terms of sheer diversification, VTI is the clear winner.

Recommended Reading

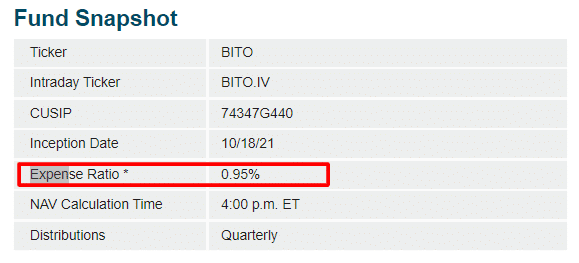
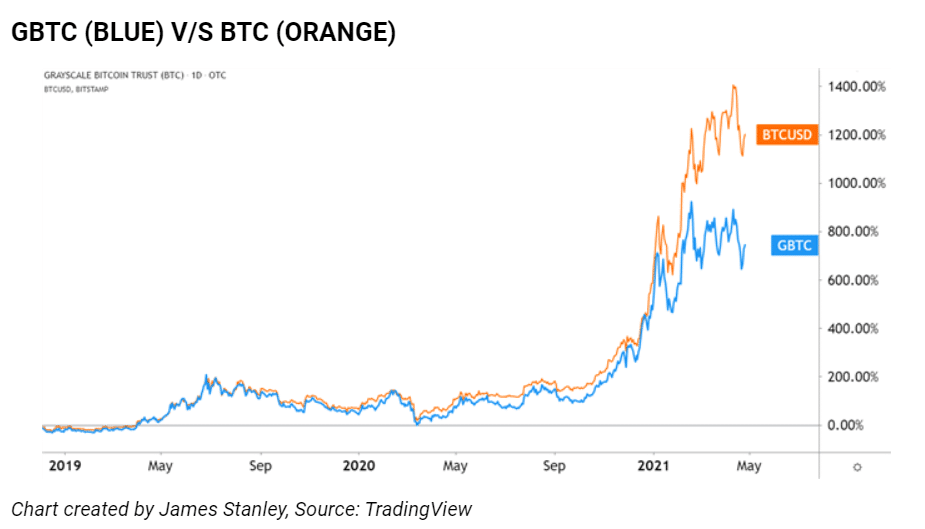
ProShares BITO ETF Explained

Bito ETF Bitcoin

The long-awaited first futures-based bitcoin ETF is about to start trading. 

ProShares will be the first to market with their BITO ETF

Just a few days before this announcement, projectfinance coincidentally wrote an article on the risks of futures-based ETFs. Be sure to check that out for a more in-depth understanding of how these types of funds work. 

Though many investors will surely buy ProShares BITO ETF on the day it begins trading, the savvy investor will do a little research before jumping the gun. 

In this article, projectfinance aims to aid in this research by taking a step back, and examining what, exactly, is inside the ProShares BITO ETF. 

Additionally, we will take a look at a few of the pros and cons that come from ProShares’ “futures-based” methodology to track bitcoin. 

   Highlights

  • A futures-based ETF poses significantly more risks when compared to traditional equity ETFs

  • Contango, futures markets halts and incredibly high expense ratios will eat away at the value of bitcoin ETFs, such as BITO. 

  • A bitcoin ETF will introduce some benefits, such as ease of access, broker SIPC protection and potential backwardation

  • Net-net, investors will probably be better off investing directly in bitcoin rather than the BITO ETF

Introducing BITO: ProShares Bitcoin ETF

Most retail investors are familiar with equity-based ETFs, such as State Street’s S&P 500 ETF, SPY. This ETF invests directly in the stock of the companies which comprise America’s largest 500 companies. The correlation of the SPY ETF is tightly aligned to the S&P 500 index.

The value of ProShares BITO ETF, whoever, is not derived from stocks, nor is it derived from actual bitcoin; it is derived from the value of futures contracts that track bitcoin. 

The below is taken from ProShares BITO “Prospectus”.

ProShares’ approach here will almost inevitably result in inefficiency. However, a futures-based ETF on bitcoin will also offer investors a few advantages when compared to investing in the actual coin.

Spoiler Alert: In my humble opinion, when compared to owning bitcoin outright, the risks of a futures-based bitcoin ETF far outweigh the potential rewards.

Let’s start off by exploring why a futures-based bitcoin ETF may be a disaster in waiting.

Cons of a Futures-Based Bitcoin ETF (BITO)

From a tracking risk perspective, a bitcoin ETF formed from futures products certainly poses numerous risks. Let’s look at a few of these risks now. 

1. Contango in ProShares BITO

Contango and Backwardation Graph

Contango is first here for a reason. In almost all futures-based ETFs (like BITO), the passing of time eats away at the value of the product. Why? 

We mentioned earlier that BITO will not invest in actual cryptocurrency, but futures contracts on the Chicago Mercantile Exchange (CME) that track bitcoin. 

But futures contracts expire. Therefore, to remain invested in bitcoin, ProShares must “roll” their bitcoin futures from one month to the next. 

At the time of this roll, we will receive usually fewer proceeds for the closer, or “front-month” contract than we pay for next month’s contract. This doesn’t happen all the time (more on backwardation later), but it happens most of the time. Some months, the discrepancy in pricing can be quite material. You can see this discrepancy in the image below.

The result? Every month, the ETF will shed a little more value. Perhaps barely perceptible at first, added up over 12 months, you will for sure see this decay in action. And after 12 years? You’ll probably wish you had invested directly in the coin. 

Bitcoin Futures Quotes

CME-Bitcoin Futures Quotes

2. BITO ETF and Futures Market Halts

Bitcoin Halt

Products that trade on futures markets in the US are at risk of being halted. This happens when a product either increases or decreases in value too much over the course of a trading day. 

In May of 2021, the price of bitcoin dropped so much, the Chicago Mercantile Exchange halted trading on bitcoin futures contracts. 

At this time, Canada had already approved 2 bitcoin ETFs (issued by Horizon ETFs). Because of this halt, the issuer was at risk of not being able to honor the days buy and sell orders. 

Bitcoin ultimately rallied and began trading again shortly after the halt, so we’ll never know how bad this situation could have gotten.

This could very well happen in the BITO ETF. Given bitcoins volatility, it seems more a question of when, not if.

3. BITO’s Insanely High Expense Ratio

Let’s talk for a moment about what few are talking about: the painfully high expense ratio of 0.95% that ProShares BITO ETF is charging.

Source: ProShares.com

I couldn’t believe this expense ratio when I saw it. Perhaps I’m spoiled (most of my ETFs at Vanguard charge less than 0.10%), but, in 2021, I would never pay almost 1% for a company to manage my ETF. This is especially true when considering the fact BITO is almost sure to underperform the underlying.

If bitcoin performs half as well as many forecasters believe it will, that almost 1% over the course of thirty years could very well cost you a shiny new car.

When this expense ratio is coupled with the decaying risk of contango, investors should for sure second guess investing in the BITO ETF.

Pros of a Futures-Based Bitcoin ETF (BITO)

There are indeed a few advantages to a bitcoin ETF. For those that like to make lemonade out of lemons, read on. 

1. BITO ETF Offers Better Correlation than Trusts

Up until the release of a bitcoin futures ETF, the only exposure retail investors had to cryptocurrency was either through futures contracts or trusts. Futures entail too much risk for the average investor, and the correlation between cryptocurrency trusts and their representative underlying coin has been undulating wildly. 

Take a look at the below image from TradingView comparing the price performance of Grayscale’s GBTC Trust to Bitcoin.

When compared to cryprocurrency trusts (such as GBTC and ETHE), a bitcoin ETF should provide a better correlation with the coin itself. The futures ETF approach is formulaic and contingent less upon wavering supply/demand, which caused the above miscorrelation.

2. BITO ETF May Benefit from “Backwardation”

We talked earlier about the risks of BITO and “contango”. A possible benefit of BITO would come with an opposite market dynamic: backwardation. This market anomaly occurs when longer-dated bitcoin futures trade below front-month futures contracts. Just remember, this is a RARE event. 

3. BITO ETF Eliminates General Hassle of Owning Bitcoin

Deciding to purchase bitcoin outright can be a lengthy, time-consuming process. If you want to own an actual bitcoin, you must:

1. Choose a crypto exchange

2. Create and set up an account verification method (which may be difficult for older, less technologically savvy investors)

3. Link the account to your bank and deposit funds

4. Trade the actual currency

5. Choose a storage method for the currency (the most time-consuming of all the steps)

6. Track buys/sells for year-end tax reporting

Now compare the above steps to simply queuing a buy order in your trading software for “BITO” and getting a 1099-B  in the mail.

4. Buying BITO through a SIPC Recognized Broker Offers Security

Most futures-based ETFs are purchased through brokers. Many investors using brokerage accounts are protected under the Securities Investor Protection Corporation (SIPC). The SIPC provides financial insurance should your broker fail. Though this insurance does not protect the securities in your account, it will help to cushion the blow should your broker have a liquidity crisis. 

Why is this important? You may remember a now-defunct crypto exchange out of Japan called Mt. Gox. At its zenith, the exchange handled more than 70% of crypto transactions worldwide. In 2011, hackers broke through the exchange’s security and began siphoning out bitcoins from customer accounts. We’re not talking one or two; the hack resulted in a loss of 850k bitcoins, which represented more than 5% of bitcoin in circulation at the time. 

SIPC insurance provides some financial protection to you should your broker fail. The below is taken from the SIPC website:

Mt. Gox did not have SIPC insurance, but chances are, if you purchase BITO through a broker like Tastyworks or Ameritrade, your account is protected (up to the above listed dollar amount).

NOTE: Again, this insurance does not protect the value of BITO; it simply protects against your broker failing. 

Of course, there still is a risk here. When Mt. Gox was hacked, bitcoin tanked by 20%. Can you imagine what would happen to the price of bitcoin today if Coinbase was hacked? A futures-based ETF would plummet right along with the underlying product.

Final Word

For investors who don’t want to spend the time or effort investing in bitcoin directly, futures-based bitcoin ETFs such as ProShares’ BITO is probably the next best option. 

That being said, if in 20 years bitcoin has skyrocketed from its current level, you will likely regret not taking the time to invest in bitcoin the more traditional way. Additionally, you could also invest in a company that invests in bitcoin, such as Microstrategy

With BITO, you will pay a premium that is not, in my opinion, worth it.

Recommended Articles