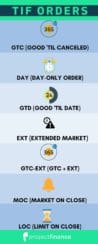
?> February 2022 - projectfinance

Short Strangle Adjustment: Rolling Up the Short Put

Sometimes, you’ll need to make an adjustment to your option positions when the stock price moves against you.

In this post, we’re going to discuss the short strangle adjustment strategy of “rolling up” the short put options.

What is "Rolling an Option?"

Rolling an option is the process of closing an existing option and opening a new option at a different strike price or in a different expiration cycle. This generally happens when in-the-money options are expiring

Today, we’ll focus on “rolling up” the short put option in a short strangle position, which refers to buying back your current put option and “rolling it up” by selling a new put at a higher strike price.

When Do You Roll Up the Put?

Let’s talk about when a trader would most likely roll up the short put.

Consider the following visual:

rolling put option

As we can see, the stock price is rising quickly and approaching the short call’s strike price. Since short strangles have negative gamma, the position’s delta grows negative as the stock price trends towards the short call.

The result?

The trader starts to lose more and more money as the stock price continues to increase.

The most common short strangle adjustment to make in this scenario is to roll up the short put option:

To roll up the short put option, a trader simply has to buy back their current short put option and sell a new put option at a higher strike price (in the same expiration cycle).

What Does Rolling Up the Puts Accomplish?

By rolling up the short put option in a short strangle position, a trader accomplishes two things:

1. Collect more option premium since the new put you sell is more expensive than the put you buy back.

2. Your position’s delta becomes more neutral, which means you’ll lose less money if the stock price continues to increase.

Let’s cover each of these points in more depth.

#1: Collect More Option Premium

Consider a trader who is short the 220 put option in their short strangle position, but rolls the 220 put to the 235 put:

Put Strike Price

Option Price

Delta

Trade

235

$1.60

-0.30

Sell (Open)

230

$0.85

-0.16


225

$0.50

-0.09


220

$0.31

-0.06

Buy (Close)

Since the trader buys back the 220 put for $0.31 and sells the 235 put for $1.60, they collect additional option premium from rolling up the put:

Premium Collected:

$1.60 Collected – $0.31 Paid Out = +$1.29

In dollar terms, the additional $1.29 in premium means the maximum profit on the trade increases by $129 per short strangle, and the upper breakeven point is also extended $1.29 higher.

As a result, the stock price can increase even further than it could before and the trade can still be profitable.

#2: Neutralize Your Position Delta

By rolling up the put option, the position also becomes more neutral.

Let’s say that at the time of the roll, the short strangle’s position delta is -44 (the trader is expected to lose $44 from a $1 increase in the stock price, and make $44 from a $1 decrease in the stock price).

Here’s how the position delta would change after the rolling adjustment from the previous example:

Put Strike Price

Option Price

Delta

Trade

235

$1.60

-0.30

Sell (Open)

220

$0.31

-0.06

Buy (Close)

Old Put Position Delta: +6 (-0.06 Put Delta x $100 Option Multiplier x -1 Contract)

New Put Position Delta: +30 (-0.30 Put Delta x $100 Option Multiplier x -1 Contract)

Change in Position Delta: +24

New Short Strangle Position Delta: -44 + 24 = -20

After rolling up the short put, the position delta becomes more neutral.

With a new position delta of -20, the trader is only expected to lose $20 if the stock price increases by $1, as opposed to a $44 loss before the roll.

Of course, this also means the trader is only expected to gain $20 from a $1 decrease in the share price, as opposed to a $44 gain before the short strangle adjustment.

With that said, it’s clear that it’s not all peachy when it comes to rolling up the short put. Let’s talk about the downsides of rolling up.

What's the Risk of Rolling Up the Put?

While rolling up a short put increases the option premium received (higher maximum profit potential) and neutralizes your position delta, there are some downsides:

1. You decrease the range of maximum profitability, as your new put’s strike price is much closer to the short call’s strike price.

2. The position delta gets neutralized, which means a reversal in the stock price results in less profits than if the rolling adjustment wasn’t made. Even worse, the position delta will start to grow positive if the stock price continues to fall after rolling up the put (resulting in losses if the stock keeps falling).

As with any trade adjustment, there are benefits and downsides. However, if you’re looking for a short strangle adjustment to help reduce the directional risk after a rally in the stock price, then rolling up the short put is one option available to you (pun intended).

Concept Checks

Here are the essential points to remember the short strangle adjustment of rolling up the short puts:


  1. When selling strangles, if the share price appreciates towards your short call, you can adjust the position by “rolling up” the short put (buy back the old short put, sell a new put at a higher strike price).
  2. By rolling up the old put, you increase the amount of option premium collected and neutralize your position delta (resulting in a higher upper breakeven point and less notable losses if the stock price continues to rise).
  3. The downside of rolling is that you decrease the range of maximum profitability since your new put strike is closer to the short call’s strike price. Additionally, you’ll make less money (or potentially lose money) from reversals in the stock price after rolling.
 

Next Lesson

Additional Resources

Chris Butler portrait

Long Call vs Short Put: Comparing Strategies W/ Visuals

Both the long call and short put options strategies are bullish. This is the limit of these option positions similarities. In terms of risk/reward, these two strategies couldn’t be any different. Before we get started, it is important to understand that the long call is not synonymous with the short put options strategy. 

Let’s look at a couple definitions, then get to work!

Long Call Definition: A relatively low-risk bullish options strategy that involves the purchase of a stand-alone call option contract. For American Options, the call owner has the right to exercise their option and purchase 100 shares of long stock at the strike price at any time.

Short Put Definition: A high-risk bullish to neutral options strategy that involves the sale of a put option. For American style options, the seller must stand ready to deliver 100 shares of stock when/if the long party decides to exercise their contract. Short selling options involves great risks. 

      TAKEAWAYS


  • The long call is a low-probability derivative trade with limited risk.

  • The short put is a high-probability derivative trade with limited (but great) risk.

  • Long calls profit when the underlying stock, ETF or index moves up significantly.

  • Short puts profit in both neutral and bullish markets.

  • The maximum loss for long calls is the debit paid; the maximum loss for short puts is strike price – premium.

  • The maximum profit in long call options is unlimited; the maximum profit in the short put is the credit received.
Long Call Short Put

Market Direction

Bullish

Neutral and Bullish

When To Trade

Best for traders very bullish on a security

Best for traders who believe a security will either stay the same or increase in value.

Maximum Profit

Unlimited

Credit received

Maximum Loss

Entire debit paid

Strike price minus the premium received 

Breakeven

 Strike Price + Debit Paid.

Strike price minus the premium received for the put.

Time Decay Effect

As time passes, and both implied volatility and stock price stay the same, a long call will persistently shed value. 

As time passes, and both the implied volatility and stock price stay the same, a short put will shed value - which is desirable for short puts. 

Probability of Success

Low

High

Long Call vs Short Put: Key Differences

Long Call vs Short Put

Before we dig into these two options strategies themselves, let’s take a look at some of the major differences between the long call and the short put:

1.) Long Calls vs Short Puts: Trade Cost

When buying call options, you must may a debit. This debit represents the total loss potential. You can never lose more than you pay. 

Selling a put option is a net-credit transaction. There is no debit paid. Instead, your broker will require you to set funds on the side in margin should that trade go against you and you have to buy the naked put back. When selling options, the margin can be substantial. Opportunity costs must be taken into account. 

2.) Long Calls vs Short Puts: Maximum Profit

When you buy a long call, the upside is unlimited. Why? The stock can (in theory) go to infinity. 

When you sell a put option (or any option), the maximum profit is always the credit received. You will never make more than the credit you take in initially.

3.) Long Calls vs Short Puts: Maximum Loss

For long call options, the maximum loss is always the initial debit paid. It doesn’t matter how much the stock moves against you, with long options, you can only ever lose the amount paid to purchase the option.

For short put options, the maximum loss is calculated Strike Price – Premium Received. If you sell an option at the 100 strike price for $1, you can, in theory, lose $99. This assumes the worst case scenario, with the price of the underlying security falling to $0 in value.

Note! Selling naked call options comes with unlimited risk. Learn more about short naked call options here

4.) Long Calls vs Short Puts: Breakeven

➥ The long call breakeven is Strike Price +  Debit Paid.

 The short put breakeven is Strike Price – Premium Received.

5.) Long Calls vs Short Puts: When to Trade?

Long calls are best suited for bullish investors who believe the underlying is going to the moon. If the stock goes up just a little or stays the same, you’re going to lose your entire premium and incur a 100% loss.
 
Short Puts are reserved for traders who believe a stock is not going to move by very much over the duration of an options life. Many investors use this strategy as a means to generate income. Read more on this strategy in our article, “Selling Put Options for Income“.
 

Long Call Option Explained

Long Call

The long call is reserved for the most bullish of investors. 

Not only does this strategy require the stock to move up to make money, but it must move up by a lot

Because of the Greek theta, options perpetually shed value. In a stagnating market, this is bad news for long calls.  Let’s jump right into a hypothetical example to understand how this Greek works against long options.


Long Call: Losing Trade Example

Here is our long position: a call on Meta Platforms (FB):

Position

➥ Option: Long FB 200 Call

➥ Option Premium: $5.40

➥ Days to Expiration (DTE): 8

➥ Stock Price: 190

So let’s say we are long the above call. Two days have passed, and the stock price is unchanged. What does this mean for our position?

Position

➥ Option: Long FB 200 Call

➥ Option Premium: $5.40 —> 4.50

➥ Days to Expiration (DTE): 8 —> 6

➥ Stock Price: 190 —> 190

So, as we can see, with the passage of two days (assuming both implied volatility and stock price remain the same) our option loses value. 

Time is the enemy of all long call and put options! As time passes and the stock remains the same, the odds of it reaching our strike price dims. Therefore, the option falls in value.

But long calls also have great upside potential. Let’s take a look at a winning trade next.

Long Call: Wining Trade Example

Position

➥ Option: Long AAPL 165 Call

➥ Option Premium: $1.30

➥ Days to Expiration (DTE): 8

➥ Stock Price: 160

So we have purchased a call option on AAPL for a cost of $1.30 (which actually costs us $130 remembering the multiplier effect of option leverage).

Two days have passed, and the price of AAPL has skyrocket:

Position

➥ Option: Long AAPL 165 Call

➥ Option Premium: $1.30 —> $4

➥ Days to Expiration (DTE): 8 —> 6

➥ Stock Price: 160 —> 165

In this example, our option price has increased in value by more than 100%. When you buy an option, the most you can ever lose is the premium paid.

The upside for long calls is unlimited. Why? There is no cap on how high the stock can go. 

From a sheer risk/reward standpoint, long calls make sense. However, their probability of success pales in comparison to the short put option. 

Short Put Option Explained

Short Put Option Graph

Unlike the long call option, the short put option can profit in almost any market. Short puts always profit in neutral and bullish markets, and can sometimes even profit in minorly bearish markets!

When compared to stock positions, long options are decaying assets. Time is kryptonite for long options. 

So if the effect of time decay is negative for long options, shouldn’t it be positive for short options? Yes!

Most professional traders sell options for this reason. Although these high-probability trades come not without risks!

Short Put: Losing Trade Example

Let’s jump right into an example with a short put ETF option on SPY (an S&P 500 index tracker).

Position

➥ Option: Short SPY 415 Put

➥ Option Premium: $2.75

➥ Days to Expiration (DTE): 4

➥ Stock Price: $423

So we have sold a put option here at the market price of 2.75. As long as SPY closes above our short strike price of $415, we will collect our full premium of $2.75 ($275).

The stock can even fall to $415 and we will still make our full profit potential!

Let’s skip ahead a 2 days and see how our short put option did:

Position

➥ Option: Short SPY 415 Put

➥ Option Premium: $2.75 —> $8

➥ Days to Expiration (DTE): 4—> 2

➥ Stock Price: $423 —> $414

So that trade didn’t work out too well! Although the short put strategy has a high probability of success, when naked options move against you, watch out!

The most we could have ever made on this trade was the credit received of $2.75. With two days to the expiration date (expiry), SPY tanked, and our short put option is currently trading at $8. We have lost $5.25 in a scenario where our max profit was $2.75. Not the best risk/reward profile!

Short Put: Winning Trade Example

For this trade, we are going to sell a put option on Tesla (TSLA)

Position

➥ Option: Short TSLA 710 Put

➥ Option Premium: $26

➥ Days to Expiration (DTE): 14

➥ Stock Price: $764

So since we are selling an option, the most we can ever make is the credit received, In this scenario, that will occur when the stock is trading at or above $710 on expiration (our short strike price). 

Let’s fast-forward to expiration day now:

➥ Option: Short TSLA 710 Put

➥ Option Premium: $26 —> $0

➥ Days to Expiration (DTE): 14 —>0

➥ Stock Price: $764 —>$750

So in this example, the stock fell from $764 to $750. Since we are short a put option, you may think that is bad. But we are short the 710 put strike! The stock is trading way above this level. On expiration day, our option is safely out-of-the-money and we will collect the full premium.

This example just goes to show that short put options can profit in all market directions.    

Short Puts Margin Requirement

Determining the margin requirements for selling put options will depend on your account type.
 
Selling puts in a cash account (cash-covered puts) costs more in margin than selling puts in a margin account. You must front the full potential maximum loss of the trade in cash accounts when selling put options. 
 
According to tastyworks, the margin requirement for selling naked puts in a margin account is the greatest of:

  • 20% of the underlying price minus the out of money amount plus the option premium

  • 10% of the strike price plus the option
    premium

  • $2.50

Trading options come with great risks. To learn more about these risks, please read this article from the OCC

Long Call vs Short Put FAQs

A short call is very different from a long put. Both strategies profit in bearish markets, but the short call has considerably more risk than the long put. 

When you sell a put option, your broker will require funds be held in “margin” should that trade move against you. With short puts, the risk is significant. 

Shorting a put option is simple – instead of clicking on the ask price in the option chain, simply click on the bid price and send the order. It is best to avoid market orders in options; limit orders are the better alternative. 

A short call is a high probability trade with unlimited risk; a long put is a low probability trade with limited risk. 

Long Call vs Short Put Video

Long Call

Short Put

Next Lesson

Additional Resources

What Are Seasonal Stocks? ETFs and Shares for Every Season

Many businesses rely on one season for the majority of their earnings. These companies are often referred to as “seasonal”. But just because a company makes the majority of its money in a single season does not necessarily mean its stock will outperform during this time period. 

When it comes to seasonal stock, a lot of the upside is already cooked into the stock price. But, nevertheless, there has been data out there which shows that with some companies, their stock does tend to perform the best during their zenith earnings season. 

For example, in winter, natural gas producers may see an increase in profit if a particularly cold winter hits. 

Additionally, cruise lines like NCLH (Norwegian Cruise Line Holdings) tend to move the most during spring and summer. That is especially true now with covid restrictions easing.  

Let’s take a closer look at seasonal stocks, starting with an ETF that will do the investing for us!

Seasonal Stock ETF

Over the long run, stock pickers have a pretty bad record. Diversification almost always wins. With that said, let’s first take a look at a seasonal stock ETF that diversifies its picks across numerous companies. 

1.) SZNE: Pacer Rotation ETF Strategy

  • Company: Pacer ETFs
  • Ticker: SZNE
  • Expense Ratio: 0.60%
  • Number of Securities: 237
  • 3 Year Return: 21.13%

Pacer’s SZNE ETF “rotates between sectors in the spring and fall to give investors exposure to sectors that have historically performed better during these periods.”

Pacer rotates between six different sectors depending on the time of the year. The below visual, from Pacer ETFs, shows the flow of the stocks within the SZNE ETF as the season progress:

pacer szne etf
Image from paceretfs.com

Summer Seasonal Stocks

Some stocks can perform better during the summer months. Here are a few that have historically done well in their best season:

  • Pool: Pool Corp
  • HD: Home Depot
  • DIS: Walt Disney Corp.

On the tail of Covid-19, both HD and POOL have performed superfluously well. 

Fall Seasonal Stocks

Fall can sometimes be a hangover in the market from robust summers. During this season, consumer staple stocks, such as Kroger, tend to perform very well. 

  • KR: Kroger Co
  • DLTR: Dollar Tree
  • DAL: Delta Airlines

Winter Seasonal Stocks

Energy stocks that deal in natural gas often see spikes in their share prices during particularly cold winters. Of course, on the flip side, they may see their share prices decline during more mild winters.

  • KMI: Kinter Morgan
  • EQT: EQT Corporation
  • RDS: Royal Dutch Shell

Spring Seasonal Stocks

With the coming of spring, many retail customers begin opening their wallets. Spring vacations boost sales at cruise lines and backyard BBQs and baseball boosts sales at brewers. Here are a few favorite springtime stocks:

  • CCL: Carnival Cruise Lines
  • TAP: Molson Coors Bev.
  • AWAY: Travel Tech ETF

Best and Worst Months for Seasonal Stocks

There is an old saying on Wall Street, “Sell in May and Go Away.”

In the six-month period beginning in May and ending in October, stocks tend to be at their worst.

Volatile seasonal stocks during this period are no exception.

So what are the best months for stocks?

Historically, the best three-month stretch for stocks begins in November.

During bull markets, one would reason to assume that fall and winter seasonal stocks would be trading at elevated levels.

Seasonal Stock FAQ's

Cyclical stocks are affected by macroeconomic changes. For this reason, they are more volatile. Seasonal stocks move the most during particular times of the year.

There are too many seasonal stocks to count. The best way to find seasonal stocks is to look at the products and services in your life that you believe in as the seasons pass. 

Seasonal stocks represent companies that conduct a high percentage of their business within one particular season.

Additional Resources

Continue Learning

Option Chain Explained W/ Visuals and Examples

Options Chain Definition: A matrix displayed on a trading software that shows the vital components of tradable call and put options, such as bid-ask, volume, open interest, and the Greeks. 

The first lesson in any options trader’s education is mastering the option chain. Though this seemingly endless grid of data can be overwhelming at first, when broken down, the option chain can be easily understood.

     TAKEAWAYS

  • An options chain lists all tradable call and put options in a selected security.

  • Vital option chain information includes the option type, expiration, strike price, and bid-ask spread.

  • Adding “volume” and “open interest” to an options chain helps traders understand the liquidity of an option.

  • Option chains can be customized to add the Greeks as well, including delta and theta.

  • An options expiration cycle is listed on the left side of an options chain; an option’s IV (implied volatility) is listed on the right side of an options chain.

What is An Options Chain?

The above image (taken from the tastyworks trading platform) shows the options chain for the Exchange-Traded Fund (ETF) SPY.

We have highlighted the most crucial components of this ETF option chain. These include:

➥ Option Type:

There are only two types of options contracts: calls and puts.

Long call options profit in bullish markets. Long put options profit in bearish markets.

In an options chain, calls are always listed on the left side; put options are listed on the right side. As we can see in the above visual, these two areas are divided by the strike price. 

➥ Option Strike Price

Strike prices are always at the center of an options chain. The strike price is the price at which call and put options are exercised and thus assigned.

If you buy a SPY call option at the 435 strike price, that contract gives you the right to buy 100 shares of SPY stock at $435/share, which the short party must deliver.

➥ Bid-Ask Spread

Just like with stock, there is a bid and ask price for every option. You can sell an option at the bid price and buy an option at the ask price. The tighter the markets, the better the liquidity. 

➥ Expiration

Options are decaying assets. Every single one will eventually expire at some future date. This date can be as early as today, or as far away as 2025. Longer-term options are known as Long-Term Equity Anticipation Securities (LEAPS).

The closer an option is to expiring, the better its liquidity will be.

Customizing Your Options Chain

Most trading platforms offer customers numerous options when it comes to customizing their options chain. In addition to the above basic information, columns can be arranged by:

  • Last (last traded price)
  • Mid (point between bid and ask)
  • Greeks
    • Delta
    • Gamma
    • Vega
    • Theta
  • Impl Vol (Implied Volatility)
  • Open (opening price)
  • Bid Size (contracts bid at shown price)
  • Ask Price (contracts offered at displayed price)
  • High (highest trading price all day)
  • Low (lowest trading price all day)

The above list is by no means exhaustive. The below screenshot from tastyworks shows a few different customizable layout options for their displayed options chains:

So which layout is best for you?

I personally believe that all elements of liquidity should be displayed first and foremost. In addition to the bid-ask spread, volume and open interest are vital in determining the liquidity of an option.

Markets with poor liquidity measures can result in horrible fills. You want high volume/open interest as well as tight bid-ask spreads.

The below image shows how I prefer to layout my options chains:

Option Chain and Expiration

An options expiration date is always displayed on the far left side of an options chain:

options chain expiration

The further down the option chain you go, the less liquidity you are exposed to. Most people prefer to trade options with 0-60 days to expiration (DTE). 

Some options trading strategies, such as the calendar spread, include more than one expiration cycle. 

Option Chain and Implied Volatility (IV)

If we skip over to the far right side of the options chain, we will see Implied Volatility (IV):

In options trading, implied volatility (IV) is of utmost importance. This number tells us the expected volatility of a stock over an options life. 

The higher the IV, the higher the option premiums will be. Option sellers are particularly drawn to high IV levels, as this means higher premiums can be collected. 

IV levels are generally highest for front-month options and fall for long-term options, as seen in the image above. 

Option Chain and The Greeks

In options trading, the Greeks are a series of calculations used by traders to measure various factors that affect an options price. The Greeks include.:

  • Delta (how much an option moves in response to a $1 change in underlying)
  • Gamma (the rate at which the delta changes in response to a $1 change in the underlying)
  • Theta (the rate at which an option decays with 1 passing day in a constant environment)
  • Vega (the change in an option’s price in response to a one-point change in implied volatility)

If you’re new to the Greeks, our article, “The Greeks for Beginners” is a great starting point. Pros use the Greeks daily.

You can set up your options chain to include these measures as well. 

Option Chain and Moneyness

The last segment in our option chain tutorial is option moneyness

All options reside in one of three moneyness states:

  • In-The-Money
  • At-The-Money
  • Out-Of-The-Money

Moneyness simply tells us whether or not an option has “intrinsic value“. Intrinsic value exists when an option has value on its own, discounting time and implied volatility. To read more about this topic, check our “Intrinsic vs Extrinsic Value” article.

Most options chains have a line dividing in-the-money options from out-of-the-money options. On the tastyworks platform, this line is displayed in the option chain as an orange line:

Option Chain FAQs

In an options chain, IV stands for “Implied Volatility”. IV tells us the forecasted move of a stock over the life of an option.

In an options chain, volume indicates the number of contracts that have been traded in a given day for a particular call or put option. 

An options chain indicates all of the listed call and put options for a given security. Information about liquidity and the Greeks are displayed in an options chain. 

As long as you have live quotes, option chains are updated in real-time.

Next Lesson

Additional Resources

Market Order in Options: Don’t Throw Away Money!

Market Order Options

Marker Order Definition: A market order is an order to buy or sell a security at the immediate and best available price. Fill price is unknown in market orders.

Market orders are the enemy of all options traders. Why? Because you have no idea the price at which you will get filled. 

In the above definition, we can see that market orders are filled at the immediate and best price. However, due to the notorious illiquidity of call and put options, that “best” price can be very poor indeed. 

Let’s find out why!

        TAKEAWAYS

  • Market orders guarantee a trade will get filled, but the price at which that trade will be filled is unknown.

  • Stop-loss orders are simply market orders waiting to get triggered.

  • An options volume tells us how many contracts have traded all day; an options open interest tells us how many options are in existence. 

  • The bid-ask spread of an option is the difference between its bid price and ask price. 

  • The above two components of liquidity are vital for getting decent fills. Market orders in options with poor liquidity can result in horrible fill prices. 

  • Limit orders are the best alternative to market orders. 

Market Order in Options Explained

Whenever you place a trade, the order form on your trading software will require some basic information about the trade:

1.) The security you wish to trade.

2.) Whether or not you want to buy or sell that security.

3.) The time and duration you want that order working for (Time In Force “TIF”).

4.) The actual order type.

This article is concerned with the latter on the above list, order types. 

When trading options or stocks (or any security) you must instruct your broker of the type of order you want to place. 

Let’s explore the different order types next!

Order Types in Options Trading

Order types include, but are not limited to:

Limit Order

The “limit” order type tells your broker you want to get filled at or better than your set limit price. 

Stop-Loss Order

The “stop-loss” order is triggered when the set stop price is breached. The order then becomes a market order. 

Stop-Limit Order

The “stop-limit” order is triggered when the stop price is reached. However, unlike the stop-loss order, the stop-limit order triggers a limit order. 

Trailing- Stop Order

The “trailing-stop order” allows a trader to set an upper bound or loss percentage on a trade. This allows a trader to lock in profits or losses in connection with the securities movement. 

Market Order

A market order instructs the broker a customer wants to get filled immediately, regardless of price. 

As we can see above, the stop-loss order is essentially a market order in disguise. Your broker holds stop-loss orders until the price is breached, and then sends the order to market makers. These order types are not visible until they get triggered. 

So why are market orders a bad idea? It’s all about liquidity!

Market Orders In Options and Liquidity

When you’re trading stocks, liquidity is generally not a problem. This is assuming, of course, you’re not trading exotic penny stocks. 

Most stocks have spreads a couple of pennies wide. This means if you want to turn around and sell a stock the moment after you buy it, you will only lose a few pennies. 

With options, liquidity is not so plentiful.

Let’s take AAPL stock for example. Currently, you can buy AAPL for 436.77 and immediately sell it for 436.76. Here’s how that looks on the tastyworks software:

So why is there such great liquidity in AAPL stock? Because there is only one tradable equity! What you can’t see is the order size; there are about 10k shares of stock bid at 436.76 and 11k shares offered at 436.77. Using a market order probably won’t harm you here. 

But there are thousands of options that trade on AAPL. Every one of these options requires its own market. Since there aren’t as many players, that spread can widen out considerably. 

This can lead to wide markets and low volume/open interest. This is bad news for market orders! Let’s examine both of these next, as they are the crucial components of options trading liquidity. 

Volume and Open Interest in Options Trading

The first two components of option liquidity are open interest and volume.

Option Open Interest: The open interest of a particular option refers to how many contracts are currently in existence. The higher the open interest, the greater the liquidity. 

Option Volume: The volume of an option refers to how many contracts have been traded on a specific day. 

Bid-Ask Spread in Options Trading

The next component of the liquidity of an option is the bid-ask spread.

Option Bid-Ask Spread: The difference between the bid price and the ask price.

This market essentially tells us what we can buy an option for, then immediately sell it for. If markets are wide, you’re going to start off with a huge loss right off the bat!

Additionally, you want to make sure the bid and ask size is appropriate. Sometimes, there is only one option bid at a certain price. If you are trying to sell more than one option, the next bid may be a dollar or more below the current bid!

These are known as thin markets. The bid-ask spread can be deceiving!

Let’s take a look at a couple of examples now. 

Option Liquidity Example: High Liquidity

The below image is taken from the tastyworks software. It shows the volume/open interest and bid-ask spreads for call options on SPY options. SPY (an S&P 500 tracking ETF) is the most liquid ETF in the world.

SPY Call Options

spy liquidity

The volume and open interest for these ETF options are mostly in the thousands. Additionally, the bid-ask spread is only a few pennies wide. 

If you use a market order (or stop-loss) on these options, you’ll probably be OK. 

But still – why risk it? Use a limit order!

Option Liquidity Example: Low Liquidity

The below image (taken from the tastyworks software) shows the option markets on a few call options for stock symbol R (Ryder Systems).

R stock liquidity

The above options are incredibly illiquid. Never trade options like these. The volume is almost non-existent. The open interest is shameful. And you can park a truck between the bid-ask spread. 

What you can’t see is the size of these markets. Guess what? The size is as thin as paper on a lot of these options. 

Placing a market order on these options may cost you an arm and a leg.

The solution? Don’t trade this security! If you must, use a limit order, and work that limit order up in nickel increments until you get filled. 

Final Word: Market Orders on Options

I have personally never used a market order to enter or exit an options trade. 

I have, however, used market orders under the instructions of advisors. I have sold options for 0.10 only to see them bid at 0.75 a minute later. 

In particular, stop-loss orders on the open can result in abysmal fills. 

At the end of the day, just use limit orders. It’s that simple. If you can’t be around to monitor your trades, don’t trade

FAQs: Market Orders on Options

If you’re trading liquid products, market orders can be relatively safe. When you’re trading illiquid products (or trading around the open/close) market orders pose significant risks. 

Market orders are filled at any price immediately; limit orders are filled when the security trades at the limit price. Limit orders are not always filled.

The “market” order type communicates to your broker you want to get filled immediately, regardless of execution price. 

Market orders with the “Day” TIF designation get filled immediately. Market orders with the “EXT” designation get filled immediately in the extended hours market. 

If you place a market order and the market is open, you will get filled immediately. Therefore, expiration does not apply to market orders. 

Next Lesson:

Video: Option Order Types

TIF Orders Types Explained: DAY, GTC, GTD, EXT, GTC-EXT, MOC, LOC

When trading stocks, options, and futures, brokers generally offer investors several different Time if Force (TIF) options to choose from. 

In addition to determining the order type (market, stop-loss, limit), traders must also specify to their broker the time and duration they want that order working. This is known as TIF order designation.

The most popular TIF order types are DAY orders (good for the day only) and GTC orders (good til cancelled). But there are so many more! EXT, MOC and LOC are a few.

Knowing the differences between these order types can be vital to get filled. Here’s what each one means. 

      TAKEAWAYS


  • The TIF order designation communicates to a broker the time and duration for an order to be working.

  • All orders default to “DAY”.

  • GTC (good til canceled) orders generally remain working for 90 days, or until the order is filled or canceled by the customer.

  • EXT (extended-market) orders ONLY work outside market hours.

  • Most brokers work EXT orders from 7 AM to 8 PM, though the formal NYSE Extended Market Hours extends these bounds.

  • When compared to MOC (market on close) orders, LOC (limit on close) orders can guarantee fill price, but not fill execution.

DAY Order Explained

day order tastyworks

DAY Order Definition: The TIF label DAY instructs a broker that a trade will only stay working during the current (or upcoming) market day. DAY orders are canceled after the market close.

  • DAY orders are only working during market hours.

  • If sent after the closing bell, a DAY order will be working for the following trading day.

  • All DAY orders are canceled at the closing bell. 

For just about all brokers, the “DAY” order is the default TIF order type. This simply means that the order is working for the day only.

If you send a day order before the market opens, that order will only be activated with the opening bell. Not before. If you want to work an order outside market hours, you’ll want to tag it EXT (Extended Market).

If you send a day order 5 minutes before the closing bell, that order will only be working for 5 minutes. 

Day orders apply to the current trading day. Not the day after. Therefore, if you submit a day order directly after the market closes, that order will be active for the next trading day. 

GTC (Good Til Cancelled) Order Explained

GTC order tastyworks

GTC (Good Til Cancelled) Order Definition: A GTC order is an order placed by an investor to either buy or sell a security that stays working until the order is filled or canceled by the customer (or broker).

  • GTC (Good Til Cancelled) orders remain working in the customer account until the customer cancels the order.

  • GTC orders do not work in the extended market.

  • Best practice is to periodically check and make sure the order is working, as brokers sometimes cancel GTC orders in error. Some brokers cancel these orders after 90 days.

  • Best for long-term traders who don’t monitor the market.

The GTC (Good Til Cancelled) order is the second most popular type of TIF order. This designation communicates to the broker that an order should stay working indefinitely, or until filled.

Sometimes, brokers cancel GTC orders without communicating this information to clients. This can happen either due to back-end issues, or simply because the GTC order was working for too long. 

For set-it-and-forget-it traders, it is wise to periodically check to make sure GTC orders are still working. 

GTD (Good Til Date) Order Explained

GTD order TIF type

GTD (Good Til Date) Order Definition: A GTD order type instructs a broker that a buy or sell order stays working until a specified date is reached. If the order is not filled by this date, it will be canceled.

  • GTD (Good Til Date) orders remain working in the customer account until the order is filled, canceled, or the pre-determined date is reached.

  • The GTD order type can help investors navigate volatile times (such as earnings) without having to monitor their accounts.

  • Best for long-term traders who don’t monitor the market closely.

The GTD (Good Til Date) is a great TIF order for investors who don’t have the ability to closely monitor their accounts. 

Let’s say you’re long FB stock, which is due to report earnings next week. If you’re not able to check your account on this day, you can tag a sell-stop order with the GTD tag to cancel your order on the day before earnings are released. This will allow you to stay in the stock during the volatile post-earning swings.

EXT (Extended-Market) Order Explained

EXT extended market order type

EXT (Extended Market) Order Definition: A EXT (Extended-Market) order instructs your broker that you want an order working in the extended market; this order will NOT be working during the normal trading hours. 

  • The EXT (extended market) tag designation instructs a broker that a buy or sell order is only to remain working in the extended market.

  • Many brokers allow EXT trading from 7 A.M. until 8 P.M. (not counting market hours). However, the NYSE extended market hours are technically between 4:00 A.M. TO 9:30 A.M. ET and 4:00 PM to 8:00 P.M. ET.

  • Trading in extended markets allows traders to capitalize on the large swings that exist in these markets.

  • Unless tagged GTC (Good Til Canceled), EXT TIF orders will only stay working for one session.

Extended markets are notorious for their illiquidity. Bid-ask spreads can widen enormously and stocks can fly. 

However, these swings can also provide investors with great opportunities.  

If you are long Amazon (AMZN) stock that pops $400 in the after-hours market post-earnings, you can sell your stock in the extended market by marking your order EXT. If you’re happy with the gains, why risk waiting another day? 

GTC - EXT (Good Til Cancelled - Extended Market) Order Explained

gtc ext order type

GTC_EXT (Good Til Cancelled Extended Market) Order Definition: A GTC-EXT order instructs a broker that a buy or sell order will remain working in the extended market until the order is filled or cancelled; this order will NOT be working during the normal trading hours. 

  • The GTC-EXT order combines both a GTC order and EXT order.

  • This order type works in the extended market until filled or canceled by the customer (or broker).

  • The GTC-EXT is NOT working during normal stock market hours.

The GTC-EXT order TIF allows a trader to work a stock order in the extended market indefinitely. As we said before, the formal NYSE extended market is between 4:00 A.M. TO 9:30 A.M. ET and 4:00 PM to 8:00 P.M. ET.

However, most brokers only allow trading from 7 A.M. until 8 P.M.

If you’re trading illiquid stocks that have huge market moves in the after-hours market, a GTC-EXT may allow you to take advantage of these moves without interrupting your dinner. 

MOC (Market On Close ) Order Explained

MOC (Market On Close) Order Definition: A “Market-0n-Close” order is a buy or sell order placed with a broker to trade at the market close.

  • Market-On-Close (MOC) orders trade at the very end of the day.

  • These order types allow investors to trade out of positions at day end without having to monitor their accounts.

  • MOC orders in thin markets can result in poor fills.

The MOC (Market On Close) order TIF is a handy tool for day traders. This order type fills buy or sell orders on stocks, options, and futures at the very end of the trading day. 

The order fills as close as possible to a securities final daily trading price

The downside here is liquidity. If you’re trading options or thin stocks, try to avoid market orders at all costs!

But don’t worry – there is an alternative. Let’s read about the limit-on-close order next. 

LOC (Limit On Close ) Order Explained

LOC (Limit On Close) Order Definition: A buy or sell limit order placed with a broker with instructions to activate at the very end of the trading day.

  • Like MOC (Market On Close) orders, a LOC (Limit On Close) order goes live in the final seconds of trading.

  • Unlike MOC orders, the LOC order is not guaranteed to get filled.

  • LOC orders are great for liquid stocks.

A downside of MOC order types lies in the uncertainty of the fill price. 

Limit orders guarantee fill prices. If you’re trading option or thin stock, MOC orders can be dangerous. LOC orders hedge against poor fill prices. 

The downside of LOC orders (when compared to MOC orders) is that they are not guaranteed to get filled. If the order can’t be filled at your limit or better, you will not be filled.

Final Word

That wraps up our lesson on the 7 most popular TIF order types. 

There are indeed many more orders types, but these are rarely offered by brokers. 

When I worked with brokers in the SPX pit, we had AON (All or None) orders as well as FOK (Fill or Kill) orders. 

AON (All or None) orders communicate you want to either get filled on all of the order or none of it. 

FOK (Fill or Kill) orders communicate you want to get filled immediately, or not at all. What a nice acronym that is!

Order Type FAQs

Most GTC (good til cancelled) orders stay working for 90 days, though this varies by broker. 

The vast majority of DAY orders expire at the closing bell. Some options, however, trade until 4:15 PM.

GTC (good til cancelled) orders remain working in a customers account until 1.) the trade is filled or 2.) the customer or broker cancel the order.

DAY orders only remain working for ONE trading day. 

A LOC order activates a limit order at the very end of the trading day; a MOC order activates a market order at the end of the trading day. 

MOC guarantees a fill while LOC guarantees a fill price. 

Video: Option Order Types

Next Lesson

Limit Order in Option Trading Explained w/ Visuals

Option Limit Order

Option Limit Order Definition: In options trading, a limit order is placed by a trader to either buy or sell an option. This order type instructs the market makers that a customer is only willing to accept a fill at or better than the limit price specified.

In options trading, there is only way smart order type used to enter and exit trades: the limit order

Why?

Unlike other order types (stop-loss, trailing stop-loss, and market order), the limit order guarantees you will get filled at or better than the limit price you set. 

Are there downsides to using limit orders? Of course! But at the end of the day, this is the only order type I have ever used when trading options. 

Let’s go in-depth to see why. 

     TAKEAWAYS

  • A limit order placed on an option (or stock) will always get filled at or better than the limit price set.

  • For buy limit orders, you will get filled at or below your set limit order.

  • For sell limit orders, you will get filled at or above your set limit order.

  • Unlike like market and stop-loss orders, limit orders do not guarantee you will get filled.

  • Limit orders are generally used to enter trades and lock in a profit target.

  • The “stop-limit” order combines the stop and limit order and is a smart way to target a downside exit.

Limit Order in Options Explained

Liquidity in Options Trading

Options markets are notoriously illiquid. Why is this? There are too many of them!

If you wanted to trade the SPY ETF, liquidity would not be a problem. But there are thousands of different options on SPY! Fewer market participants mean lower open interest/volume and a wider bid-ask spread.

It is because of this “Market” and “Stop-loss” orders (which are essentially the same) are dangerous. 

Take a look at the below image from the tastyworks platform, which shows the current market for SPY LEAP (long-term) call options. 

SPY Call Options

SPY CALL LIQUIDITY

Let’s look at the 400 call option here. Notice the huge spreads and the low volume/open interest?

The current bid price is 89.50 while the current ask price is 94.50.

If we used a market order to buy this option, we may very well get filled at 94.50. If we wanted to turn around and sell that option immediately, a market order may fill us at the bid of 89.50.

94.50 – 89.50 = 5

That means right off the bat we’re starting with a $500 loss!

Now if we used a limit order instead to buy that option at the mid-point (92), we’d be much better off. Sure we may not get filled, but that’s better than losing $500 dollars!

Option Buy Limit Order Example

limit buy order

There are two primary reasons why a trader would use the buy limit order:

  1. Enter an initial trade.
  2. Place a profit target for a short option(s).

Buy Limit to Enter an Option Trade

As we learned in the SPY example above, the limit order is the best (and perhaps only) way to enter option positions. The buy limit applies to all options strategies, not just single options.

You can use a limit order to enter vertical spreads, iron condors, butterflies and virtually any other type of option spread. 

Let’s take a look at a buy limit on an Apple (AAPL) spread in tastyworks:

AAPL Spread Buy Limit

Spread details:

  1. Bid Price: 1.15
  2. Ask Price: 1.41
  3. Mid Price: 1.28

The above limit order is set up to buy at the mid-price of 1.28. Always try the mid-price first! I get filled at the mid-point about half of the time. You can always work the trade up in nickel intervals if you don’t get filled immediately.

Since we are using a limit order to buy, we know we will never get filled at a price worse than our upper debit limit. 


Buy Limit to Exit an Option Trade

If you sell an option(s), it is wise to have a profit-taking buy-limit order in place. 

Let’s say we are short a put option on Google (GOOGL) and want to buy back that short put option if it falls to a certain price. Here are the details of our open trade.

➥ Short GOOGL 2500 Put @ $3

If we wanted to buy back this put option when it falls to $1 in value (locking in a profit of $2) we would place a buy limit order on the option at $1.

It’s that simple!

Option Sell Limit Order Example

sell Limit Order

Just as with buy limit order, the sell limit order is mostly used in two scenarios:

  1. Enter an initial short trade.
  2. Place a profit target for a long option(s).

Sell Limit to Enter an Option Trade

Just as with stocks, you can both buy and sell options. When you are selling an option(s) to open, you want to receive as much credit as possible for that call or put (or spread).

Let’s say we want to sell a call on Meta Platforms Inc (FB) at the 210 strike price.

FB Short Call Sell Limit

  1. Bid Price: 1.89
  2. Ask Price: 1.94
  3. Mid Price: 1.91

A limit order in this scenario would afford us the opportunity to possibly get filled better than the bid price of 1.89. Here, that mid-price is ≈ 1.91

Sell Limit to Exit an Option Trade

Limit orders are used mostly for this purpose. 

If you buy an option(s), it is wise to have a profit-taking strategy in place. This can be accomplished by placing a Good Til Canceled (GTC) sell limit order. Let’s say we are long a call option in the QQQs:

➥ Long QQQ 350 Call @ $5

Let’s also assume we want to take a profit when that option rises to $7 in value.

Instead of watching that option every moment of every day to reach that level, we can simply put a GTC sell limit order in at $7. 

If the option trades at or above that price we will (mostly likely) get filled. 


Pros and Cons of Limit Orders in Options

There are more pros than cons in limit orders – remember that. Professional traders rarely use stop-loss or market orders on derivatives. It is often throwing money away. With that in mind, here are some advantages and disadvantages of the limit order. 

👍 Limit Order Pros

  1. Guarantees fill price.
  2. Traders are not required to monitor positions.
  3. Protects against illiquid option markets.

👎 Limit Order Cons

  1. Fills are not guaranteed in limit orders; if the market doesn’t trade there, limit orders will not get filled

TIF Order Types

In limit orders, you also need to consider the TIF designation. TIF (time-in-force) orders can be designated in numerous different ways. These communicate to a broker when and for how long a trade should remain working. Some of these include DAY, GTC, GTD, EXT, GTC-EXT, MOC, LOC. Read more about these order types in our article on TIF order types here!

Option Limit Order FAQ's

Limit orders are visible to market makers. This is unlike stop-loss orders, which brokers hold until the price is breached, at which point the order gets sent to the exchanges/marker makers. 

With a limit order, you will only ever get filled at your limit price or better. With a stop-loss order, fill price is unknown.

A stop-loss order is simply a market order waiting to get triggered. See above for the differences. 

This depends on whether or not you have the limit order tagged as “DAY” or “GTC”.

DAY orders are only good for the day, GTC (Good Til Cancelled) orders stay working in your account until you cancel them.

Next Lesson

Stop Limit Order in Options: Examples W/ Visuals

stop limit order options

In options trading, there are five primary types of orders:

  1. Market Order
  2. Limit Order
  3. Stop Order
  4. Stop Limit Order
  5. Trailing Stop Order

In this article, we are going to focus on the stop-limit order.

The stop-limit order combines two of the above option order types: 1. the limit order and 2. the stop order. 

Before we conquer the stop-limit order, we must first have a comprehensive understanding of how stop-loss orders and limit orders work. Since a stop-loss is essentially a market order, we must master that concept too. 

Let’s get started with market orders!

TAKEAWAYS


  • A “market” order instructs your broker to send the order to the market makers to get filled immediately, regardless of price.


  • A “limit” order places either an upper bound (buy order) or lower bound (sell order) on the fill price you are willing to receive.


  • A “stop-limit” order combines the above options orders types and has two components. The “stop” price triggers the order, while the “limit” price tells your broker you will not accept a fill above (buy orders) or below (sell orders) the specified limit price.  

What Is a Market Order in Options?

Market Order

Market Order Definition: An order placed with your broker with instructions to get filled immediately, regardless of price.

In options trading, a “market order” instructs your broker that you want to receive a fill on your option contract(s) immediately.

After your broker receives your order, that trade will get sent out to market makers to get filled (as long as they do not internalize order flow).

In liquid stocks, market orders generally receive decent fills (though I never use market orders myself).

In options trading, market orders can very frequently result in poor fills. 

Why?

Liquidity in options can be horrible. If you’re trading AAPL stock, there’s only one equity product, so volume is high. There are, however, thousands of options markets on AAPL. This is because of the innumerable strike prices and expiration cycles

There are two components of liquidity: Volume/Open Interest and the Bid-Ask Spread:

1. Volume and Open Interest

The volume and open interest of an option tells us how many contracts:

1. Have traded so far that day (volume)

2. Are currently in existence (open interest)

If you send a buy market order on an option that has traded 3 contracts all day and has a total open interest of 10, you’re going to get a bad fill. 

Amazon (AMZN) is known for good liquidity. However, when you look at the markets on options expiring years down the road (LEAP Options), you’ll see how poor the volume and open interest is. Stay away! Or work the order slowly, starting at the “mid-price”.

2. The Bid-Ask Spread

For call and put markets, the Bid-Ask Spread is simply the width of the market. 

In options trading, you want tight markets. Generally, poor volume/open interest goes hand in hand with wide markets. 

Take a look at the Bid-Ask from the AMZN options in the above example. For the 3250 calls, the offer is 524.50 and the bid is 511.15. If we were to buy at the offer and immediately sell at the the bid, we would have lost 13.35 (or $1,335 taking into account the multiplier effect and option leverage). That’s a lot of money!

Because of the above reasons, we can now understand why market orders on options (whether they be placed on a single option, spread, or iron condor) is probably a bad idea. 

If you’re in a situation where you can’t be around to monitor your positions, don’t trade risky options strategies, or don’t trade at all. Market orders are not the solution. After working as an options broker for 15 years, I have seen too many donations to market makers.

What Is a Stop-Loss Order in Options?

stop loss sell

Stop-Loss Order Definition: An order placed with your broker which activates a market order to either buy or sell an option when that option trades at a certain price. 

If you know how market orders work, you already know how stop-loss orders work. 

A stop-loss order in simply a market order in disguise. The price you set your stop-loss at is the point at which that order gets changed to a market order. 

Once your trigger gets hit, your broker sends that order get filled. Market makers only ever see a market order. On illiquid options, avoid stop-loss orders at all costs! 

The stop-limit order, on the other hand, is a different story. We’ll get to that after we go over the limit order. 

What Is a Limit Order in Options?

limit buy order

Limit Order Definition: An order placed with your broker to either buy or sell an option at or better than the predetermined “limit” price you choose. 

When I trade options (and I have traded a lot!), I only ever use limit orders. With limit orders, you don’t have to worry about liquidity – you’re going to get filled at or better than your limit price, no matter what.

Of course the downside here is you may never get filled. I, however, would rather not get filled than get filled poorly. 

If I place an order to buy an AAPL option at 3.10, I will get filled at 3.10 or better. Period. 

What Is a Stop-Limit Order in Options?

stop limit order options

Stop-Limit Order Definition: An order placed with your broker to either buy or sell an option at or better than the “limit” price set. Unlike traditional limit orders, the stop-limit order is only triggered when the stop price is breached.

So we have learned all of that to get to this: the stop-limit order. Like all option order types, you can use the stop-limit to buy or sell. 

Let’s break down the sell stop-limit first. 

Sell Stop Limit Example

Let’s look at this order type through the lens of a trade on tastyworks.

Our Trade:

Long SPY 445 Call at $2.60

So let’s say we want to sell our long SPY ETF option if it falls below 2.25 in value. HOWEVER, we are not willing to accept a fill price worse than 2. Our sell stop-limit order, therefore, has 2 components:

Stop Price: 2.25

Limit Price: 2

So at what price can we expect to get filled? At $2 or better. The stop-limit order can even get filled better than our stop price!

And here’s how this trade looks on tastyworks:

Buy Stop Limit Example

In this example, we are short a call option on Meta Platforms (FB)

Our Trade:

Short FB 215 Call at $2

So let’s say we want to buy back our short option if the option moves against us and rises to $3 in value. However, we are unwilling to pay more than $3.40 for this equity option.  

Just as in our previous example, this stop-limit order has two components::

Stop Price: 3

Limit Price: 3.40

So at what price can we expect to get filled? At $3.40 or better. The buy stop-limit order can also get filled better than our stop price! (think market open). 

And here’s how this trade would look on tastyworks:

Stop-Limit Order Pros and Cons

Lastly, let’s fly over some advantages and disadvantages of the stop-limit order. 

👍 Stop-Limit Order Pros

  1. Assures fill price.
  2. Traders are not constantly required to monitor their positions.
  3. Acts as a hedge against illiquid markets.

👎 Stop-Limit Order Cons

  1. If the market blows past your limit price, your position could move against you…fast!
  2. Erroneous fills could trigger the stop price portion of the stop-limit order, resulting in an undesirable and early exit. 

TIF Order Types

In stop orders, you also need to consider the TIF designation. TIF (time-in-force) orders can be designated in numerous different ways. These communicate to a broker when and for how long a trade should remain working. Some of these include DAY, GTC, GTD, EXT, GTC-EXT, MOC, LOC. Read more about these order types in our article on TIF order types here!

Stop Limit Order FAQ's

A stop-loss order triggers a market order. In market orders, fill prices are unknown. Stop-limit orders guarantee execution price, but that doesn’t mean you’ll get filled!

This depends on whether or not you have tagged the order as “DAY” or “GTC”. DAY orders are only good for the day, GTC (Good Til Cancelled) orders stay working in your account until you cancel them.

Stop orders are NOT visible until they get triggered, at which point your broker sends them to the exchanges/market makers. Limit order ARE visible to market makers as they are in working status immediately. 

Recommended Video

Next Lesson

Additional Resources

Covered Put Writing Explained (Best Guide w/ Examples)

The covered put writing options strategy consists of selling a put option against at least 100 shares of short stock. 

By itself, selling a put option is a highly risky strategy with significant loss potential. However, when combined with a short stock position of 100 shares, selling a put option adds no additional risk, and creates a way to profit when the share price remains flat or even increases slightly.

Additionally, the credit received from the put option provides protection against increases in the stock price. The true “cost” of selling a put against short stock is that the potential profits of the short shares will be capped below the strike price of the put that is sold.

Covered Put Strategy – General Characteristics

Let’s go over the strategy’s general characteristics:

Max Profit Potential: (Share Sale Price + Credit Received for Put – Short Put Strike) x 100

Max Loss Potential: Unlimited

Expiration Breakeven: Share Sale Price + Credit Received for Put

Approximate Probability of Profit: Greater Than 50% (assuming the stock and put are sold at the same time)

To gain a better understanding of these concepts, let’s walk through a hypothetical trade example.

Profit/Loss Potential at Expiration

In the following example, we’ll construct a covered put position from the following options chain:

In this example, let’s assume that we sell the 85 put for $3.00, and that the stock is trading for $90 when we short the shares:

Share Sale Price: $90

Put Strike Sold: $85

Premium Collected for the 85 Put: $3.00

Here are this particular position’s characteristics:

Max Profit Potential: ($90 share sale price + $3 premium received – $85 short put strike) x 100 = $800

Max Loss Potential: Unlimited

Expiration Breakeven Price: $90 share sale price + $3 credit received = $93

Probability of Profit: Greater than 50% because the stock price can increase $3 and the position can break even (no loss).

The chart below visualizes this position’s profit and loss potential based on various stock prices at expiration:

covered put vs short stock

As you can see, selling 100 shares of stock at $90 and selling the 85 put for $3 reduces the risk of the position compared to just shorting stock. Since premium is collected for selling the put, the sale price of the shares is effectively increased by the sale price of the put. Therefore, the breakeven price of a covered put position is the effective sale price of the shares. The benefit of a higher breakeven price comes at the cost of lower profit potential when the shares decrease.

In this graph, we’ve also added the profits and losses for a short stock position as a comparison. Compared to the short stock position, the covered put has less loss potential and more profit potential at most stock prices at expiration. However, if the stock price falls significantly below the short put strike, then the short stock position without a short put against it will produce more profits.

Because of this, a covered put writer is usually not extremely bearish on the stock price.

Nice job! You know the potential outcomes of a covered put position at expiration, but how does the position perform over time before expiration? To demonstrate this to you, we’re going to look at a few trade examples using real option data.

Covered Put Trade Examples

In the following examples, we’ll compare changes in the stock price to a covered put position on that stock. Note that we won’t discuss the specific stock the trade was on, as the same concepts apply to other stocks in the market. Lastly, each example uses a trade size of one covered put (-100 shares of stock against one short put). 

Trade Example #1: Maximum Profit Covered Put Position

First, let’s examine a situation where covered put writing is less lucrative than just shorting shares of stock.

Here are the trade details:

Initial Share Purchase Price: $50.47

Strike Price and Expiration: Short 47 put expiring in 44 days

47 Put Sale Price: $2.03

Breakeven Stock Price (Effective Share Sale Price): $50.47 share sale price + $2.03 credit received from put = $52.50

Maximum Profit Potential: ($52.50 effective share sale price – $47 short put strike) x 100 = $550

Maximum Loss Potential: Unlimited

Let’s see what happens!

covered put chart

As illustrated here, a covered put position has limited profit potential. In this example, the stock price collapses from $52.50 to $37.50, resulting in over $1,250 in profits for the short stock position. However, the covered put has a short 47 put, which caps the position’s profits at any stock price below $47. With an effective share sale price of $52.50 and a short put strike of $47, the maximum profit of this covered put position is $550.

Another important note about this particular trade is that the position does not need to be held to expiration to realize profits. In this example, maximum profit occurs with around 18 days to expiration. The trader could lock in profits at this point by simultaneously buying back the short shares and the short put, thereby closing the covered put position.

At expiration, the short put is in-the-money, which means the covered put trader would be assigned +100 shares of stock at the put’s strike price of $47. Since the trader is already short 100 shares of stock, the assignment effectively forces the trader out of their stock position. To avoid assignment, the trader could buy back the 47 put before expiration. However, keep in mind that it’s always possible to be assigned early on an in-the-money short put, especially when the put has little extrinsic value remaining.

Next, we’ll look at an example of when covered put writing works out much better than just shorting stock.

Trade Example #2: Covered Put Outperforms Short Stock

In the next example, we’ll look at a situation where the stock price increases slightly over a 46-day period after a covered put position is entered. We’ll compare the position’s performance to a short stock position.

Here are the trade details:

Initial Share Purchase Price: $114.88

Strike Price and Expiration: Short 112 put expiring in 46 days

112 Put Sale Price: $5.02

Breakeven Stock Price (Effective Share Sale Price): $114.88 share sale price + $5.02 credit received from put = $119.90

Maximum Profit Potential: ($119.90 effective share sale price – $112 short put strike) x 100 = $790

Maximum Loss Potential: Unlimited

Let’s see how the covered put performs!


covered put performance

In this example, you’ll notice that the covered put position performs better than the short stock position as long as the stock price doesn’t fall significantly. Most importantly, this covered put position doesn’t lose money even though the stock price increases from the short stock entry price because the profits from the short put offset the losses on the short shares.

As mentioned in the previous example, a covered put writer can buy back their position to lock in profits or losses before expiration. In this example, the trader had many opportunities to close the position for profits over $500, which represents nearly 66% of the maximum profit potential.

At expiration, the covered put writer doesn’t have to worry about assignment because the put is out-of-the-money. Additionally, the trader could sell another put in the following month to collect more premium and increase the breakeven price of their short stock position even further.

In the final example, we’ll look at a covered put position that realizes a significant loss.

Trade Example #3: A Covered Put Gone Wrong!

In the final example, we’ll look at a scenario where a covered put position is unprofitable but better off than just shorting the stock.

Here are the trade details:

Initial Share Purchase Price: $162.60

Strike Price and Expiration: Short 140 put expiring in 42 days

140 Put Sale Price: $6.72

Breakeven Stock Price (Effective Share Sale Price): $162.60 share sale price + $6.72 credit received from put = $169.32

Maximum Profit Potential: ($169.32 effective share sale price – $140 short put strike) x 100 = $2,932

Maximum Loss Potential: Unlimited

Let’s see what happens!

covered put loss

As we can see here, the covered put position did not perform well because the stock price increased significantly above the breakeven price of the position. However, since the 140 put expired worthless, the covered put position was $672 better off than the short stock position by itself. Because of this, selling puts against short stock positions reduces the losses when the stock price rises.

At expiration, the covered put trader would not have to worry about assignment since the 140 put was out-of-the-money.

Congratulations! Hopefully, you are now much more comfortable with how covered put writing works! In the next section, we’ll discuss how to go about selecting which put to sell.

How to Select a Put Strike to Sell

At this point, you know how covered put writing works, as well as when you might use the strategy. However, with so many different put strikes available, how do you choose which one to sell? We’ve put together a simple guide that may help the strike price selection process easier.

Determine Your Outlook

Before selecting a put strike to sell, it’s crucial to determine an outlook for the shares of stock that you’re short.

Here is a quick guide that demonstrates how to select a put strike based on various outlooks.

Put Selling Guidelines Based on Various Stock Price Outlooks

Share price will increase significantly

With such a bullish outlook, shorting shares of stock or trading covered puts is probably not the right strategy in the first place. However, if you must trade a covered put, selling an at-the-money or even an in-the-money put option would provide the most upside protection.

Share price may remain relatively flat, or even decline slightly

With a neutral to bearish outlook, selling puts with strike prices closer to the stock price (-0.40 to -0.50 delta puts) may be logical. Selling at-the-money puts provides the greatest profit potential from the decay of the put’s extrinsic value, as well as the most protection from share price increases.

Share price will fall significantly

With such a bearish outlook, selling puts against a short stock position may not be logical since the profit potential will be capped. However, if you insist on trading a covered put, then selling a put with a lower probability of expiring in-the-money (-0.15 to -0.25 delta) may be logical.

The sections above serve as a guideline for selecting a put to sell. When trading covered puts, there isn’t a “one-size-fits-all” approach. The put that is sold depends on the investor’s outlook for the stock price in the future.

Chris Butler portrait

Long Gamma and Short Gamma Explained (Best Guide)

Option gamma is the options greek that estimates the rate of change of an option’s delta as the stock price fluctuates.

An option’s delta tells us the estimated option price change relative to a $1 change in the stock price. Delta is therefore a measure of directional risk exposure.

Since an option’s gamma tells us how the option’s delta moves as the stock price changes, gamma tells us how our directional risk exposure changes when the stock price fluctuates.

You will learn the importance of gamma in options trading in this detailed guide.

Why is Gamma Important in Options Trading?

Traders who delta hedge pay close attention to gamma because it informs them of how their position’s delta will change as the stock price changes.

A high gamma value translates to high volatility of an option position’s directional risk exposure. If an option position has high gamma, its delta will shift significantly when the underlying stock moves.

A low gamma value translates to low volatility of an option position’s directional risk exposure. If an option position has low gamma, its delta will only experience a small change when the underlying stock moves:

Therefore, traders will have a harder time delta hedging a high gamma option position as compared to a low gamma option position.

Even if you aren’t a trader who is delta hedging, gamma is important to understand because it tells you how your position’s P/L sensitivity will change as the stock price moves.

What is Long Gamma in Options Trading?

A long gamma position is any option position with positive gamma exposure.

A position with positive gamma (long gammaindicates the position’s delta will increase when the stock price rises, and decrease when the stock price falls.

A call and put purchase both have positive gamma:

If you buy a call or put you will have positive gamma exposure, meaning gamma is added to your position delta when the stock price increases, and subtracted from your position’s delta when the stock price declines.

In other words, a long call’s position delta becomes more positive (moves towards +1.0) and a long put’s position delta becomes less negative (moves towards zero) as the share price rallies.

Conversely, a long call’s position delta becomes less positive (moves towards zero) and a long put’s position delta becomes more negative (moves towards -1.0) as the share price falls.

What is Short Gamma in Options Trading?

A short gamma position is any option position with negative gamma exposure.

A position with negative gamma (short gamma) indicates the position’s delta will decrease when the stock price rises, and increase when the stock price falls.

Short call and short put positions have negative gamma:

If you short a call or put you will have negative gamma exposure, meaning gamma is subtracted from your position delta when the stock price increases, and added to your position’s delta when the stock price declines.

In other words, a short call’s position delta becomes more negative (moves towards -1.0) and a short put’s position delta becomes less positive (moves towards zero) as the share price rallies.

Conversely, a short call’s position delta becomes less negative (moves towards zero) and a short put’s position delta becomes more positive (moves towards +1.0) as the share price declines.

Let’s look at some real stock price movements vs. option deltas and visualize long and short gamma.

Long Gamma Example

In this table, the positions with positive gamma are said to be long gamma. As you can see here, long gamma positions benefit when the stock price moves in favor of the position because the directional exposure of the position grows in the same direction as the stock price.

To demonstrate this concept, let’s look at some real examples.

The following visual demonstrates how a long call’s delta increases as the stock price increases:


The long call’s position delta grows from +25 to +75 as the stock price increases. With a delta of +25, the long call trader is expected to make $25 for each $1 increase in the stock price, and lose $25 for each $1 decrease in the stock price.

However, when the delta grows to +75, the long call trader is expected to profit by $75 when the share price rises by $1 and lose $75 when the share price falls by $1.

The long call trader wants the stock price to rise to profit from the increased positive delta exposure.

In the next visual, we’ll look at a long put position. Note how the long put’s position delta falls as the stock price decreases.

Short Gamma Example

The positions with negative gamma are said to be “short gamma.” As you can see here, short gamma positions are harmed when the stock price moves against the position because the directional exposure of the position grows in the opposite direction as the stock price movements.

Let’s look at some real examples to demonstrate short gamma.

The following visual illustrates how the position delta of a short call grows more negative when the stock price increases:

The short call’s position delta falls from -27 to -85 as the stock price rises.

With a delta of -27, the short call trader is expected to lose $27 for each $1 increase in the stock price.

However, when the delta falls to -85, the short call trader is expected to lose $85 when the share price rises by $1.

A short call trader does not want the stock price to increase because their losses will become more significant if the stock price continues to rise.

Next, we’ll look at a short put position. Note how the position’s delta increases as the stock price decreases.

The short put’s position delta rises from +30 to +80 as the stock price falls.

With a delta of +30, the short put trader is expected to lose $30 for each $1 decrease in the stock price.

However, when the delta rises to +80, the short put trader is expected to lose $80 when the share price falls by $1.

So, a short put trader does not want the stock price to decline because their losses will become more significant if the stock price continues to fall.

Conclusion

Long option positions (buying calls or puts) have positive (long) gamma.

Positive gamma means we add gamma to the position’s delta when the underlying stock price increases, and subtract gamma from the position’s delta when the underlying stock price falls.

When the stock price rallies, positive gamma positions will see their position deltas increase (becoming more positive for long calls and less negative for long puts).

And when the stock price declines, positive gamma positions will see their position deltas fall (becoming less positive for long calls and more negative for long puts).

Short option positions (shorting calls or puts) have negative (short) gamma.

Negative gamma means we subtract gamma from the position’s delta when the underlying stock price increases, and add gamma to the position’s
delta when the underlying stock price falls.

When the stock price rallies, negative gamma positions will see their position deltas fall (becoming more negative for short calls and less positive for short puts).

And when the stock price declines, negative gamma positions will see their position deltas increase (becoming less negative for short calls and more positive for short puts).

Option Gamma FAQs

There is not necessarily a “good” gamma for an option position as it depends on your position.

If you’re a professional trader who is delta hedging an option position, high gamma makes it harder to keep the position delta-neutral, as a small stock price change leads to a large shift in delta. Therefore, a lower gamma would make your job easier.

If you’re a call buyer, a high gamma is good if the stock price is increasing, as the call position’s delta will grow quickly and your subsequent profits will be higher if the stock price continues to rally.

“Gamma risk” refers to a large shift in an option position’s delta as the stock price moves.

Gamma risk is highest for at-the-money option positions nearing expiration because short-duration, at-the-money options have the highest gamma values (largest delta changes vs. underlying stock price changes).

An option position that is long gamma will also be long volatility because option purchases (long calls and long puts) are positive gamma and positive vega.

“Gamma scalping” is when an options trader buys/sells shares of underlying stock against a long/short option position.

The goal is to periodically adjust the position’s delta by trading in and out of underlying stock with the intention of profiting from the overall stock/option position.

Profits can stem from the share trading activities, or the option position value changes.

For example, a gamma scalper who shorts a straddle will need to buy stock as the share price increases and sell stock as the share price falls. The trader will profit from the strategy if the stock volatility is low, driving profits from the short straddle decay with minimal losses from the stock trading.

Conversely, a gamma scalper who buys a straddle will need to short stock as the share price increases and buy stock as the share price falls. The trader will profit from the strategy if the stock volatility is high, driving profits from the stock trading activities that exceed losses from the long straddle’s decay.

Gamma scalping is also known as “dynamic delta hedging,” and is an active trading strategy used by extremely sophisticated traders.

A “gamma squeeze” is a feedback loop caused by short call traders/market makers who wish to be delta-neutral.

As the stock price increases, these short call traders need to buy stock to neutralize their increasingly negative position delta, leading to more buying pressure on the stock’s price, necessitating further stock purchases to again neutralize the negative delta.

Stock Price Rises => Short Call Traders Buy Stock to Hedge => Stock Price Rises => Short Call Traders Become Delta-Negative => Short Call Traders Buy More Stock to Hedge => Stock Price Rises => Repeat

Chris Butler portrait