Options Chain Definition: A matrix displayed on a trading software that shows the vital components of tradable call and put options, such as bid-ask, volume, open interest, and the Greeks.
The first lesson in any options trader’s education is mastering the option chain. Though this seemingly endless grid of data can be overwhelming at first, when broken down, the option chain can be easily understood.
TAKEAWAYS
An options chain lists all tradable call and put options in a selected security.
Vital option chain information includes the option type, expiration, strike price, and bid-ask spread.
Adding “volume” and “open interest” to an options chain helps traders understand the liquidity of an option.
Option chains can be customized to add the Greeks as well, including delta and theta.
An options expiration cycle is listed on the left side of an options chain; an option’s IV (implied volatility) is listed on the right side of an options chain.
New to options trading? Learn the essential concepts of options trading with our FREE 160+ page Options Trading for Beginners PDF.
What is An Options Chain?
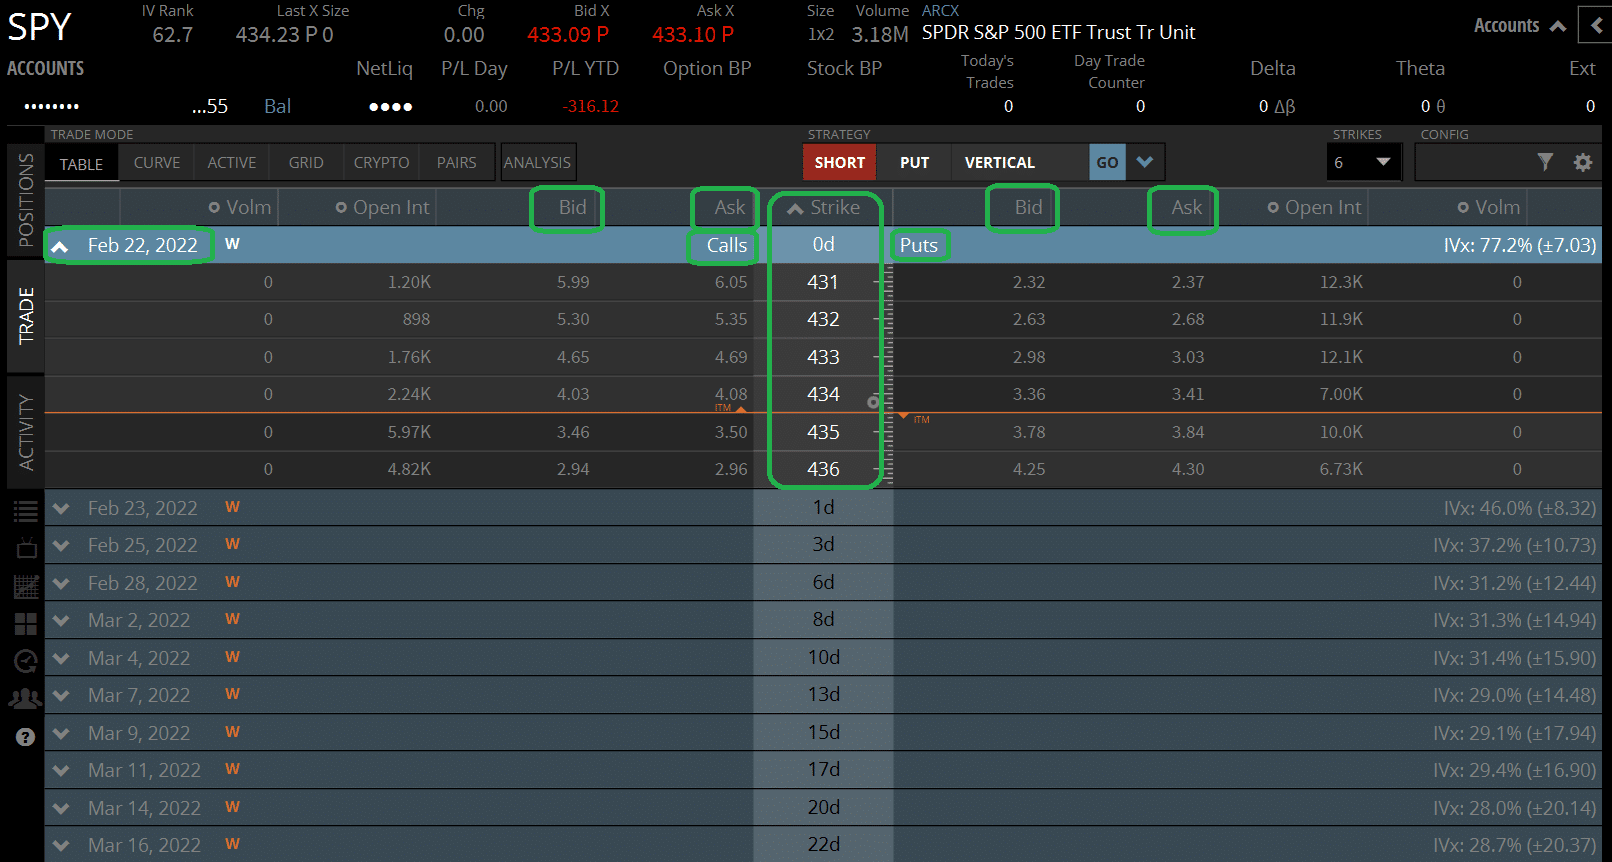
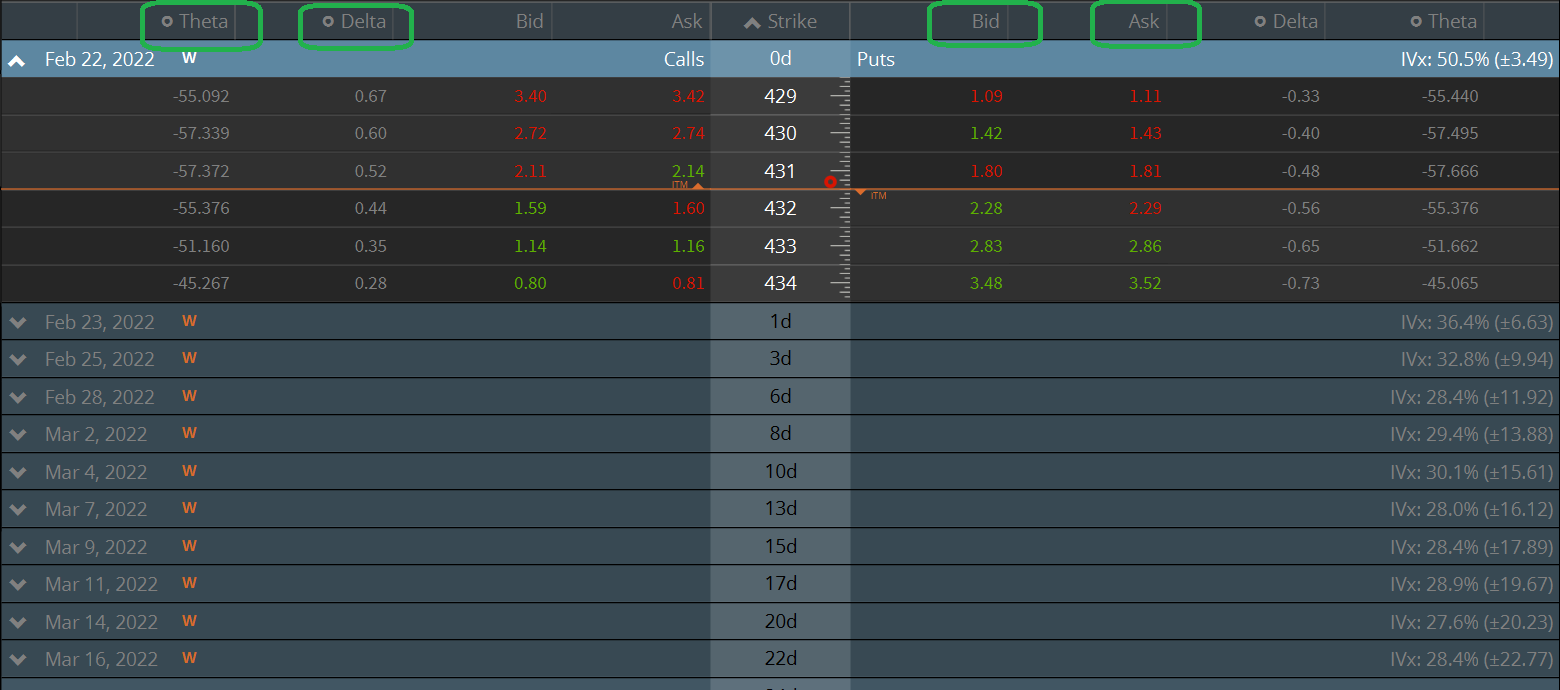
The above image (taken from the tastyworks trading platform) shows the options chain for the Exchange-Traded Fund (ETF) SPY.
We have highlighted the most crucial components of this ETF option chain. These include:
In an options chain, calls are always listed on the left side; put options are listed on the right side. As we can see in the above visual, these two areas are divided by the strike price.
➥ Option Strike Price
Strike prices are always at the center of an options chain. The strike price is the price at which call and put options are exercised and thus assigned.
If you buy a SPY call option at the 435 strike price, that contract gives you the right to buy 100 shares of SPY stock at $435/share, which the short party must deliver.
➥ Bid-Ask Spread
Just like with stock, there is a bid and ask price for every option. You can sell an option at the bid price and buy an option at the ask price. The tighter the markets, the better the liquidity.
The closer an option is to expiring, the better its liquidity will be.
Customizing Your Options Chain
Most trading platforms offer customers numerous options when it comes to customizing their options chain. In addition to the above basic information, columns can be arranged by:
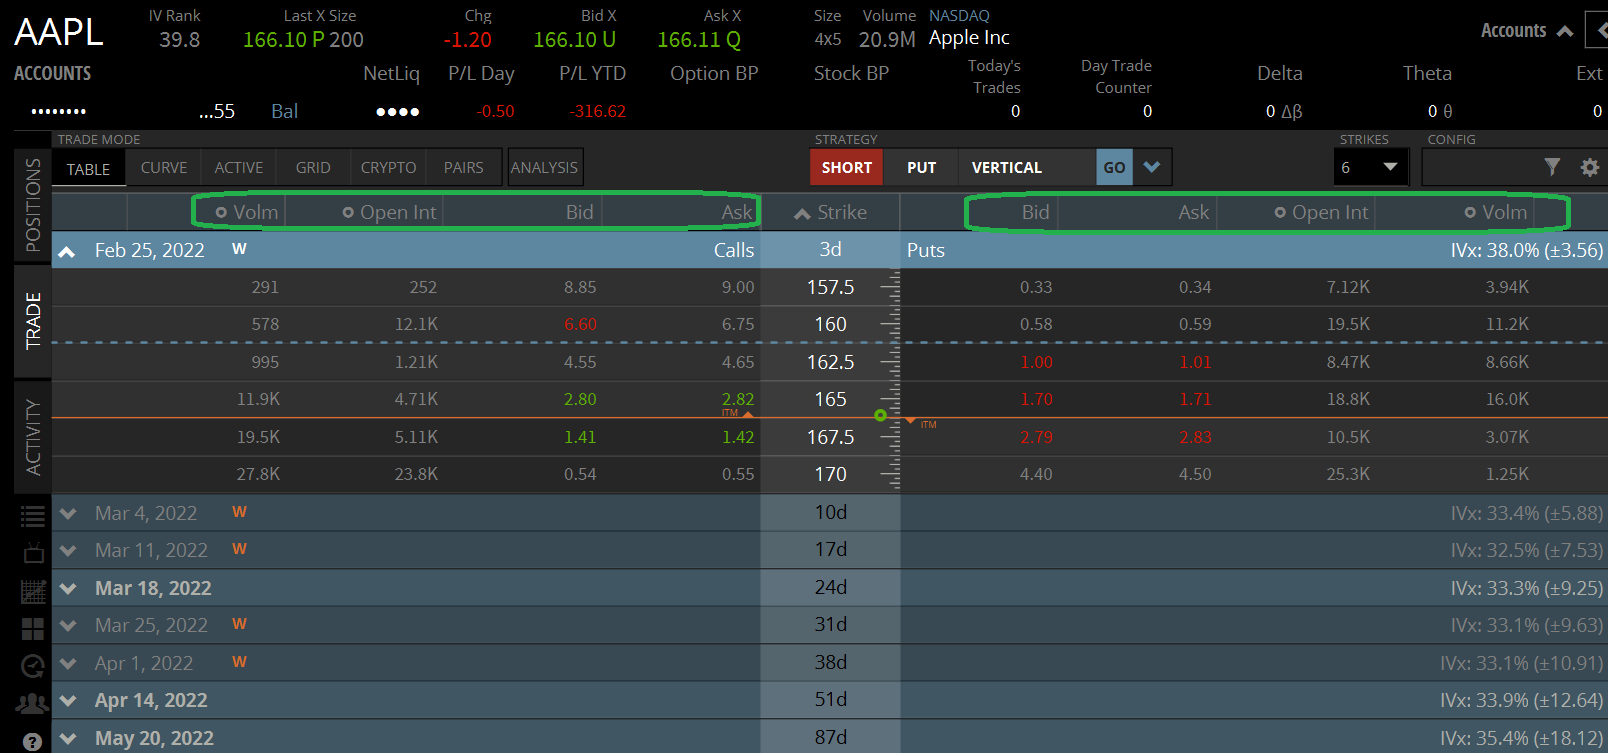
The above list is by no means exhaustive. The below screenshot from tastyworks shows a few different customizable layout options for their displayed options chains:
So which layout is best for you?
I personally believe that all elements of liquidity should be displayed first and foremost. In addition to the bid-ask spread, volume and open interest are vital in determining the liquidity of an option.
Markets with poor liquidity measures can result in horrible fills. You want high volume/open interest as well as tight bid-ask spreads.
The below image shows how I prefer to layout my options chains:
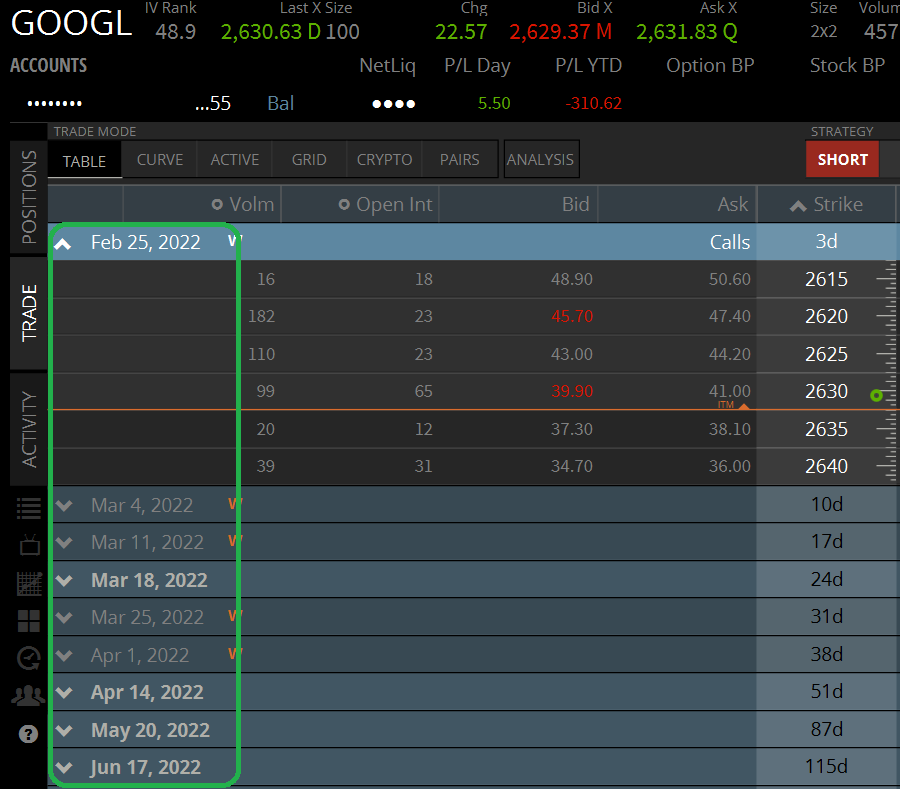
Option Chain and Expiration
An options expiration date is always displayed on the far left side of an options chain:
The further down the option chain you go, the less liquidity you are exposed to. Most people prefer to trade options with 0-60 days to expiration (DTE).
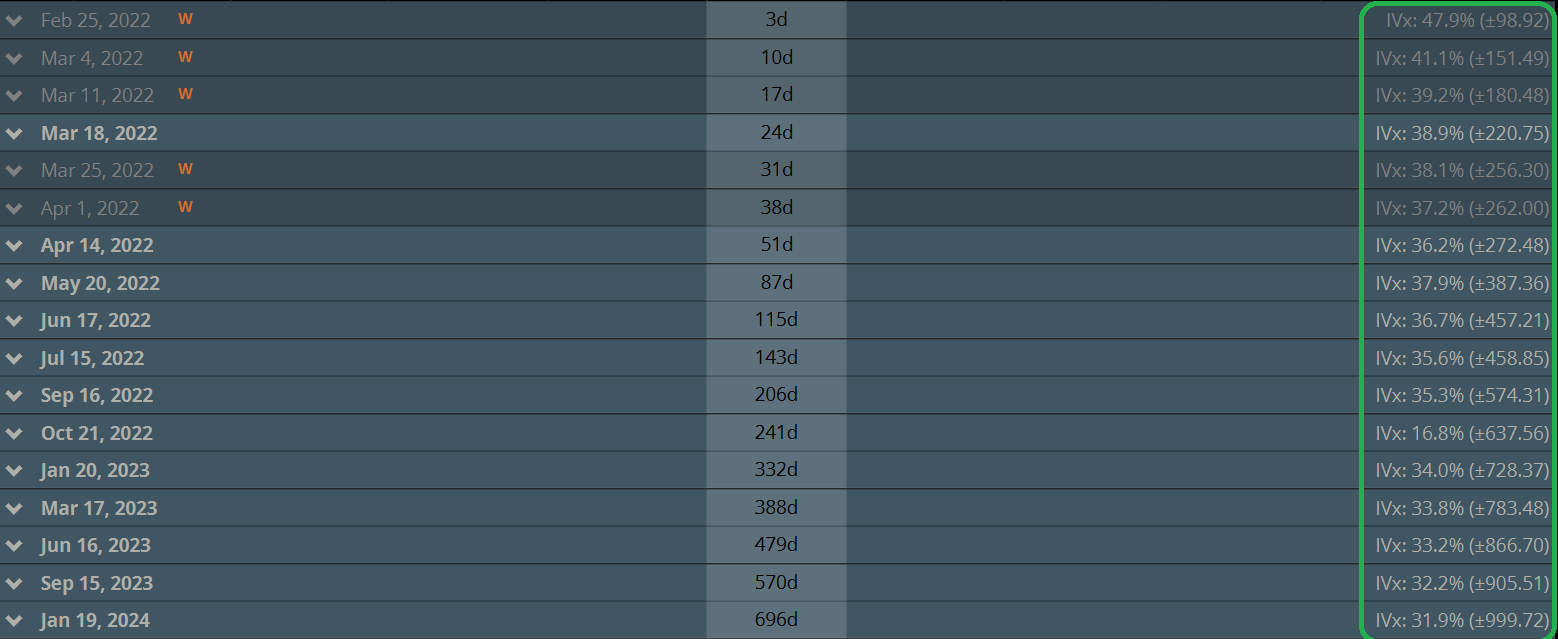
If we skip over to the far right side of the options chain, we will see Implied Volatility (IV):
In options trading, implied volatility (IV) is of utmost importance. This number tells us the expected volatility of a stock over an options life.
The higher the IV, the higher the option premiums will be. Option sellers are particularly drawn to high IV levels, as this means higher premiums can be collected.
IV levels are generally highest for front-month options and fall for long-term options, as seen in the image above.
Option Chain and The Greeks
In options trading, the Greeks are a series of calculations used by traders to measure various factors that affect an options price. The Greeks include.:
Delta(how much an option moves in response to a $1 change in underlying)
Gamma (the rate at which the delta changes in response to a $1 change in the underlying)
Theta (the rate at which an option decays with 1 passing day in a constant environment)
Vega (the change in an option’s price in response to a one-point change in implied volatility)
If you’re new to the Greeks, our article, “The Greeks for Beginners” is a great starting point. Pros use the Greeks daily.
You can set up your options chain to include these measures as well.
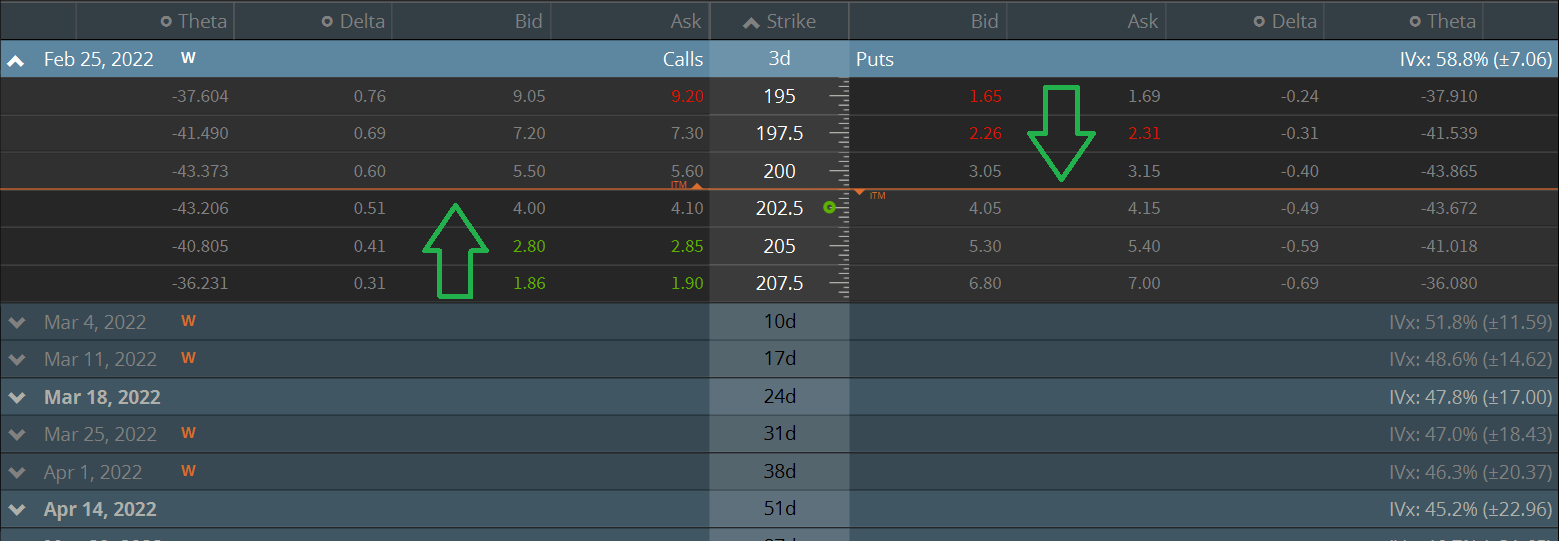
Option Chain and Moneyness
The last segment in our option chain tutorial is option moneyness.
All options reside in one of three moneyness states:
In-The-Money
At-The-Money
Out-Of-The-Money
Moneyness simply tells us whether or not an option has “intrinsic value“. Intrinsic value exists when an option has value on its own, discounting time and implied volatility. To read more about this topic, check our “Intrinsic vs Extrinsic Value” article.
Most options chains have a line dividing in-the-money options from out-of-the-money options. On the tastyworks platform, this line is displayed in the option chain as an orange line:
An options chain indicates all of the listed call and put options for a given security. Information about liquidity and the Greeks are displayed in an options chain.
Mike was a writer for projectfinance. He has spent over 15 years in the finance industry, working for such companies as thinkorswim, TD Ameritrade and Charles Schwab. His work has appeared in the Financial Times, the Chicago Sun-Times, and The Buffalo News.
(1)")