?> Options Trading Archives - projectfinance

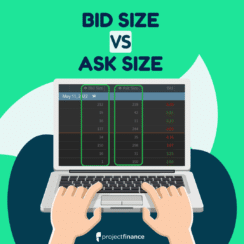
Bid Size vs. Ask Size in Options & Stocks Explained

bid size vs ask size

Bid And Ask Size Definition: The total quantity of shares/options that can be sold (bid) or bought (ask) at the current market prices.

In options trading, liquidity refers to the ease at which an option can be opened and closed. Unlike stocks, options can have very wide markets. 

There are numerous measures available for traders to gauge the liquidity of an option. Among these is the “bid size” and “ask size”. 

The bid size tells us how many options we can sell at a quoted price. The ask size tells us how many options we can purchase at a quoted price. 

For those trading large positions, this metric is crucial. In this article, projectfinance is going to show you why. 

Liquidity Measures In Options Trading

Before we get into bid size vs ask size, let’s first review a few other important measures of option liquidity in financial markets. 

  • Option Volume: The number of contracts traded so far on a given day.

  • Open Interest: The number of contracts currently in existence for a particular option.

  • Option Bid-Ask Spread: The difference between the bid price and the asking price.

  • Stock Volume: The number of shares of stock traded on a given day.  

Ideally, you want to trade options with high volume and open interest. Additionally, you want the stock volume to be high as well. Why? 

Market Makers hedge the options they buy and sell with stock. High stock volume generally means the stock is liquid, which means they can hedge easier, therefore giving you better fill prices.

Option spreads (the difference between the bid and ask price) in derivatives should also be tight. I have seen some options with a bid of $1 and an ask of $3. This means, that if you were to get filled on a buy order at the market price, you would lose $2 if you sold immediately. The tighter the spread, the less slippage to you. 

But sometimes option markets can be misleading. A market maker may bid an option at $2, but how many options is that market participant willing to purchase from you at $2? 1? 200?

This is where bid size and ask size come into play. 

Bid Size And Ask Size In Stock

Bid Size Definition: The quantity of a security a market maker or investor is willing to purchase at a specific price. 

Ask Size Definition: The quantity of a security a market maker or investor is willing to sell at a specific price. 

Let’s first look at an example of bid size vs ask size in the stock market. 

aapl bid size ask size

The above image (taken from the tastyworks trading platform) shows the current market for AAPL stock. We can currently sell AAPL for 154.62 and buy AAPL for 154.69.

The spread here is 0.07, the difference between the bid and the ask price. If we were to buy and immediately sell this stock, we would lose 0.04. Of course what we lose, the market maker gains.

But how many shares can we sell at the bid stock price 150.62? And how many can we buy at 154.69? A gazillion?

This is where the “size” of the bid and ask come into play. The current size of AAPL stock is circled in green above. In the stock market, bid size and ask size represent 100 shares of stock. Therefore, a bid size of “1” really means 100 shares. 

In our AAPL example, we can see that there is 300 shares bid at 154.62 and 200 shares offered at 154.69.

Bid Size And Ask Size In Options

Just as with stock, options have bid sizes and ask sizes. Let’s jump right into an example by looking at call options on SPY, an S&P 500 index-tracking ETF

Spy - Bid/Ask Size

In the above options chain, we can see the various bid and ask sizes for different SPY call options with an expiration date of May 11th. 

Unlike stock, the bid and ask sizes for options do not represent 100 contracts. If an option contract has a bid size of 34, that means 34 options are available to sell at the quoted price. 

Bid and ask sizes are in constant flux with the market. If you watch a live options chain on a liquid product like SPY, these numbers will change several times a second.

Bid Size And Ask Size In Illiquid Options

In our above example, we looked at the bid and ask size on SPY, which just happens to be the most liquid security in the world. Let’s now check out the bid and ask sizes on a less liquid security, Ryder System – R. 

Ryder Systems - Bid/Ask Size

R bid ask size

So far today, Ryder Systems has traded 230k of stock. Spy, on the other hand, has traded 40 million. A stock that has high volume is usually indicative of decent option liquidity. 

R is therefore far less liquid than SPY. When comparing the bid/ask size of R with SPY, we can see that R has many more options both bid and offered at various strike prices than SPY.

One may think that more liquid stocks have higher bid/ask sizes, but that is not always the case. Why?

We must look at the actual spread of the options. With SPY, the options are about a nickel wide. R, on the other hand, has spreads ranging from 0.80 to 4 wide! 

Market makers in R, therefore, have a much better chance of profiting in these wider spreads than those in SPY. Because of this, they are willing to both buy and sell greater quantities of options in R than SPY. 

Bid Size And Ask Size: Why It Matters

So why does this matter to you? Let’s jump right into an example to see why. 

Let’s assume you own 10 LEAP call options on AAPL. You are happy with your profits and, not knowing that LEAP options are very illiquid, you place a market order to sell your long calls. 

You see a quoted bid price of 31.40, and presume you will get filled at this price. After hitting send, you discover only one contract was filled at 31.40, while the others were filled at 31.15! Why did this happen?

Because only one contract was bid at 31.40. The others were bid at 31.15. 

So how do we know what the next best price will be? By putting the option code into the trade grid, as I have done below:

aapl bid ask size

This is a perfect example of why it is very important to only use limit orders in options trading. The current ask price and current bid price do not guarantee you will get filled here. This is particularly true in high volatility environments and illiquid products. 

Though you may not get filled right away using limit orders in both buy orders and sell orders, they do ensure the best fill price – if/when you actually get filled. You can even work limit orders downward or upward until you get filled.

Bid Size And Ask Size FAQs

When the ask size exceeds the bid size, this can be a sign that a stock will fall as a result of oversupply. On the other hand, when the bid size is greater than the ask size, this can be a sign that demand is greater than supply. When this happens, the underlying stock price may soon rise in value. 

The ask price is the price at which a market maker is willing to sell you an option. Therefore, this is the price at which you will purchase an option.

The bid price is the price at which a market maker is willing to buy an option. Therefore, this is the price at which you can sell an option. 

Both the ask size and the bid size of options are in constant flux with the market. Market makers determine the quantity at which they will both buy and sell options by looking at factors such as stock price and supply and demand. Because of this, the ask size is rarely the same as the bid size. 

Next Lesson

29 Core Options Trading Strategies For Beginners

Options are incredibly versatile investment products. Calls and puts can be combined in innumerable ways to create custom-tailored options trading strategies.

These strategies can be designed to profit in bearish, bullish, or even neutral markets. 

In this article, projectfinace has compiled a list of 29 core options trading strategies for beginners. To learn more about a particular option strategy, simply click on the image. 

Bullish Options Strategies

Long Call Option

Bull Call Spread

Short Put Option

Covered Call

Bull Put Spread

Cash Secured Put

Collar Spread

Covered Strangle

Synthetic Long Stock

Poor Man's Covered Call

The Wheel Strategy

Protective Put

Long Call Ladder

Bearish Options Strategies

Long Put Option

Bear Call Spread

Short Call Option

Bear Put Spread

Covered Put Write

Synthetic Short Stock

Neutral Options Strategies

Short Iron Condor

Long Iron Condor

Short Straddle

Long Straddle

Short Strangle

Long Strangle

Short Iron Butterfly

Long Iron Butterfly

Long Butterfly Spread

Long Call Calendar

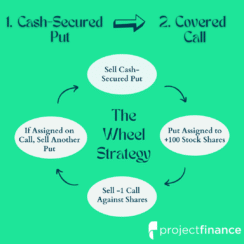
The Wheel Options Strategy: Collect Income From Options

The Wheel Options Strategy

The Wheel Definition: In options trading, the “Wheel” is 4 step strategy that first involves selling a put option. If/when this put is assigned, you will be long stock. The next step is to sell a call option against this stock. If the underlying rises in prices, you will be “called out” on the stock, resulting in a flat position. Repeating this process creates “the wheel”.

The wheel strategy is a great, long-term options trading strategy best suited for traders looking to generate income. In this article, we will review step-by-step how this income strategy profits. 

              TAKEAWAYS


  • The wheel strategy involves selling a cash-secured put, purchasing stock when/if the put is assigned and then selling a call against this long stock.

  • Both the put and call sold are ideally out-of-the-money.

  • The wheel options strategy works best in minorly bullish markets; in very bullish markets, owning the stock outright will be more advantageous. 

What Is the Options Wheel Strategy?

The wheel involves a multi-step, systemic process:

  1. Sell cash-secured puts on a stock you want to eventually own.

  2. When the stock falls below your short put strike price on the expiration date, your short put will be assigned and converted into long stock.

  3. Once in possession of the long stock, sell an out-of-the-money call on this stock.

  4. If/when the stock rallies to the short call strike price on expiration, you will be called out, or “assigned,” leaving you with a flat position.

  5. Re-enter the short put position on the same or another stock.

Let’s now go through the different components of this strategy step-by-step. 

What Is A Cash-Secured Put?

Cash-Secured Put Definition: In options trading, a “cash-secured put” is a short put option that is backed with the full cash amount needed to buy the shares at the strike price. This strategy is both neutral and bullish on the underlying.

Cash-Secured Put Maximum Profit: Premium received from selling put.

Cash-Secured Put Maximum loss: Strike price minus the premium received.

🎬 Watch on YouTube! Selling Put Options For Beginners

You can sell puts in both cash accounts (IRA accounts) and margin accounts. When you sell puts in cash accounts, you must front the entire capital required to purchase the stock should you be assigned. 

In margin accounts, the funds required to hold a “naked” put option are generally the greater of:

  • 20% of the underlying price minus the out of money (OTM) amount plus the option premium

  • 10% of the strike price plus the option premium

Since we anticipate purchasing the stock when the underlying stock price falls below our short put strike price, the wheel strategy must be “cash-secured”.

The Wheel: Cash-Secured Put Example

In this example, we are going to sell a put option of Ford (F). 

Why Ford? Ford is currently trading at $15/share. When you sell cash-secured put options, you need to front the cash to purchase the stock at the strike price. Options are leveraged securities – one contract represents 100 shares of stock. 

It will be very costly indeed to purchase 100 shares of Amazon (AMZN) for its current market price of $2,600/share! This is why I prefer selling puts on cheaper stocks, like Ford.

Here is our trade:

➥ Ford Stock Price: $15

➥ Put Option Strike Price: 14

➥ Put Option Expiration: 37 days away

➥ Put Option Premium (credit received): 0.60 

Cash-Secured Put Trade Outcomes

When you sell a put option, there are two trade outcomes. The stock will either close above your short strike price on expiration or above your short strike price. 

When the stock closes below your short strike price, you will be assigned on your short put. When the stock closes about your short strike price, your short put will expire worthless.

Ford Trade Outcome #1:

➥ Ford Stock Price: $15 –> $15.40

➥ Put Option Strike Price: 14

➥ Put Option Expiration: o days away

➥ Put Option Price: 0.60 –> 0.00

In this example, Ford closed above our short put strike. This means we collect the full premium of 0.60 ($60). Since we won’t be assigned stock, we can not initiate the wheel just yet. We’ll have to sell another put and wait for the stock to fall below the strike price. But we made some money in the process!

Ford Trade Outcome #2:

➥ Ford Stock Price: $15 –> $13

➥ Put Option Strike Price: 14

➥ Put Option Expiration: o days away

➥ Put Option Price: 0.60 –> 1.00

In the second outcome, Ford fell below our short strike price on expiration. This means we will purchase the stock at $14/share (the put’s strike). Since we collected $0.60 when selling the 14 put, our effective share purchase price is $14.00 – $0.60 = $13.40.

With the stock price at $13, we’re technically down $40, which is much better than being down $200 from purchasing the 100 shares at $15.

So what do we do now? To satisfy the wheel strategy, we must sell a call option against the assigned stock!

In order to better understand option premium and risk, read our guide: Implied Volatility for Beginners

What Is A Covered Call?

Covered Call Definition: In options trading, a covered call position is established when an out-of-the-money call option is sold against 100 shares of long stock. 

Covered Call Maximum Profit: Strike price of the short call option minus the purchase price of the underlying stock plus the premium received.

Covered Call Maximum Loss: Stock price minus option premium received.

🎬 Watch on YouTube! Covered Calls For Beginners

Because of its low-risk nature, the covered call is a great strategy for beginners. It is also a great way for traders to collect income from a stagnating stock they own.

If you own the SPY ETF at $400/share, and don’t believe SPY will be trading above $410 in a month, you could sell a 410 strike price call option on SPY expiring in 30 days. 

If SPY is trading below $410 on expiration, you will collect the full premium from the option. If SPY is trading above this price, your short call will be assigned, thereby forcing you to sell 100 shares. The net result? Your position is offset. 

Since we already own the stock, risk is eliminated here from the option. Therefore, we do not need to use margin, or set funds on reserve, to hold a short call when it is sold against long stock. 

The Wheel: Covered Call Example

Let’s now revisit Ford. Remember, in our second outcome, we were assigned on our short put option, leaving us long 100 shares of Ford. The first step of the wheel is complete.

Now, we must sell a call option against the long stock we own.

This call option must be “out-of-the-money.” I’ll provide a visual of option moneyness below. 

option moneyness chart calls and puts

Since Ford was trading at $13/share when we got assigned, the call we sell must be above this price to be out-of-the-money. 

Let’s say we sell the $14 call option on Ford. Here is our trade!

➥ Ford Stock Price: $13

➥ Call Option Strike Price: 14

➥ Call Option Expiration: 30 days away

➥ Call Option Premium (credit received): 0.40

Covered Call Trade Outcomes

Just as with our short put option, our short call has two possible outcomes: 

  1. The short call will expire worthless if out-of-the-money on expiration.

  2. The short call will be assigned short stock if in-the-money on expiration.

Let’s see how our trade did!

Ford Trade Outcome:

➥ Ford Stock Price: $13 –> $14.25

➥ Call Option Strike Price: 14

➥ Call Option Expiration: o days away

➥ Call Option Price: 0.40 –> 0.25

In this trade, Ford rallied from $13 to $14.25 at the time our short call expired. This means our call expired in-the-money. The final premium of the option was 0.25. Since we sold the option for 0.40, we made 0.15 ($15) on the trade!

However, since our option was in the money, we will be assigned on our short call. When assigned on a short call, you must deliver -100 shares of stock. But remember, we were already long 100 shares of stock. 

Therefore, this short assignment will offset our long stock, leaving us with no position in Ford.

To sum up the entire wheel position:

1) Shorted the 14 put for $0.60.

2) Stock fell to $13 and we got assigned on the 14 put, purchasing 100 shares at $14/share. Effective purchase price = $14 put strike – $0.60 put premium collected = $13.40.

3) Shorted the 14 call for $0.40.

4) Stock rallied to $14.25 and we got assigned on the 14 call, selling our 100 shares for $14/share. Effective share sale price = $14 call strike + $0.40 call premium collected = $14.40.

Total Position P/L: ($14.40 effective sale price – $13.40 effective purchase price) x 100 shares = +$100.

Another way to consider this P/L is to calculate the account inflows and outflows.

1) Shorted the 14 put for $0.60: $60 inflow

2) Buy 100 shares @ $14/share via put assignment: $1,400 outflow

3) Shorted the 14 call for $0.40: $40 inflow

4) Sold 100 shares @ $14/share via call assignment: -$1,400 outflow

$100 option inflow – $0 stock outflow = $100 net inflow.

A different way to get to the same conclusion is to consider closing the options at expiration and buying/selling the shares at the current stock prices.

1) Short the 14 put for $0.60, stock drops to $13. Close 14 put for -$0.40 and buy 100 shares at $13.

2) Short the 14 call for $0.40. Stock climbs to $14.25. Close the 14 call for $0.15 profit and sell shares at $14.25.

Stock P/L: $14.25 sale price – $13 purchase price = +$1.25 x 100 shares = +$125

Option P/L: -$0.40 on short put + $0.15 on short call = -$0.25 x 100 = -$25.

Net P/L: $125 stock profit – $25 option loss = +$100.

Same result, different math.

And we’re back to where we started from!

To complete the cycle, sell another put option on Ford, and repeat!

The Wheel And Strike Prices: Which Options To Choose?

In order to be a successful options trader, you must understand the risks. 

Having a fundamental understanding of “The Greeks” will help you accomplish this. 

Delta is the option Greek that tells us how much an option price is expected to move based on a $1 change in the underlying stock.

This Greek also tells us the probability an option has of expiring in-the-money (ITM)

An options chain can be arranged by the Greeks. When choosing your option contract strike prices for both cash-secured puts and covered calls, it is therefore very important to take this metric into consideration when choosing your strike prices for the wheel. 

The below options chain shows the deltas for SPX call options. The orange line represents the at-the-money options. We can see the following strike prices have the corresponding odds of expiring in-the-money:

  • 4140 Call: 60% 
  • 4165 Call: 50%
  • 4185 Call: 42%

deltas the wheel

The Wheel: Is It Worth It?

Though the wheel strategy is a great way to collect passive income, it does indeed require quite a bit of maintenance. 

Additionally, if you’re very bullish on a stock, your best bet is to buy it outright. The wheel takes time and money and underperforms in very bullish markets.

The Wheel Options Strategy FAQs

When choosing stocks for the wheel strategy, there are several factors to consider. If you have a limited amount of capital to work with, it may be wiser to stick with cheap stocks. Implied volatility is also important in this strategy. The higher the implied volatility, the higher the odds the stock will breach both the short put and short call strike price. 

The wheel options trading strategy is most profitable (when compared to simply buying the stock) when the underlying stock is minorly bullish.

If the stock goes up too much, the wheel strategy will lose money when compared to owning the stock outright.

Next Lesson

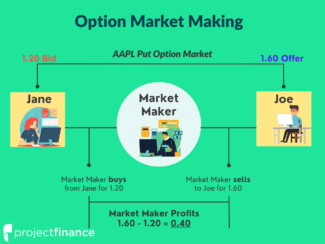
Market Makers in Options Trading: What Do They Do?

Market Maker Definition: A market marker acts as a liquidity provider by both buying and selling a security to satisfy the market. 

Market makers are the backbone of all public markets. Without them, it would be very difficult indeed to both enter and exit any type of security, including stocks, options (derivatives), ETFs, and futures. 

If you’ve ever placed a market order before, you’ve probably been surprised at how fast that order was filled. This is because a market maker was waiting, armed with a software-based trading system using algorithms, to take the other side of your trade. 

In this article, we will explore the function of market makers, and how they contribute to the smooth running of our capital markets. 

              TAKEAWAYS


  • The function of a market maker is to provide liquidity for the markets. 

  • Market makers make money from the “spread” by buying the bid price and selling the ask price. 

  • Market makers hedge their risk by trading shares of the underlying stock.

  • Citadel and Virtu are the largest option market makers. 

  • A broker acts as an intermediary, facilitating orders from buyers and sellers; a market maker provides order execution.

What Is the Purpose of Market Makers? 

Market makers are the reason our market orders get filled instantaneously. They also (eventually) fill stop orders, limit orders, and virtually any other type of order your broker offers. Without market makers, you would have to sit on the order until another counterparty came around and decided to take the other side of the trade. When might that time come? Who knows. This “illiquid” market would certainly cause us to distrust the markets. 

The ease to enter and exit trades is called liquidity. Providing liquidity is the primary function of all market makers. These market participants buy the bid price and sell the ask price on their specified security for any order that comes their way. 

Of course, market making is no charity – the difference between the bid and the ask is called the spread, and this spread is how market makers make money.

What Are Examples of Option Market Makers?

Let’s jump right into an example to see how market makers help markets run smoothly. 

This example is going to involve a put option on AAPL with three market participants: Jane, Joe and a market maker. 

  • Jane is currently long a AAPL put option contract and wants to sell.

  • Joe wants to buy the same contract Jane is selling.

  • The AAPL put is currently bid for 1.20 and offered for 1.60

Market Making Visualized

market maker options

Both Jane and Joe send a market to both sell and buy, respectively, their put option. These orders are sent to an exchange. Some major exchanges for options include:

  • Chicago Board Options Exchange (CBOE)

  • International Securities Exchange (ISE)

  • NYSE (New York Stock Exchange) Arca

  • Various Nasdaq Markets

After being sent to an exchange, the order is then seen on the screen of a market maker. The market maker buys the put from Jane while simultaneously selling the same put to Joe. 

Since the market maker bought the option at the bid of 1.20 (from Jane) and sold the option for 1.60 (to Joe), the market maker made a profit of 0.40, or $40 taking into account the leveraged multiplier effect of options. Remember, one options contract represents 100 shares of stock. 

Sometimes, Joe and Jane can trade directly together, but the vast majority of the time, a market maker is needed to facilitate these trades. What if there was no other trader out there who was willing to buy that put option Jane wanted to sell? How would she ever get out of her position?

How Do Market Makers Set Option Prices?

Market makers set option prices for all listed derivatives, including equity, ETF, and index options

In the above example, the market for our put option was 1.20/1.60. This means that if you were to buy this option at 1.60 and wanted to sell it immediately, you would have to sell it for 1.20. In other words, you would lose 0.40 (1.60-1.20), or $40, immediately. 

Of course what you lose, the market maker gains. 

But why is this market 1.20/1.60? Is this some arbitrary price? No! 

The width of a market (set by the various market markers for a security) depends on several factors. The more liquid a security is, the easier both you and a market maker can enter and exit positions in that security.

3 Liquidity Measures in Options

Market Makers Liquidity

Before determining the spread of an option (or any security), a market maker considers several liquidity factors. Three of these are:

  1. Volume: How many option contract have been traded so far on any given day.

  2. Open Interest: How many contracts are outstanding in an option.

  3. Bid/Ask Size: How many contracts are bid/offered at that price. 

The higher the volume and the more open interest an option has, the easier a market maker can exit the position they just bought or sold from you. 

Remember, market makers have to exit positions as well! If markets are illiquid, they are going to widen out the spreads to make up for the risks of holding a position in an illiquid market. 

How Market Makers Hedge

Market makers don’t generally turn around and immediately sell an option they bought from you. They’ll have to wait a bit for another trader to come around and give them a good price. So how do they hedge the risk of holding options?

Let’s take a look at an example to find out.

We’ll say AAPL just reported horrible earnings, and every trader out there is trying to sell their call options. A market maker in AAPL must therefore buy these options to fulfill their duty as a liquidity provider. 

This will result in a boatload of long call options for the market maker. That’s a lot of risk! How do market makers offset this risk?

Delta and Gamma Hedging

To mitigate this risk, a market maker keeps an inventory of either long or short stock. How much stock? That depends on their position “delta” and “gamma“.

Δ β θ Read! Introduction To The Option Greeks

For example, if an out-of-the-money call option has a delta of 0.84, that means this contract trades like 84 shares of stock. To offset this risk, a market maker would sell 84 shares of stock.

Sometimes, in volatile markets, a lot of stock must be purchased or sold for a market maker to offset their risk. This can cause stock prices to both soar and tank in value. Market makers hedging their short call options with long stock is the reason many meme stocks soared in value in 2021. This rare market condition is called a gamma squeeze

If you’d like to read more about delta hedging (which both market makers and traders utilize), read our article, Delta Hedging Explained (Visual Guide w/ Examples)

How Do Market Makers Make Money In Payment for Order Flow?

Retail traders are not known for their market savviness. Market makers want retail order flow, particularly in options. Why? The bid/ask spread in options is much wider than in stocks. 

Market makers want this order flow so bad, that they are willing to pay brokers for the right to fill their customer’s orders. 

This is known as payment for order flow. 

Every time you send an order through your broker (unless your broker internalizes their order flow), an auction takes place between your broker and numerous market makers to see who gets to fill your order. 

In these flash auctions, the best bid/offer wins. Payment is sent from the market maker to the broker for filling the order, and the customer is filled.

Market makers do not get paid here – the brokers (like thinkorswim, Robinhood, or tastyworks) do. Market makers make their money in “arbitrage” by trading the products they are specialists for. 

Read: 💲 Payment for Order Flow Explained Simply (w/ Visuals)

Who Are the Largest Options Market Makers?

Although there are many market-making firms, two, in particular, dominate the space: 

  1. Citadel Securities
  2. Virtu

So what percentage of volume do these two firms take from the stock and options markets? The below image, from the Financial Times, shows just how much.

Market makers can be small independent businesses or large hedge funds. In the modern era, hedge funds are taking business from the smaller market makers. You must be very well capitalized to compete in this space!

What Is the Difference Between a Market Maker and a Broker?

With a few rare exceptions, (such as Interactive Brokers), retail brokers do not act as market makers. These two business models provide completely different services. 

  1. Brokers act as intermediaries by facilitating trade orders from both buyers and sellers by bringing together assets.

  2. Market Makers are dealers in securities who provide liquidity to a market by buying and selling that market’s securities at all times. Market makers provide trade execution.

Option Market Makers FAQs

Market makers provide liquidity by both buying and selling options of all types, including call and put options. To offset the risk from selling call options, market makers must purchase stock. This can result in a gamma squeeze. 

In order to adequately mitigate their risk, market makers in options must hedge their positions by either buying or selling shares of stocks. This can lead to fluctuations in the underlying share price, which some believe to be manipulation.

Market makers buy options to satisfy the market. As liquidity providers, the role of the market maker is not limited to buying options – they must stand ready to both buy and sell all options strategies to fulfill their obligation. 

Next Lesson

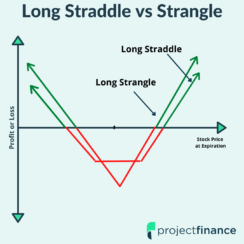
Options Straddle vs Strangle: How Do They Differ?

The straddle and strangle options trading strategies are very similar in nature. 

Both of these strategies allow investors to profit from large moves in an underlying security (long straddle/strangle) and neutral markets (short straddle/strangle).

The difference between the straddle and strangle lies in the strike price structure:

➥ The straddle only uses one strike price.

➥ The strangle uses 2 strike prices.

So what does this mean when comparing the performance of these two option strategies? Let’s find out!

              TAKEAWAYS


  • Both the long straddle and long strangle allow traders to profit from large upside and downside swings in a stock.

  • Short straddles and strangles allow investors to profit when the price of an underlying stock/ETF/index fluctuates very little over the duration of the options life.

  • The straddle has a higher degree of risk than the strangle.

  • Short straddles and strangles benefit from time decay (theta); theta works against long straddles and strangles.

  • Straddles and strangles are often sold around earnings to benefit from “vol crush”.

What Is An Options Straddle?

Long Straddle Video

Short Straddle Video

The options straddle strategy consist of two inputs:

  1. Buy/Sell 1 ATM Call Option.
  2. Buy/ Sell 1 ATM Put option.

To be a straddle, both options must be of the same strike price and expiration; the only difference is in the type of options. A straddle consists of both a call option and a put option

Buying at-the-money (ATM) call and put options will result in a long option straddle. Here is the profit/loss graph of this strategy at expiration.

Long Straddle

long straddle

Selling at-the-money (ATM) call and put options will result in a short options straddle. Here is the profit/loss graph of this neutral strategy at expiration.

Short Straddle

Short Straddle

Let’s next break own the various scenarios under which both the long and short straddle will profit, break even, and lose money. 

Straddle: Profit, Breakeven and Loss Scenarios

Long Straddle Short Straddle

Maximum Profit

Unlimited

Total premium received

Maximum Loss

Total debit paid

Unlimited

Breakeven Point

1) Strike A plus the net debit paid.

2) Strike A minus the net debit paid.

1) Strike minus the net credit received.

2) Strike plus the net credit received

Time Decay Effect (Theta) 

Sheds value as time passes, resulting is losses

Sheds value as time passes, resulting in profits. 

What Is An Options Strangle?

Long Strangle Video

Short Strangle Video

The options strangle strategy consist of two inputs:

  1. Buy/Sell 1 OTM Call Option.
  2. Buy/ Sell 1 OTM Put option.

The strangle is like the straddle in that this strategy too involves purchasing/selling both a call option and a put option of the same expiry cycle on the same underlying. There are, however, some pretty big differences. Let’s learn them next!

Options Straddle vs Strangle: Trade Setup

Straddle vs Strangle Difference #1: Moneyness

➥ The straddle generally involves purchasing at-the-money options.

➥ The strangle involves purchasing out-of-the-money options.

Straddle vs Strangle Difference #2: Strike Prices

➥ In the straddle, both options purchased are of the same strike price.

➥ In the strangle, the options purchased are of different strike prices. 

Let’s next take a look at the profit/loss graph of both a long strangle and a short strangle!

Long Strangle

long strangle at expiration

Buying an out-of-the-money call and put option with different strike prices of the same expiration cycle on the same underlying security will result in a long strangle, as visualized above.

Short Strangle

short strangle chart

Selling an out-of-the-money call and put option of the same expiration cycle on the same underlying security with different strike prices will result in a short strangle, as visualized above.

Let’s next break down the various scenarios under which both the long and short strangle will profit, break even, and lose money. 

Strangle: Profit, Breakeven and Loss Scenarios

Long Strangle Short Strangle

Maximum Profit

Unlimited

Total premium received

Maximum Loss

Total debit paid

Unlimited

Breakeven Point

1) Strike A minus the total debit paid.

2) Strike B plus the total debit paid.

1) Strike A minus net credit received

2) Strike B plus the net credit received

Time Decay Effect (Theta) 

Sheds value as time passes, resulting is losses

Sheds value as time passes, resulting in profits. 

Option Straddle Trade Example

Let’s first check out a straddle on Apple (AAPL).

➥AAPL Stock Price: $180

➥Days to Expiration: 10

➥Put Option Strike: 180

➥Put Option Premium: 1.49

➥Call Option Strike: 180

➥Call Option Premium: $1.51

So we can see here that the total cost (or credit) from this trade will be $3 (149 + 151).

Let’s fast-forward 10 days to expiration and see how this trade did. 

➥AAPL Stock Price: $180 –> $190

➥Days to Expiration: 10 –> 0

➥Put Option Strike: 180

➥Put Option Premium: 1.49 –> 0

➥Call Option Strike: 180

➥Call Option Premium: $1.51 –> $10

So how did we do? We must first determine which side of the trade we took.

Like all options strategies, the straddle can be both bought and sold. Let’s first see how the short side performed.

Short Straddle Trade Results

The initial price of our above straddle was $3. If we sold this straddle, we will profit as long as the combined value of both our short call and short put is trading under $3 at expiration.

At expiration, we can see that AAPL rallied $10 a share, all the way up to $190/share. 

This was good news for our short put. It fell in value from $1.49 to 0.

However, our short call did not fare as well. Since AAPL closed at $190 on expiration, our short call was in-the-money by $10, resulting in a final intrinsic value of $10. 

This means we lost $10 here. 

But remember, we took in a credit of $3 initially. Therefore, our total loss at expiration would be $7 ($10-3). Taking into account the multiplier effect of 100, this would result in a loss of $700.

Long Straddle Trade Results

If you understand how the short straddle works, you should have no problem understanding how the long straddle works. 

For the long straddle, we would have purchased both options originally for $3. This net debit paid is also our max loss. 

At expiration, the combined value of the put (worth $0) and call (worth $10) was $10. Remembering we paid $3 initially for this trade, the profit to us here is $7 (10-3), or $700.

This should make sense – if selling this strategy lost $700, buying it must make $700.


Option Strangle Trade Example

Let’s now check out a strangle on Netflix (NFLX).

➥NFLX Stock Price: $390

➥Days to Expiration: 20

➥Put Option Strike: 385

➥Put Option Premium: $16.10

➥Call Option Strike: 395

➥Call Option Premium: $15.90

So we can see here that the total cost (or credit) from this trade will be $32 (16.10 + 15.90).

Let’s fast-forward 10 days to expiration and see how this trade did. 

➥NFLX Stock Price: $390 –> $388

➥Days to Expiration: 20 –> 0

➥Put Option Strike: 385

➥Put Option Premium: $16.10 –> 0

➥Call Option Strike: 395

➥Call Option Premium: $15.90 –> $0

In this trade outcome, the price of NFLX did not move very much. This should tell you right away that selling options would be probably more profitable than buying options. 

Short Strangle Trade Results

At expiration, the combined value of both our short put and short call is $0.

Why? The stock closed at $388. Our 385 put is therefore out-of-the-money and valued at $0. Our 395 call is also out-of-the-money and also valued at $0.

What does this mean for us? We will collect the full premium of $32 received. Taking into account option leverage and the multiplier effect of 100, we will net a profit of $3,200 on this trade!

Long Strangle Trade Results

Since selling this straddle resulted in a profit of $32, the long party must have lost $32.

In order to establish this long strangle position, a trader paid a net debit of $32. If at expiration both of these options are worthless, this will translate to a complete loss of $32, or $3,200. Ouch!

Is The Straddle or Strangle Safer?

  • Neither the short straddle nor short strangle are safe strategies on account of their short call composition.
  • The short strangle has marginally less risk on account of its dual out-of-the-money structure.

  • Long strangles are generally cheaper to buy than long straddles. 
  • Since long strangles require a smaller net debit than long straddles, the maximum risk on long strangles makes them marginally safer than long straddles – probability aside.

When Should You Buy Strangles and Straddles?

Long straddles and strangles are best suited for traders who believe a stock is going to go up or down by a significant amount before the options expire.

 Both of these strategies are directionally agnostic. This simply means (for longs) we don’t care whether the underlying goes up or down, so long as it moves. The opposite is true for short positions in these strategies

Though long straddles cost more than long strangles, their chance of success is greater. Why? Both options bought are at-the-money. With long strangles, both the options bought are out-of-the-money, requiring the underlying to move a greater distance to achieve profitability. 

Straddles and Strangles: What's the Risk?

Straddle vs Strangle Risks

➥ For long straddles and strangles, the primary risk is time decay, or “theta”. Options are decaying assets. With every passing day, if the underlying price does not change, long straddles and strangles will shed value.

Since straddles and strangles are comprised of two options, theta occurs on both legs simultaneously in a stagnating market. 

Additionally, the underlying must move by a significant amount to breakeven on these strategies. This is particularly true in options with high implied volatility (IV).

➥ For short straddles and strangles, the risk is dually high. Theta works to the advantage of short options, but when an underlying begins to move significantly up or down, huge losses can occur!

In order to learn more about the risks associated with options, read this article from the OIC

Straddles and Strangles for Trading Earnings

The straddle and strangle are both great options strategies for trading earnings

Nobody knows how a stock will react post-earnings report. 

➥ For traders who believe a stock will make a significant move either up or down, the long straddle and strangle are great strategies to capitalize off this potential move. 

➥ For traders who believe a stock is not going to move very much post-earnings, the short straddle and strangle both allow traders to profit from the resulting “vol crush” (volatility crush) that often follows earnings reports. 

Read: How the “Straddle” Strategy Can Tell Us The “Expected Move” Post Earnings. 

Straddles and Strangles FAQs

Option straddles are comprised of “at-the-money” options. Option strangles are comprised of “out-of-the-money” options. Since out-of-the-money options are cheaper than at-the-money options, the strangle strategy is cheaper to buy than the straddle strategy. 

The riskiest options trading strategy is the short call (naked call). Both the short strangle and short straddle contain a short call and therefore have considerable risk. 

The iron condor is not a straddle. Straddles are comprised of two options while iron condors are comprised of four options. The additional options in the iron condor strategy help to offset risk. 

Next Lesson

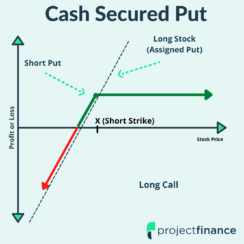
What Is a Cash-Secured Put? Get Income or Cheap Stock

The cash-secured put is a risk-defined options trading strategy that involves the sale of a put option while holding funds on reserve to purchase the stock if/when assignment occurs.

The cash-secured put (also known as the cash covered put) options strategy is attractive to investors for two reasons: 

1.) The cash-secured put provides investors with a steady stream of income. 

2.) When/if assigned, cash-secured puts allow investors to purchase desirable stocks at a discount. 

The cash-secured put has a lot in common with the short (naked) put, with one major exception: the seller of cash-secured puts does not fear the stock falling in value, as it is their intent to purchase the stock at a discount via the exercise/assignment process

In an environment of constant volatility and price, options decay in value. This time decay, known as “theta” is advantageous to both short call and put options

Let’s first break this strategy down by looking at its profile.


              TAKEAWAYS


  • The cash-secured put is a neutral to bullish options trading strategy.

  • In order for this trade to be “cash-secured”, the cost of the trade will be the cost to purchase 100 shares of the underlying stock at the strike price of the put sold.

  • The cash-secured put is an investment strategy that allows an investor to buy an attractive stock at a lower purchase price. 

  • If/when assigned, the short put will be replaced by 100 long shares of the underlying stock/ETF.

  • Traders who are very bullish on an underlying
     would be better off by simply buying the stock outright. 
Cash Covered Put

Market Direction

All Market Directions (depending on trade intent)

Trade Setup

Short 1 ATM/OTM Put Option 

Maximum Profit

1.) On the short put, max profit is the credit received.

2.) If assigned to stock, max profit is unlimited. 

Maximum Loss

1.) On the short put, max loss is strike price minus the premium received.

2.) If assigned to long stock, the max loss is unlimited. 

Breakeven Point

Strike price minus the premium received for the put.

Trade Cost (Margin)

Cash Account: (strike price) × (number of contracts) × (option multiplier)

Margin Account: Varies by broker (lower than cash account)

What are Cash Secured (Covered) Puts?

The cash-secured put strategy has two components:

1.) Selling a put option contract

2.) Setting enough money aside to purchase stock at the strike price of the put should assignment occur. 

Determining the “moneyness” state of the put option you wish to short is subjective. Generally speaking, the strike price of put options sold in this strategy will be either:

1.) At-The-Money

2.) Out-Of-The Money

The cash-secured put is unique in that most traders of this strategy want their option to be assigned. This allows the stock to be purchased at a lower cost basis. 

However, even if assignment does not occur, the income from selling the put will still be collected, resulting in a win-win scenario. 

For example, if Ford stock (F), is trading at $15/share, and an investor wished to buy this stock at $13/share, that investor could sell the $13 put option at a later expiration cycle

If the stock closes above $13/share at expiration, the option will expire worthless. 

If the stock is trading below $13 at expiration, the short put will be assigned, and that investor will purchase 100 shares of F stock at the lower price of $13/share.

Cash Secured Put Risks

Risk #1:

We mentioned before that the cash-secured put is often a “win-win” trade. This does not mean that there is no risk in this options strategy

Most of the time, traders utilize this strategy when they want to purchase a stock at a discount from its current market price. If the stock price remains neutral, a trader will receive income from the option(s) sold. If the stock price declines below the strike price by expiry, that trader will purchase the stock at a better price.

But what if the stock is neither neutral or bearish, but bullish?

Cash Secured Put Chart

A trader could very well miss out on the price appreciation of a stock while waiting for it to fall in value, collecting only a relatively small amount of income from the put option sold

Risk #2

The second risk that the cash-covered put introduces pertains to the option itself. If a trader sells a $15 strike put, but that stock crashes to $10 in value, that trade will result in significant losses. Cash-secured puts are rarely sold on stocks that experience high volatility or this reason. 

Sure you’ll buy the stock for cheaper, but you’ll also lose a ton of money on the option. The “wait-and-see” approach is best for more volatile stocks. 

But enough theory, let’s see the cash-covered put in practice!

Cash Secured Put Trade Example

In this trade example, we are going to look at a cash-secured put on GoPro (GPRO). I prefer to use this strategy on cheap stocks. The cost of the trade is low, and if assignment occurs, it won’t eat up all your cash to hold the 100 shares.

Trade Details:

GPRO Stock Price: $8.40

Put Option Strike Price: 8

Credit Received: 0.25

DTE (Days to Expiration): 35

Breakeven: $7.75 (Strike Price – Premium)

Maximum Potential Profit: 0.25 ($25)

Maximum Potential Loss: $775 (Strike Price 8 – Premium 0.25)


We are next going to examine this trade through two different outcomes; one will be a desirable outcome, the next outcome will be less than desirable. 

Cash-Secured Put: Outcome #1

Trade Details:

GPRO Stock Price: $8.40 –> $7.50

Put Option Strike Price: 8

Put Value: 0.25 –> 0.50

DTE (Days to Expiration): 0


Cash Secured Put at expiration 5

In this trade outcome, the price of GPRO has fallen in value below the strike of our short put. If at the expiration date the stock price is below the short put strike, you will be assigned. The below image shows the exercise/assign process:

Assignment/Exercise Process

In The Money Option at Expiration

Here are the sequential steps that will happen to our GPRO trade if our option is in-the-money at expiration.

1.) The long party will exercise their long put option and receive -100 shares of stock; the short party (us) must therefore deliver this stock at $8/share. 

2.) Our short option is replaced by 100 long shares of GPRO stock for a cost of $800 (the true cost of this trade is $775 since the trade took in $25 in premium).

3.) If funds are not available to hold this stock, an account will be either placed in a margin call or liquidated. 

For cash-secured puts, the third outcome rarely happens. Why? Cash-secured means that a trader already has the funds placed on reserve to hold the stock. They are anticipating this to happen.

Cash-Secured Put: Outcome #2

Trade Details:

GPRO Stock Price: $8.40 –> $10

Put Option Strike Price: 8

Put Value: 0.25 –> 0

DTE (Days to Expiration): 0

In this trade outcome, the stock has risen well above our short strike price at expiration. This means there is zero chance of assignment. 

The good news? This trade collected the full premium of 0.25 ($25).

The bad news? We would have made a lot more money if we had just purchased the stock!

At the time of trade origination, the stock was trading at $8.40. At expiry, it was trading at $10/share. 

Had we just bought 100 shares of stock initially, we would have made $160 ($1.60 x 1 00) which is significantly less than the $25 we actually made. 

How Much Money Do You Need for a Cash Secured Put?

Cash-Secured Puts Trade Cost: (strike price) × (number of contracts) × (option multiplier)

For any account type, trading cash-secured puts is a costly endeavor. 

Cash-covered puts are backed 100% by cash. The cost of the trade is the cost to purchase the stock at the strike price. This means that if a stock plummets to zero, a cash-secured put trader already has those funds in their account to cover these losses. Let’s look at two examples:

➥AMZN: Short 2700 Put for $2 

amzn cash secured put buying power

So in this scenario, we must have the cash to purchase 100 shares of AMZN stock at $2,700/share. That’s a cost of $270,000. 

We can reduce the credit from this cost, but that credit is very small in the scheme of things, resulting in a true cost of $269,800

One of the great disadvantages of the cash-secured put is opportunity cost: what else could you be doing with that money? 270k is a lot of money to have on the sidelines! This is particularly true when you factor in the average return of the S&P 500 is over 10%/year.

That’s why cash-secured puts are usually sold on cheaper ETFs and stocks:

NOK: Short 4 put for $0.25

nok buying power

Sure you can only make $25 here, but the cash requirement for this cheap trade is only $400, or $375 when taking into account the option premium already received.  

Is a Covered Put the Same as a Cash Secured Put?

The cash-secured put is NOT the same strategy as the covered put.

While the cash-secured put is simply a short put option, the covered put option strategy consists of:

  • 100 Short Shares of Stock
  • Short One Put Option

The product of these two positions makes the covered put a bearish options strategy.

The cash-secured put is a neutral/bullish options strategy.

Additionally, the covered put strategy has unlimited risk, while the cash-secured put has defined risk. 

The below image shows the profit and loss of a covered put trade at expiration.

Covered Put Chart

Are Cash Secured Puts a Good Strategy?

So is the cash-secured put a good strategy? Like everything in options trading, that depends on the performance of the underlying!

If you are neutral to bearish in the short term, but bullish in the long-term, the cash-secured put is a great strategy to purchase an attractive stock or ETF at a discount. 

If you are bullish in the short-term, you best bet is to avoid this strategy and simply purchase the stock. 

Cash-Secured Put + Covered Call Strategy = The Wheel

Some traders like to utilize both the cash-secured put trade and covered call options strategy in sequential order. This is known as “The Wheel” options trading strategy

The Wheel strategy involves always being short an option. Once the short put is assigned, a trader would then proceed to sell a call against the long shares.

Here’s how that process works:

Can I Sell Put Options in My IRA?

The cash-secured put is a risk-defined trade and therefore permittable in both IRA accounts and cash accounts. 

However, just because the trade is allowed in these account types does not necessarily mean your broker will permit them.

Because of the risks that options trading introduces, many brokers limit or outright ban options trading in retirement accounts. 

However, a few trader-focused brokers, like tastyworks, allow options trading in IRA accounts.

Cash Secured Put vs Short Put

The cash-secured put is essentially the same trade as the naked put. The only difference is the cost of the trade.

Consider the cost of the below two short puts trades in FB, where one is done in an IRA account and the other done in a margin account:


Cash-Covered Put: Margin Account

Cash-Covered Put: IRA Account

As we can see, the cost of this trade is significantly higher in IRA and cash accounts than margin accounts. Why? IRA accounts don’t allow you to trade options on margin. 

One of the greatest risks that come with the cash-covered put is opportunity cost. What else could you be doing with that 20k while you are waiting to collect a small premium?


Cash Secured Puts FAQs

To close a cash-secured put, simply create the opposite order that was used to initiate the trade. If no action is taken and the cash-secured put is out-of-the-money at expiration, the short put will expire worthless. If the short put is in-the-money at expiration, the short put will be assigned 100 long shares of stock.

If the stock on which a put is sold increases in value, a short put option will decline in value, resulting in profits. If the stock is above the strike price of the put sold by expiration, the put option will expire worthless. 

The cash-secured put is a relatively safe strategy. At trade initiation, the full cost of the trade, or the maximum loss potential, is staked by the investor. This makes the cash-secured put a defined-risk trade. 

Next Lesson

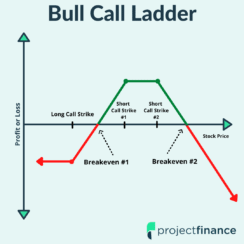
Long (Bull) Call Ladder Options Strategy: Visual Guide

Long Call Ladder Spread
Bull Call Ladder

             TAKEAWAYS


  • The long call ladder (AKA bull call ladder) is comprised of a traditional long call spread with an additional out-of-the-money call sold.

  • Maximum loss on the long call ladder strategy is infinite.

  • Maximum profit for the long call ladder spread is Middle Short Strike Price – Strike Price of Long Call – Total Debit Paid.

  • Max profit occurs when the underlying security is trading between the strike prices of the two calls sold.

  • Due to the 1×2 long call to short call ratio, the margin is very high for all ladder trades.

The long call ladder (also known as the bull call ladder), is a moderately bullish options trading strategy.

The long call ladder has a lot in common with the bull call spread (long call spread), with a few very important differences.

The chief distinction between these two strategies lies in the risk involved. While the bull call spread is a defined risk strategy, the bull call ladder has unlimited risk

This unlimited risk lay in the structure of the ladder strategy, which consists of one long call and two short calls. Whenever you have unhedged calls, your risk is infinite.

Let’s break the strategy down!

Bull Call Ladder Profile

Long Call Ladder

Market Direction

Moderately bullish

Trade Setup

Long 1 ITM Call
Short 1 ATM Call
Short 1 OTM Call

Maximum Profit

Middle Short Strike Price - Strike Price of Long Call - Total Debit Paid.

Occurs when the price of the underlying asset is trading between the strike pries of the two short calls at expiry.

Maximum Loss

 Maximum Loss #1: When stock is below long call strike price at expiration, max loss is net debit paid.

 Maximum Loss #2: When stock rallies beyond the highest strike price sold, max loss is infinite

Breakeven Point

1.) Upper Breakeven: Upper Strike + Middle Strike - Lower Strike - Premium Paid

2.) Lower Breakeven: Long Call Strike Price + Total Debit Paid

Bull Call Ladder vs Bull Call Spread

The best way to understand the ladder strategy is by comparing it to the traditional bull call spread

The bull call spread is a bullish, defined-risk, limited profit options strategy. The below graph shows the profit/loss profile for this trade at expiration:

Bull Call Spread

The bull call spread consists of two call options: 

  • Long 1 Call Option at Lower Strike Price

  • Short 1 Call Option at Higher Strike Price

Since we are both long a call and short a call option in the same expiration date cycle, this strategy has defined risk: the most we can lose is the debit paid to enter the trade. 

But what if you believed a stock was indeed going to go up, but not past a certain level? Couldn’t you sell an additional call at this level in order to generate a little extra income from the trade?

In options trading, you can do whatever you want. You can combine as many calls and puts and expiration cycles as you desire. 

So what would this graph look like if we decided to add an extra short call at the end of this trade?

Long Call Ladder Visualized

The below image shows a traditional bull call spread with an extra short call added at the tail end. The result? The long call ladder (or bull call ladder).

Bull Call Ladder
  • Long 1 Call Option at Low Strike Price

  • Short 1 Call Option at Middle Strike Price

  • Short 1 Call at High Strike Price

I like to think of the bull call ladder as the greedy man’s long call spread. If you are not content with the maximum profit from the original call spread  (Strike Price of Short Call – Strike Price of Long Call – Net Premium Paid) you could sell an extra call.

This third short call must my further out-of-the-money than the first short call sold. 

As long as the stock stays between the strike prices of your short calls, you will achieve both the maximum profit from the original spread (equation above) and the credit received from that extra out-of-the-money call you sold. 

The downside? Your risk is now infinite, as illustrated in that downward-sloping red arrow in the above chart. 

Let’s take a look at an example next.

Long Call Ladder Trade Example

In this example, we are going to look at a long call ladder on Apple (AAPL) stock. Here are our trade details.

AAPL Long Call Ladder:

  • AAPL Stock Price: $170
  • Days to Expiration: 9
  • Long Call Strike/Debit: 170/$2.95
  • Short Call #1 Strike/Credit: 175 / $0.96
  • Short Call #2 Strike/Credit: 180 / $0.27
  • Net Debit: (2.95-0.96-0.27) = 1.72
  • Lower Breakeven: $171.72
  • Upper Breakeven: $183.28
  • Max Loss: Infinite
  • Max Profit: $328

So we bought the 170/175 call spread for $1.99 (2.95-0.96), then tacked on an extra short call for 0.27. This extra credit received reduced the cost of our trade by 0.27, bringing the new trade debit down to $1.72. Don’t get too overwhelmed by the numbers. 

Our maximum profit here is simply the width of the traditional call spread (5 points), minus the net debit paid (1.72). This gives us 5 – 1.72, or maximum profit potential of $3.28. 

Since we have a naked short call, our maximum loss is infinite on the upside, but limited to the cost of the trade on the downside. 

To help better understand our trade, let’s analyze it visually:

As we can see, we will achieve maximum profit when AAPL is trading between about 175 and 180 on expiration.

For breakeven, we can expand these bounds to $171.72 and $183.28.

Let’s fast-forward to expiration day and see how our trade did!

Winning AAPL Long Call Ladder at Expiration

  • AAPL Stock Price: $170 –> $175
  • Days to Expiration: 9 –> 0
  • Long Call Strike/Debit: 170/$2.95 –> $5
  • Short Call #1 Strike/Credit: 175 / $0.96 –> $0
  • Short Call #2 Strike/Credit: 180 / $0.27 –> $0
  • Spread Value (5 + 0 + 0) = 5

If on expiration day at the close AAPL is trading at $175, we will have achieved maximum profit on the trade of $328. Why?

Our long 170 call has increased in value from $2.95 to $5. That’s a profit of $205. Additionally, both of the calls we sold expired worthless (one was at-the-money at expiration, which we will call worthless for simplicity). The credit we received for these calls was $0.96 + $0.27. That gives us a credit received of $1.23, or $123.

So what is a profit of $205 plus a profit of $123? $328. 

But what if this trade didn’t go our way? What if AAPL kept rising inexorably in value? Let’s check out that trade outcome next.

Losing AAPL Long Call Ladder at Expiration

We said before that the long call ladder is a moderately bullish options trading strategy. This next hypothetical trade outcome will show why. Here, AAPL has risen in value to $190/share in value on expiration day.

  • AAPL Stock Price: $170 –> $190
  • Days to Expiration: 9 –> 0
  • Long Call Strike/Debit: 170/$2.95 –> $20
  • Short Call #1 Strike/Credit: 175 / $0.96 –> $15
  • Short Call #2 Strike/Credit: 180 / $0.27 –> $10
  • Spread Value (20 – 15 – 10)  $-5

Traditional bull call spreads are great because you always know your maximum loss scenario – the total debit paid. With long call ladders, this can be much more complicated – and risky. 

In this trade example, the short options in our trade have increased significantly in value. If we never added that extra 180 short call, we would have achieved a maximum profit on the traditional call spread component of our trade of $5 ($20-$15 = $5 profit).

But we did indeed sell that extra call. Its value at expiration was $10. That $10 must be subtracted from our profit of $5 on the call spread. The result is a negative spread value of $-5  on expiration. That means we lost $500 on the trade. 

Remember, our maximum profit in this scenario was only $328!

Theta (Time Decay) in Bull Call Ladder Spreads

The bull call ladder has a complicated relationship with the options Greek theta. 

Theta, or time decay, tells us how fast the value of an option declines on a daily basis in an environment of stable stock price and volatility. 

In the bull call ladder:

  • Theta is negative when the underlying is trading both below the lower breakeven and above the higher breakeven.

  • Theta is positive when the underlying is trading between these two breakeven prices.

Bull Call Ladder Spread: Choosing Strike Prices

Perhaps the most important part of trading options is choosing the right strike prices. 

For a lesson on choosing strike prices on vertical spreads, check out our article here

Once you determine the strike prices of the traditional call spread component of the ladder strategy, you must go one step further and choose the strike price of that last, very risky, out-of-the-money call option.

Here are three important reminders in your selection process:

  1. The further an option is sold out-of-the-money, the greater that option has of expiring worthless.

  2. Options sold closer to being in-the-money will result in a higher credit, thus a higher maximum profit potential for the ladder.

  3. Additionally, options sold closer to being in-the-money will have a lower probability of success that out-of-the-money options.

The below image, taken from the tastyworks trading platform, shows the traditional strike price layout on an options chain for a bull call ladder spread. But remember, you can get as creative as you want with options!

Traditional Bull Call Ladder Setup

Bull Call Ladder Spread: Pros and Cons

In order to adequately understand the pros and cons of the long call ladder, we must compare this strategy to the less sophisticated bull call spread. 

👍 Bull Call Ladder Pros

  • When compared to the traditional long call spread, the long call ladder spread expands the profit area by the credit taken in from the extra call.

    Bull Call Ladder Advantages

  • The long call ladder spread also has a lower breakeven price than the long call spread on account of the extra premium taken in.

👎 Bull Call Ladder Cons

  • When compared to the traditional long call spread, the long call ladder spread requires much more margin. This is because the highest strike price call is sold naked. 

Traditional 175/180 Bull Call BP Effect

175/180/185 Bull Call Ladder BP Effect

  • When compared to the traditional long call spread, the long call ladder spread requires much more margin. This is because the highest strike price call is sold naked. Opportunity costs must be taken into account when utilizing this strategy.

Bull Call Ladder Spread: Is It Worth It?

Personally, I do not believe the profit/loss profile of the bull (long) call ladder spread makes the trade worthwhile. 

What we can not quantify here is the anxiety one feels when being in a position that has unlimited loss potential. This is particularly worrying when the maximum profit is capped at a relatively low level. 

When you trade bull call ladder spreads, you are trading naked call option contracts. It is that simple. You can use stop loss orders on that extra short call to mitigate risk, but this by no means removes risk. 

In a nutshell, the bull call ladder is an advanced options trade, and best avoided by beginners.

How strong is your stomach?

*Before trading options, traders should read the Characteristics and Risks of Standardized Options, or the Options Disclosure Document (ODD).*

Next Article

Additional Resources

Poor Man’s Covered Call [The Ultimate Beginner’s Guide]

One of the great benefits of options trading is the strategy customization available to traders.

In this post, you’ll learn a strategy that aims to reduce the margin requirement/maximum loss potential of the covered call options strategy.

What is a Poor Man's Covered Call?

The poor man’s covered call (PMCC) is a bullish options strategy that is an alternative to the covered call strategy requiring significantly less capital to trade.

The PMCC strategy reduces the capital/margin requirement of a traditional covered call by replacing the long stock with an in-the-money call option purchase in a long-term expiration cycle.

In a traditional covered call, an investor:

  • Buys 100 shares of stock

  • Shorts/writes an out-of-the-money (OTM) call option against the shares.

But buying 100 shares of stock requires significant investment.

In a PMCC, the 100 shares of long stock are replaced with an in-the-money long call in a longer-term expiration cycle than the short call.

Buying an in-the-money call option requires less capital than buying 100 shares of stock, reducing the margin requirement and maximum loss potential of the strategy.

The poor man’s covered call strategy allows options traders to gain similar exposure to a covered call at a fraction of the cost of a traditional covered call position.

The PMCC is technically a “diagonal debit spread,” which is a call spread with options in two different expirations instead of one expiration (which is the case for a vertical spread).

How to Set Up a Poor Man's Covered Call (Example)

To set up a poor man’s covered call, a trader will:

  • Buy a deep in-the-money call option in a long-term expiration cycle (90+ days to expiration or DTE as a guideline).

  • Short an out-of-the-money call option in a near-term expiration cycle (fewer DTE than the long call).

Let’s create a real PMCC using AAPL options.

Setting Up a PMCC in AAPL

As of this writing, the current price of AAPL is $164.

To set up a PMCC, a trader could:

1) Buy the 140 call option in the July 2022 expiration cycle (118 DTE), paying $27.65 for the option (capital outflow of $2,765).

Buy the July 140 Call (118 DTE) in AAPL (Share Price = $164)

2) Short the 175 call option in the May 2022 expiration cycle (62 DTE), receiving $3.10 for the option (capital inflow of $310).

Shorting an OTM call in AAPL
Short the May 175 Call (62 DTE) in AAPL (Share Price = $164)

Poor Man’s CC Trade Cost => $2,455 ($2,765 outflow – $310 inflow).

PMCC Trade Cost = Cost of Long Call - Credit from Short Call

If we constructed a normal covered call, we’d need to buy 100 shares of AAPL at $164 (paying $16,400 if no margin is used) instead of buying the July 2022 call.

Traditional CC Trade Cost => $16,090 ($16,400 outflow – $310 inflow).

The significantly lower capital requirement relative to a normal CC is where the poor man’s covered call gets its name.

The above images were taken on tastyworks, our preferred options trading brokerage.

Max Profit Potential

The “simple” maximum profit calculation of a poor man’s covered call is the same formula as a bull call spread’s max profit:

Max Profit: Width of Call Strikes – Trade Cost

 
Here are the trade details from our AAPL example above:

In an exaggerated scenario, if AAPL shot up to $300/share shortly after trade entry, both calls would be deep ITM and would consist mostly of intrinsic value.

The 140 call would have $160 of intrinsic value and the short 175 call would have $125 of intrinsic value. The position’s price would be $35 if both options had no extrinsic value, and the trade’s profit would be $10.45 (trade price increases to $35 from a trade cost of $24.55).

But because the strategy consists of two options with varying expiration dates, the true maximum profit potential depends on how the position is managed.

In a PMCC, the short call expires sooner than the long call. If the PMCC trader allowed the short call to expire OTM and continued holding the long call, they would be left holding a naked long call and therefore have unlimited profit potential.

Max Loss Potential

The maximum loss potential of a poor man’s covered call is the cost to enter the trade.

In the above AAPL example, the total trade cost was $24.55 (a capital outlay of $2,455).

Therefore, the maximum loss of that position would be $2,455.

If AAPL’s share price remained below the call strikes of 140 and 175 through both expiry dates, both options would expire worthless and the trader would experience the following profits and losses on each leg of the trade:

  • Profit of $310 on the short 175 call

  • Loss of $2,765 on the long 140 call

Total Loss => $2,455 (initial trade cost)

Implied Volatility vs. Poor Man's Covered Calls

What’s the ideal change in implied volatility (IV) when trading PMCCs?

The visual below describes the favorable changes in IV when trading PMCCs:

If the underlying stock price moves to or above the short call’s strike price, you want IV to fall.

Why? A decrease in IV is synonymous with a decrease in extrinsic value.

If the stock price rises to the short call strike, the long call will have mostly intrinsic value and little extrinsic value.

A decrease in IV will increase the trade’s profits driven by a drop in the short call’s value that exceeds a minuscule (or no) drop in the long call’s value, as intrinsic value is immune to changes in IV.

If the underlying stock price moves to or below the long call’s strike price, you want IV to increase.

Why? An increase in IV is synonymous with an increase in extrinsic value.

If the stock price falls to the long call strike, the long call and short call will be 100% extrinsic value.

An increase in IV will increase the trade’s price (reducing your loss) driven by an increase in the long call’s value that exceeds the increase in the short call’s value.

Time Decay vs. Poor Man's Covered Calls

Is time decay good or bad for poor man’s covered call positions?

The visual below describes how the position’s theta will change depending on where the stock price is relative to the call strikes:

If the stock price declines to the long call strike, the passage of time will drive losses in the trade (the position will have negative theta).

In this situation, both calls in the trade will consist of mostly or all extrinsic value.

The long call will be notably more valuable than the short call, meaning the long call will lose more value than the short call as time passes (negative theta).

If the stock price increases to the short call strike, the passage of time will drive profits in the trade (the position will have positive theta).

In this situation, the long call will have mostly intrinsic value and little extrinsic value, while the short call will have mostly (or all) extrinsic value.

Since intrinsic value does not decay, owning a deep ITM call with little extrinsic value and having a short ATM/OTM call with purely extrinsic value results in positive theta (profits from time passing).

How to Choose Strike Prices

Selecting strike prices can be an overwhelming process for beginner traders because there are so many options to choose from on the options chain.

Here are some rough guidelines that will help you choose call strikes for your PMCC trades:

1) Buy a call with a delta over 0.75 (a “deep” ITM call) with 90+ DTE.

2) Short a call with a delta below 0.35 (an OTM call) with <60 DTE.

Again, these are rough guidelines that can be adjusted in your specific trades. Don’t interpret the above guidelines as hard rules.

Here’s a visual representation of the target strike prices and days to expiration:

Let’s talk about why these guidelines are helpful.

Guideline #1: Buying a Deep ITM Call With 90+ DTE

Buying a deep ITM call results in owning an option with lots of intrinsic value and little extrinsic value.

Options lose extrinsic value as time passes, which is referred to as “time decay.” Intrinsic value does not decay.

As the owner of the option, we don’t want the option to lose value over time, which means buying an option with mostly intrinsic value won’t experience much time decay.

Compared to an at-the-money (ATM) or OTM call, an ITM call will have a lower theta value, indicating a lower amount of time decay with each passing day.

Longer-term options also have lower theta values than shorter-term options, further protecting us from time decay.

Lastly, by purchasing a call with a delta of 0.75 or higher, the call’s price will change similarly to owning 100 shares, helping us replicate a covered call without an actual long stock position.

Guideline #2: Short an OTM Call With <60 DTE

Shorting an OTM call results in betting against an option with 100% extrinsic value.

Short option traders profit when the option value falls, benefiting from time decay.

An OTM option’s price will fall to zero if it is still OTM at its expiration date.

Shorter-term options decay faster than longer-term options, which is why a shorter-term expiration cycle is used for the short option in a PMCC position.

A call with a delta of <0.35 will have a strike price decently higher than the share price, allowing for more upside profit potential compared to shorting a call that’s closer to the stock price.

Be Careful of the Entry Cost

It is essential that the entry cost is notably less than the width of the strikes.

Otherwise, the position’s max profit potential will be minuscule (or negative).

tastytrade’s guideline is that the trade cost is less than 75% of the width of the strikes. I agree with this guideline.

In our earlier AAPL example, the width of the strikes was $35 and the trade cost was $24.55 (70% the width of the strikes).

The guideline is important because, should the stock price surge, the position’s price will trend towards the width of the strikes.

Because we are trading two options in different expiration cycles, it’s possible to pay more than the width of the strikes:

In the image above, the strike width is $15 and the trade entry cost is $15.22.
 
As a theoretical example, if the stock price shot up to $1,000, the position’s price would end up at $15.00 because the options would be so deep ITM that they’d have almost no extrinsic value.
 
If we paid $1,522 for a position that ended up being worth $1,500 when the stock price surged, we’d lose $22 on a trade we entered to profit from stock price rallies.
 
Listen to tastytrade’s guideline and avoid this situation by only entering positions that cost less than 75% the width of the strikes.

How to Manage a Poor Man's Covered Call

If the short call remains OTM as time passes/expiration nears, the trader can buy back the call for a profit and short a new call in the next expiration cycle to collect more premium and continue the strategy.

Eventually, the trader will need to close/roll the ITM call once it gets close to expiration, but the longer-term call won’t need to be managed as frequently as the shorter-term short calls.

If the stock price surges and both calls are ITM, the trader needs to decide if they want to continue the strategy.

In the case of the stock price being above the short call’s strike, the passage of time will continue to drive profits in the trade.

Once the short call’s extrinsic value drops close to zero, the position will be at its maximum profit potential with the current setup. The trader can then close the entire trade.

How to Close a Poor Man's Covered Call

To close a PMCC position, buy back (cover) the short call and sell the long call. Sell what you own and buy what you’re short.

In our previous example of entering a PMCC in AAPL by purchasing the JUL 140 call and shorting the MAY 175 call, a trader can close the position by:

  • Selling the long JUL 140 call

  • Buying/covering the short MAY 175 call

You can complete these transactions with one order.

If you decide to “unwind” the position with separate orders, start by buying back the short call, then sell the long call.

Early Assignment Risk When Trading PMCCs

Is there early assignment risk when trading PMCCs?

Yes, because there is a short option component in the position.

If the stock price moves above the short call’s strike price, the trader may get assigned short stock if a counterparty trader exercises the call option.

But don’t worry! Assignment risk is low unless the short call is ITM with close to zero extrinsic value, which happens when:

  • The short call option has little time to expiration, and/or:

  • The short call option is deep ITM.

The further ITM a call option is, the less extrinsic value it will have.

The less time to expiration an option has, the less extrinsic value it will have.

So if you’re trading a PMCC and the short call is ITM with multiple dollars of extrinsic value, you do not need to worry about early assignment risk.

The only other thing to watch out for is if the stock has an upcoming dividend payment. In that situation, any ITM short calls with extrinsic value less than the amount of the dividend are at risk of early assignment.

Tax Implications When Trading PMCCs

There are tax considerations that options traders need to be mindful of when trading poor man’s covered calls.

In a traditional covered call, the trader will own 100 shares of stock, which have no expiration date and can be held forever. Once the shares are held for more than one year, any gains on the shares will be taxed at the long-term capital gains rate.

In a poor man’s covered call, the trader uses an ITM call option instead of stock, forcing the trader to sell/roll the long call once it reaches expiration.

If the trader bought a call with 120 DTE, they would need to sell the call before expiration and buy a new ITM call to continue the trading strategy.

Consequently, any gains on the initial call would be taxed at the trader’s short-term capital gains rate because they held the option for less than one year.

Conclusion

The poor man’s covered call is becoming a popular options strategy for those with limited capital.

The strategy significantly reduces the capital requirement (and max loss) of a traditional covered call by replacing long stock with a deep ITM call option. The lower buying power requirement also boosts the potential return on capital.

However, it is much easier to lose 100% of your investment with a PMCC compared to a traditional CC, making it a more aggressively bullish strategy.

Compared to a traditional covered call, a PMCC will require more active management as the strategy is composed purely of options contracts.

There are also greater tax implications when trading PMCCs because each trade component will typically be held for less than one year, pushing all gains into short-term capital gains taxation.

But for those interested in gaining exposure to covered calls with less money, the poor man’s covered call is an option (pun intended).

*Before trading options, traders should read the Characteristics and Risks of Standardized Options, or the Options Disclosure Document (ODD).*

Next Lesson

Chris Butler portrait

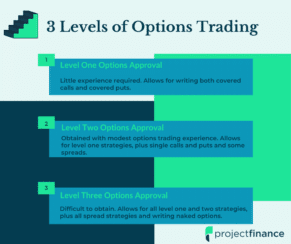
Options Trading Approval Levels: Broker Guide

           TAKEAWAYS

  • In order to trade options, investors must first apply for and be granted options trading approval.

  • Option trading levels vary by the broker; some have only 3 levels of options trading approval (tastyworks) while other brokers have 5 levels (Fidelity).

  • Selling naked options always falls under the last tier, as this strategy has the greatest risk.

  • Brokers look at both a customer’s financial condition and investing history before making a decision to accept or reject an options approval request.

  • If an investor’s request for options trading approval is rejected, that investor can reapply at a later date. 

Options trading can be a precarious endeavor. It is not a “one-size-fits-all” business. 

Certain options strategies, such as the “short call”, introduce traders to infinite risk.

Because of this risk, specific strategies are not suited for everyone. 

In order to protect both customers and brokers from this risk, “Options Trading Approval Levels” were introduced. Investors must apply and be approved for options trading before they can trade even the most basic options strategies. 

Unfortunately, there are no standardized levels of options approval. The broker gets to choose what strategies fall under what tiers. 

To make things more complicated, many brokers have different “tiers” of options approval. Most have 3, but others have 5. You can call your broker and request their specific option approval documentation at any time.


How Do You Get Options Approval?

In order to trade options in your account, you must apply for options trading approval with your broker. Part of this process involves receiving a copy of a publication from the Options Clearing Corporation entitled the “Characteristics and Risks of Standardized Options.”

This document is very important for new traders to read. Among other helpful bits of information, it contains:

It generally takes 1-3 business days for your broker to review and either accept or decline your request. 

What is Required to Get Options Trading Approval?

Just because you apply for options trading approval does not necessarily mean you will get it. According to the SEC, you must meet certain criteria to trade options

Your broker will ask you many personal questions about your trading history and financial condition. Some of these include your:

  • Investment Objectives (capital preservation, income, growth, or speculation)
  • Trading Experience (how long you have traded stocks/options, what size you trade and general investing knowledge)
  • Personal Financial Situation (liquid net worth, total net worth, annual income, and employment status)

A lot of this is very personal indeed! So how does your broker know if you’re making your answers up? They generally won’t. With that being said, to avoid financial ruin, it is best to stick with trading what you know and understand. That is the aim of this process. 

You can always apply later on to “upgrade” your approval after you gather the necessary trading knowledge, or bankroll!

General Option Trading Levels

Before we start comparing the different approval levels offered by popular brokers, let’s review the most common “3 tier” option trading level structure, as well as the different strategies permitted in these levels. 

Please keep in mind these levels are focusing on basic margin accounts; we will get into options trading approval for cash and IRA accounts later on.

Level One Options Approval

Covered calls

Buying call options and buying put options (sometimes)

Level Two Options Approval

● All level one strategies

Defined-risk spreads

● Cash-secured naked puts

Level Three Options Approval

● All level one and level two options strategies.

● Undefined-risk spreads

Naked call and put options

Option Trading Approval Levels by Broker

Brokers are required to create their own option approval levels. Because of this, there are no standardized options trading approval tiers. 

Most brokers currently offer 3 levels of options approval, with “Level 1” being the most basic (covered calls) and “Level 3” the most advanced (selling options naked). However, most traders will find everything they need under “Level 2”.

We can’t list every broker on this list, but we will try and cover the various options trading levels offered by the most popular brokers. 

Tastyworks Option Approval Levels

tastyworks offers three different levels of options trading. Unlike other brokers, they use more fun verbiage, such as “Limited” (level one) “Basic” (level two) and “The Works” (level three). As we can see below, they offer different features depending on the account type (margin vs IRA).

tastyworks

Fidelity Option Approval Levels

Fidelity has 5 different option approval levels. This makes the process a little more complicated and is just another reason why tastyworks is our preferred broker. 

The below screenshot, taken from Fidelity Investments, shows what is included in their various tiers of options approval. 

Fidelity

E*TRADE Option Approval Levels

E*TRADE has 4 different levels of options trading approval. Like almost all levels on our list, naked options come under the last tier. 

Because of the great risk that comes with selling options, this tier is usually the hardest to get approved for. 

E*TRADE

Robinhood Option Approval Levels

Robinhood has only two tiers of options approval. Additionally, Robinhood does not allow their customer to sell options naked or trade undefined risk spreads! 

The below image shows what options strategies are available at Robinhood and their corresponding tiers:

Robinhood

TD Ameritrade (thinkorswim) Option Approval Levels

thinkorswim/TD Ameritrade (soon to become Charles Schwab) offers four levels of options approval. Like other brokers on our list, the type of options approval you can qualify for at TD will depend on your type of account. 

When compared to IRA and cash accounts, margin accounts always offer more flexibility in terms of strategies. 

Ameritrade

Option Approval FAQs

Many brokers allow for options trading in an IRA account. The strategies offered in IRA accounts are often limited. Since only so much can be contributed to an IRA every year, options strategies with undefined risk are not permitted in an IRA account. This includes selling naked call options. How would an investor compensate their broker if a trade were to move against them beyond the limits of their account value?

Some brokers allow options trading in cash accounts while other do not. When compared to margin accounts, cash accounts approved for options trading have far fewer options in terms of strategies. 

In order to get approved for a higher option trading approval level, you must apply with your broker. Many times, these request are denied due financial conditions or a lack of investment knowledge. However, investors can reapply at a later date. 

Next Lesson