?> May 2022 - projectfinance

Bid Size vs. Ask Size in Options & Stocks Explained

bid size vs ask size

Bid And Ask Size Definition: The total quantity of shares/options that can be sold (bid) or bought (ask) at the current market prices.

In options trading, liquidity refers to the ease at which an option can be opened and closed. Unlike stocks, options can have very wide markets. 

There are numerous measures available for traders to gauge the liquidity of an option. Among these is the “bid size” and “ask size”. 

The bid size tells us how many options we can sell at a quoted price. The ask size tells us how many options we can purchase at a quoted price. 

For those trading large positions, this metric is crucial. In this article, projectfinance is going to show you why. 

Liquidity Measures In Options Trading

Before we get into bid size vs ask size, let’s first review a few other important measures of option liquidity in financial markets. 

  • Option Volume: The number of contracts traded so far on a given day.

  • Open Interest: The number of contracts currently in existence for a particular option.

  • Option Bid-Ask Spread: The difference between the bid price and the asking price.

  • Stock Volume: The number of shares of stock traded on a given day.  

Ideally, you want to trade options with high volume and open interest. Additionally, you want the stock volume to be high as well. Why? 

Market Makers hedge the options they buy and sell with stock. High stock volume generally means the stock is liquid, which means they can hedge easier, therefore giving you better fill prices.

Option spreads (the difference between the bid and ask price) in derivatives should also be tight. I have seen some options with a bid of $1 and an ask of $3. This means, that if you were to get filled on a buy order at the market price, you would lose $2 if you sold immediately. The tighter the spread, the less slippage to you. 

But sometimes option markets can be misleading. A market maker may bid an option at $2, but how many options is that market participant willing to purchase from you at $2? 1? 200?

This is where bid size and ask size come into play. 

Bid Size And Ask Size In Stock

Bid Size Definition: The quantity of a security a market maker or investor is willing to purchase at a specific price. 

Ask Size Definition: The quantity of a security a market maker or investor is willing to sell at a specific price. 

Let’s first look at an example of bid size vs ask size in the stock market. 

aapl bid size ask size

The above image (taken from the tastyworks trading platform) shows the current market for AAPL stock. We can currently sell AAPL for 154.62 and buy AAPL for 154.69.

The spread here is 0.07, the difference between the bid and the ask price. If we were to buy and immediately sell this stock, we would lose 0.04. Of course what we lose, the market maker gains.

But how many shares can we sell at the bid stock price 150.62? And how many can we buy at 154.69? A gazillion?

This is where the “size” of the bid and ask come into play. The current size of AAPL stock is circled in green above. In the stock market, bid size and ask size represent 100 shares of stock. Therefore, a bid size of “1” really means 100 shares. 

In our AAPL example, we can see that there is 300 shares bid at 154.62 and 200 shares offered at 154.69.

Bid Size And Ask Size In Options

Just as with stock, options have bid sizes and ask sizes. Let’s jump right into an example by looking at call options on SPY, an S&P 500 index-tracking ETF

Spy - Bid/Ask Size

In the above options chain, we can see the various bid and ask sizes for different SPY call options with an expiration date of May 11th. 

Unlike stock, the bid and ask sizes for options do not represent 100 contracts. If an option contract has a bid size of 34, that means 34 options are available to sell at the quoted price. 

Bid and ask sizes are in constant flux with the market. If you watch a live options chain on a liquid product like SPY, these numbers will change several times a second.

Bid Size And Ask Size In Illiquid Options

In our above example, we looked at the bid and ask size on SPY, which just happens to be the most liquid security in the world. Let’s now check out the bid and ask sizes on a less liquid security, Ryder System – R. 

Ryder Systems - Bid/Ask Size

R bid ask size

So far today, Ryder Systems has traded 230k of stock. Spy, on the other hand, has traded 40 million. A stock that has high volume is usually indicative of decent option liquidity. 

R is therefore far less liquid than SPY. When comparing the bid/ask size of R with SPY, we can see that R has many more options both bid and offered at various strike prices than SPY.

One may think that more liquid stocks have higher bid/ask sizes, but that is not always the case. Why?

We must look at the actual spread of the options. With SPY, the options are about a nickel wide. R, on the other hand, has spreads ranging from 0.80 to 4 wide! 

Market makers in R, therefore, have a much better chance of profiting in these wider spreads than those in SPY. Because of this, they are willing to both buy and sell greater quantities of options in R than SPY. 

Bid Size And Ask Size: Why It Matters

So why does this matter to you? Let’s jump right into an example to see why. 

Let’s assume you own 10 LEAP call options on AAPL. You are happy with your profits and, not knowing that LEAP options are very illiquid, you place a market order to sell your long calls. 

You see a quoted bid price of 31.40, and presume you will get filled at this price. After hitting send, you discover only one contract was filled at 31.40, while the others were filled at 31.15! Why did this happen?

Because only one contract was bid at 31.40. The others were bid at 31.15. 

So how do we know what the next best price will be? By putting the option code into the trade grid, as I have done below:

aapl bid ask size

This is a perfect example of why it is very important to only use limit orders in options trading. The current ask price and current bid price do not guarantee you will get filled here. This is particularly true in high volatility environments and illiquid products. 

Though you may not get filled right away using limit orders in both buy orders and sell orders, they do ensure the best fill price – if/when you actually get filled. You can even work limit orders downward or upward until you get filled.

Bid Size And Ask Size FAQs

When the ask size exceeds the bid size, this can be a sign that a stock will fall as a result of oversupply. On the other hand, when the bid size is greater than the ask size, this can be a sign that demand is greater than supply. When this happens, the underlying stock price may soon rise in value. 

The ask price is the price at which a market maker is willing to sell you an option. Therefore, this is the price at which you will purchase an option.

The bid price is the price at which a market maker is willing to buy an option. Therefore, this is the price at which you can sell an option. 

Both the ask size and the bid size of options are in constant flux with the market. Market makers determine the quantity at which they will both buy and sell options by looking at factors such as stock price and supply and demand. Because of this, the ask size is rarely the same as the bid size. 

Next Lesson

29 Core Options Trading Strategies For Beginners

Options are incredibly versatile investment products. Calls and puts can be combined in innumerable ways to create custom-tailored options trading strategies.

These strategies can be designed to profit in bearish, bullish, or even neutral markets. 

In this article, projectfinace has compiled a list of 29 core options trading strategies for beginners. To learn more about a particular option strategy, simply click on the image. 

Bullish Options Strategies

Long Call Option

Bull Call Spread

Short Put Option

Covered Call

Bull Put Spread

Cash Secured Put

Collar Spread

Covered Strangle

Synthetic Long Stock

Poor Man's Covered Call

The Wheel Strategy

Protective Put

Long Call Ladder

Bearish Options Strategies

Long Put Option

Bear Call Spread

Short Call Option

Bear Put Spread

Covered Put Write

Synthetic Short Stock

Neutral Options Strategies

Short Iron Condor

Long Iron Condor

Short Straddle

Long Straddle

Short Strangle

Long Strangle

Short Iron Butterfly

Long Iron Butterfly

Long Butterfly Spread

Long Call Calendar

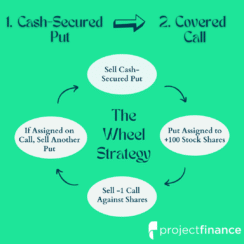
The Wheel Options Strategy: Collect Income From Options

The Wheel Options Strategy

The Wheel Definition: In options trading, the “Wheel” is 4 step strategy that first involves selling a put option. If/when this put is assigned, you will be long stock. The next step is to sell a call option against this stock. If the underlying rises in prices, you will be “called out” on the stock, resulting in a flat position. Repeating this process creates “the wheel”.

The wheel strategy is a great, long-term options trading strategy best suited for traders looking to generate income. In this article, we will review step-by-step how this income strategy profits. 

              TAKEAWAYS


  • The wheel strategy involves selling a cash-secured put, purchasing stock when/if the put is assigned and then selling a call against this long stock.

  • Both the put and call sold are ideally out-of-the-money.

  • The wheel options strategy works best in minorly bullish markets; in very bullish markets, owning the stock outright will be more advantageous. 

What Is the Options Wheel Strategy?

The wheel involves a multi-step, systemic process:

  1. Sell cash-secured puts on a stock you want to eventually own.

  2. When the stock falls below your short put strike price on the expiration date, your short put will be assigned and converted into long stock.

  3. Once in possession of the long stock, sell an out-of-the-money call on this stock.

  4. If/when the stock rallies to the short call strike price on expiration, you will be called out, or “assigned,” leaving you with a flat position.

  5. Re-enter the short put position on the same or another stock.

Let’s now go through the different components of this strategy step-by-step. 

What Is A Cash-Secured Put?

Cash-Secured Put Definition: In options trading, a “cash-secured put” is a short put option that is backed with the full cash amount needed to buy the shares at the strike price. This strategy is both neutral and bullish on the underlying.

Cash-Secured Put Maximum Profit: Premium received from selling put.

Cash-Secured Put Maximum loss: Strike price minus the premium received.

🎬 Watch on YouTube! Selling Put Options For Beginners

You can sell puts in both cash accounts (IRA accounts) and margin accounts. When you sell puts in cash accounts, you must front the entire capital required to purchase the stock should you be assigned. 

In margin accounts, the funds required to hold a “naked” put option are generally the greater of:

  • 20% of the underlying price minus the out of money (OTM) amount plus the option premium

  • 10% of the strike price plus the option premium

Since we anticipate purchasing the stock when the underlying stock price falls below our short put strike price, the wheel strategy must be “cash-secured”.

The Wheel: Cash-Secured Put Example

In this example, we are going to sell a put option of Ford (F). 

Why Ford? Ford is currently trading at $15/share. When you sell cash-secured put options, you need to front the cash to purchase the stock at the strike price. Options are leveraged securities – one contract represents 100 shares of stock. 

It will be very costly indeed to purchase 100 shares of Amazon (AMZN) for its current market price of $2,600/share! This is why I prefer selling puts on cheaper stocks, like Ford.

Here is our trade:

➥ Ford Stock Price: $15

➥ Put Option Strike Price: 14

➥ Put Option Expiration: 37 days away

➥ Put Option Premium (credit received): 0.60 

Cash-Secured Put Trade Outcomes

When you sell a put option, there are two trade outcomes. The stock will either close above your short strike price on expiration or above your short strike price. 

When the stock closes below your short strike price, you will be assigned on your short put. When the stock closes about your short strike price, your short put will expire worthless.

Ford Trade Outcome #1:

➥ Ford Stock Price: $15 –> $15.40

➥ Put Option Strike Price: 14

➥ Put Option Expiration: o days away

➥ Put Option Price: 0.60 –> 0.00

In this example, Ford closed above our short put strike. This means we collect the full premium of 0.60 ($60). Since we won’t be assigned stock, we can not initiate the wheel just yet. We’ll have to sell another put and wait for the stock to fall below the strike price. But we made some money in the process!

Ford Trade Outcome #2:

➥ Ford Stock Price: $15 –> $13

➥ Put Option Strike Price: 14

➥ Put Option Expiration: o days away

➥ Put Option Price: 0.60 –> 1.00

In the second outcome, Ford fell below our short strike price on expiration. This means we will purchase the stock at $14/share (the put’s strike). Since we collected $0.60 when selling the 14 put, our effective share purchase price is $14.00 – $0.60 = $13.40.

With the stock price at $13, we’re technically down $40, which is much better than being down $200 from purchasing the 100 shares at $15.

So what do we do now? To satisfy the wheel strategy, we must sell a call option against the assigned stock!

In order to better understand option premium and risk, read our guide: Implied Volatility for Beginners

What Is A Covered Call?

Covered Call Definition: In options trading, a covered call position is established when an out-of-the-money call option is sold against 100 shares of long stock. 

Covered Call Maximum Profit: Strike price of the short call option minus the purchase price of the underlying stock plus the premium received.

Covered Call Maximum Loss: Stock price minus option premium received.

🎬 Watch on YouTube! Covered Calls For Beginners

Because of its low-risk nature, the covered call is a great strategy for beginners. It is also a great way for traders to collect income from a stagnating stock they own.

If you own the SPY ETF at $400/share, and don’t believe SPY will be trading above $410 in a month, you could sell a 410 strike price call option on SPY expiring in 30 days. 

If SPY is trading below $410 on expiration, you will collect the full premium from the option. If SPY is trading above this price, your short call will be assigned, thereby forcing you to sell 100 shares. The net result? Your position is offset. 

Since we already own the stock, risk is eliminated here from the option. Therefore, we do not need to use margin, or set funds on reserve, to hold a short call when it is sold against long stock. 

The Wheel: Covered Call Example

Let’s now revisit Ford. Remember, in our second outcome, we were assigned on our short put option, leaving us long 100 shares of Ford. The first step of the wheel is complete.

Now, we must sell a call option against the long stock we own.

This call option must be “out-of-the-money.” I’ll provide a visual of option moneyness below. 

option moneyness chart calls and puts

Since Ford was trading at $13/share when we got assigned, the call we sell must be above this price to be out-of-the-money. 

Let’s say we sell the $14 call option on Ford. Here is our trade!

➥ Ford Stock Price: $13

➥ Call Option Strike Price: 14

➥ Call Option Expiration: 30 days away

➥ Call Option Premium (credit received): 0.40

Covered Call Trade Outcomes

Just as with our short put option, our short call has two possible outcomes: 

  1. The short call will expire worthless if out-of-the-money on expiration.

  2. The short call will be assigned short stock if in-the-money on expiration.

Let’s see how our trade did!

Ford Trade Outcome:

➥ Ford Stock Price: $13 –> $14.25

➥ Call Option Strike Price: 14

➥ Call Option Expiration: o days away

➥ Call Option Price: 0.40 –> 0.25

In this trade, Ford rallied from $13 to $14.25 at the time our short call expired. This means our call expired in-the-money. The final premium of the option was 0.25. Since we sold the option for 0.40, we made 0.15 ($15) on the trade!

However, since our option was in the money, we will be assigned on our short call. When assigned on a short call, you must deliver -100 shares of stock. But remember, we were already long 100 shares of stock. 

Therefore, this short assignment will offset our long stock, leaving us with no position in Ford.

To sum up the entire wheel position:

1) Shorted the 14 put for $0.60.

2) Stock fell to $13 and we got assigned on the 14 put, purchasing 100 shares at $14/share. Effective purchase price = $14 put strike – $0.60 put premium collected = $13.40.

3) Shorted the 14 call for $0.40.

4) Stock rallied to $14.25 and we got assigned on the 14 call, selling our 100 shares for $14/share. Effective share sale price = $14 call strike + $0.40 call premium collected = $14.40.

Total Position P/L: ($14.40 effective sale price – $13.40 effective purchase price) x 100 shares = +$100.

Another way to consider this P/L is to calculate the account inflows and outflows.

1) Shorted the 14 put for $0.60: $60 inflow

2) Buy 100 shares @ $14/share via put assignment: $1,400 outflow

3) Shorted the 14 call for $0.40: $40 inflow

4) Sold 100 shares @ $14/share via call assignment: -$1,400 outflow

$100 option inflow – $0 stock outflow = $100 net inflow.

A different way to get to the same conclusion is to consider closing the options at expiration and buying/selling the shares at the current stock prices.

1) Short the 14 put for $0.60, stock drops to $13. Close 14 put for -$0.40 and buy 100 shares at $13.

2) Short the 14 call for $0.40. Stock climbs to $14.25. Close the 14 call for $0.15 profit and sell shares at $14.25.

Stock P/L: $14.25 sale price – $13 purchase price = +$1.25 x 100 shares = +$125

Option P/L: -$0.40 on short put + $0.15 on short call = -$0.25 x 100 = -$25.

Net P/L: $125 stock profit – $25 option loss = +$100.

Same result, different math.

And we’re back to where we started from!

To complete the cycle, sell another put option on Ford, and repeat!

The Wheel And Strike Prices: Which Options To Choose?

In order to be a successful options trader, you must understand the risks. 

Having a fundamental understanding of “The Greeks” will help you accomplish this. 

Delta is the option Greek that tells us how much an option price is expected to move based on a $1 change in the underlying stock.

This Greek also tells us the probability an option has of expiring in-the-money (ITM)

An options chain can be arranged by the Greeks. When choosing your option contract strike prices for both cash-secured puts and covered calls, it is therefore very important to take this metric into consideration when choosing your strike prices for the wheel. 

The below options chain shows the deltas for SPX call options. The orange line represents the at-the-money options. We can see the following strike prices have the corresponding odds of expiring in-the-money:

  • 4140 Call: 60% 
  • 4165 Call: 50%
  • 4185 Call: 42%

deltas the wheel

The Wheel: Is It Worth It?

Though the wheel strategy is a great way to collect passive income, it does indeed require quite a bit of maintenance. 

Additionally, if you’re very bullish on a stock, your best bet is to buy it outright. The wheel takes time and money and underperforms in very bullish markets.

The Wheel Options Strategy FAQs

When choosing stocks for the wheel strategy, there are several factors to consider. If you have a limited amount of capital to work with, it may be wiser to stick with cheap stocks. Implied volatility is also important in this strategy. The higher the implied volatility, the higher the odds the stock will breach both the short put and short call strike price. 

The wheel options trading strategy is most profitable (when compared to simply buying the stock) when the underlying stock is minorly bullish.

If the stock goes up too much, the wheel strategy will lose money when compared to owning the stock outright.

Next Lesson