Last updated on October 27th, 2023 , 06:04 pm
QYLD vs NUSI vs DIY: Which Options ETF Strategy is Best?
Jump To
2022 is proving to be another volatile year. During uncertain markets, it can be wise to diversify your portfolio to both protect profits and generate income from a sideways market. Options based ETFs may provide investors opportunity here.
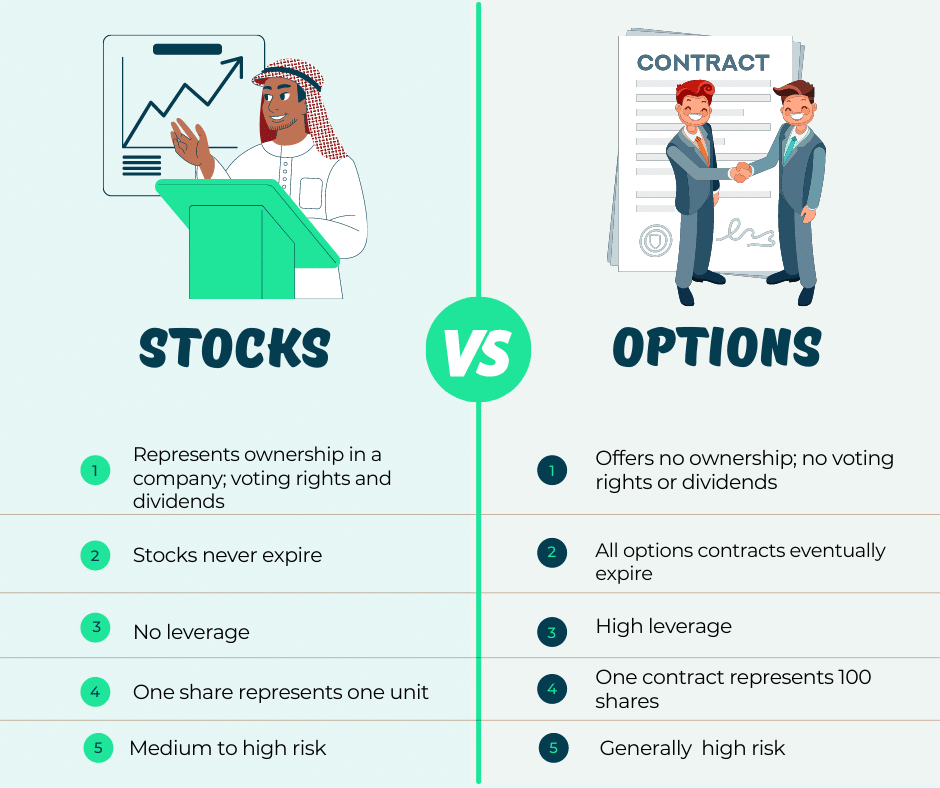
This article assumes the reader has a basic understanding of options trading. If you are new to derivatives, it may help to start by comparing stocks to options.
Additionally, understanding the fundamental difference between calls and puts will be important as well.
TAKEAWAYS
- QYLD utilizes the “covered call” approach on the Nasdaq 100
- NUSI utilizes the “protective collar” approach on the Nasdaq 100
- QYLD pays a higher dividend than NUSI
- Both ETFs will may in a bullish market
(1)")
New to options trading? Learn the essential concepts of options trading with our FREE 160+ page Options Trading for Beginners PDF.
Option Trading Enters the Mainstream
An Explosion in Option Activity
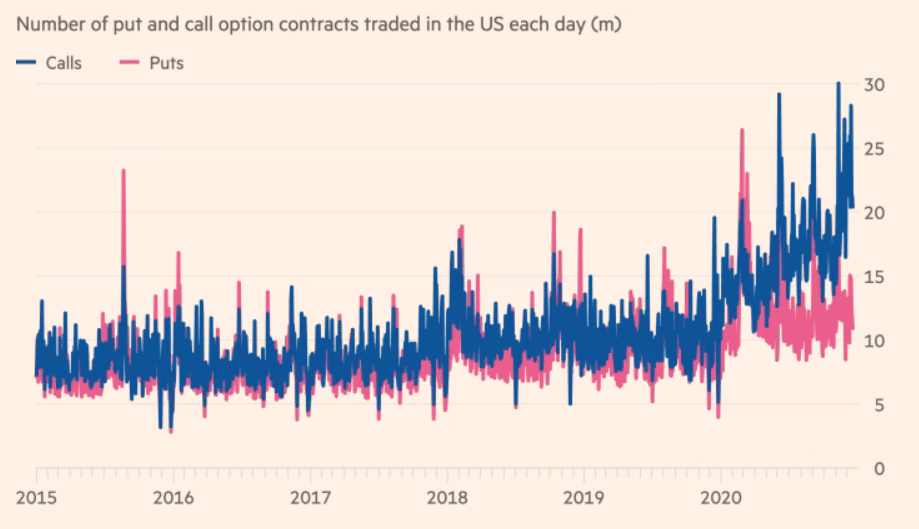
Date from CBOE.com; image from ft.com
When sports betting came to a screeching halt on the tail of the pandemic, risk-takers went searching for other ways to appease their insatiable appetite for gambling. It didn’t take long for them to discover a viable, even seemingly legitimate alternative – options trading.
In 2020, a record 7.47 billion options contracts were traded. That’s about one contract per human on Earth. A lot of money was made and lost over the past year in options markets. In the eye of the mainstream media, options trading has become synonymous with gambling.
Judging from the way most of these new traders utilize the leverage that comes with options trading, their analysis would be correct. The vast majority of these “Robinhood” traders are known in the industry as “premium buyers”.
Premium Buyer Example
An example of a premium buyer is a trader who buys, or “goes long”, a call option on Apple (AAPL). AAPL is currently trading at $135/share. If an option trader believes the price of AAPL will rise to $145 by next month, they could purchase a call option today for that corresponding expiration (we’ll say July 30th expiration since today is June 30th) for a premium of $1.89.
In order for that customer to break even on this trade, AAPL would need to rally to $146.89 in 30 days. This number is the summation of the strike price (145) plus the premium paid ($1.89). The stock needs to go from $135 to $ 146.89 in one month just for that trader to break even. That’s an increase in the price of about 8%. What are the odds AAPL rises 8% in 30-days? Not great.
Using Options to Hedge Risk
Today, the vast majority of options are used as vehicles for market speculation.
This was not the original intent of options trading when the Chicago Board Options Exchange (CBOE) was created in the 1970s. On the contrary actually: stock and index derivatives were actually created as a way for market participants to mitigate risk.
Two such risk-reduction strategies are the covered call and the collar. These strategies are utilized in Global X’s NASDAQ 100 Covered Call ETF (QYLD) and Nationwide’s Risk-Managed Income ETF (NUSI), respectively.
Many investors bundle these ETFs together as the same. This would be a mistake.
There is an ocean of differences between the two. The most important difference is perhaps risk: QYLD has a lot more risk than NUSI.
Why? Let’s break down both of these ETFs so we can better understand the strategies used.
If you already have a working understanding of options, we are going to also examine how a savvy investor can avoid the fees of these ETFs and create a covered call and/or collar position on their own.
- Benchmark: CBOE NASDAQ-100® BuyWrite
- 12-Month Dividend Yield: 12.46%
- Expense Ratio: 0.60%
- 5 Year Return: 9.38%
- Beta: 0.73
Global X, the parent of the Global X NASDAQ 100 Covered Call ETF (QYLD), defines its buy-right (covered-call) strategy as follows:
“The Global X Nasdaq 100 Covered Call ETF (QYLD) follows a “covered call” or “buy-write” strategy, in which the Fund buys the stocks in the Nasdaq 100 Index and “writes” or “sells” corresponding call options on the same index.”
What does this mean? The fund simply buys the stocks within the Nasdaq 100 and sells monthly index (NDX) at-the-money calls against these stocks. Since it tracks the Nasdaq 100, we can use the Nasdaq-100 Index (NDX), or the Invesco QQQ ETF interchangeably as benchmarks. The Nasdaq is composed of primarily growth companies, which is another name for low dividends.
However, the QYLD provides an exceptionally high dividend yield of 12.46%. How is this possible? The fund generates income by selling calls on the index.
Notice the benchmark QYLD tries to replicate. What is interesting about the “BuyWrite Index”, as well as QYLD, is the strike price of the calls they sell. Unlike traditional covered calls, this fund sells calls that are at-the-money. This strategy gives them little upside room in a bull market. The below is taken from the funds “factsheet”.
“The CBOE NASDAQ-100 BuyWrite Index (“BXN Index”) is a benchmark index that measures the performance of a theoretical portfolio that holds a portfolio of the stocks included in the NASDAQ-100 Index (“NASDAQ-100 Index”), and “writes” (or sells) a succession of one-month at-the-money NASDAQ-100 Index covered call options.”
Let’s take a closer look at how covered calls work before we continue.
How a Covered Call Works
A covered call is a financial transaction in which investors write call options against shares they already own (100 shares per contract). As long as the stock price stays below the strike price of the call sold, an investor will collect the full premium of the option sold.
Below are two potential reasons why an investor would use this strategy.
Collect Income: If an investor doesn’t believe a stock they own will rise to a certain point by a certain time, they can sell a call option at this strike price and collect the premium received as income.
Target an Exit Price: If an investor wishes to sell a stock once it reaches a certain level, they can sell a call at this corresponding strike price. Once the stock breaches this level, they will be “called out” of their long shares.
For investors using the covered call as a means of income generation (first example), they will sell a call at a strike price that they don’t believe the stock will reach.
If an investor wishes to sell their stock in the future, they are more likely to sell a call that is closer to being at-the-money, which will act similar to a limit sell order (second example). When the stock reaches that point, their call will be assigned and they will sell their stock. In the meantime, they sit back and collect the income.
The below image is a traditional chart for a covered call that incorporates an out-of-the-money call, where “X” represents the strike price of the call sold.

The QYLD Approach
QYLD uses a different method. They sell at-the-money calls. When you sell an at-the-money call, you greatly limit upside stock potential. That being said, the premium you collect for an at-the-money call is far greater than the premium you receive for out-of-the money calls.
The below represents a chart for a covered call with the sold call being slightly out-of-the money. In reality, the at-the-money green line will be below this line for the at-the-money strategy, but it helps to give you an idea of the structure.
")
This graph shows that QYLD should benefit greatly in a neutral market.
Does the greater premium received by selling an at-the-money call make up for the loss in potential price appreciation? In theory, QYLD was designed to generate income, not appreciate in price. That being said, let’s see how the fund has historically performed in relation to the Nasdaq 100 (as represented by QQQ) by comparing them in Y Charts.
QYLD in a Bear Market
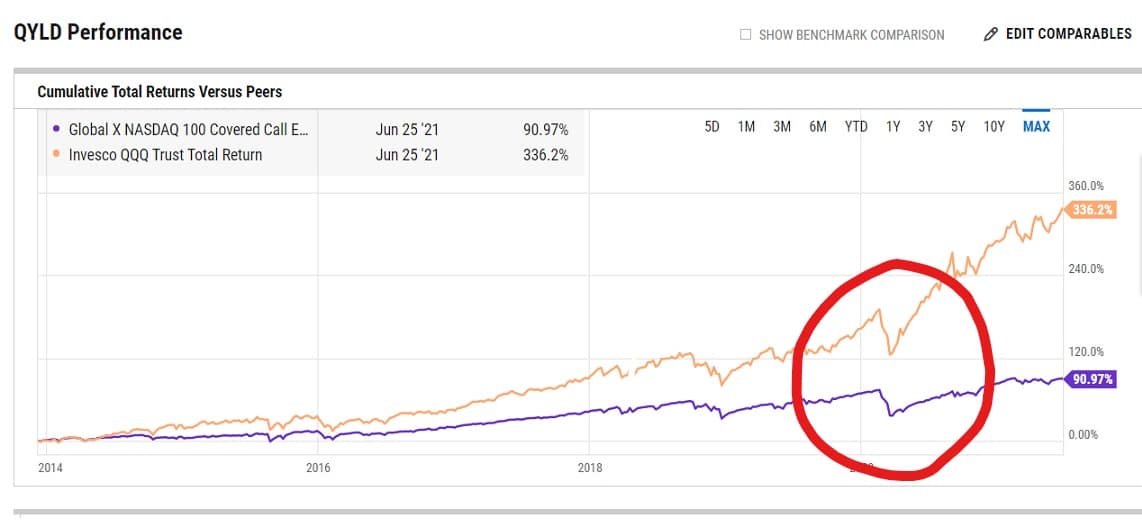
The above chart compares the total returns of QYLD vs QQQ. That means QYLD’s fat dividend is included.
Note that we are comparing QYLD to the QQQ ETF and not its true benchmark, the CBOE NASDAQ-100® BuyWrite. This is a rather esoteric index, and we thought it better to compare QYLD to the unhedged stocks which it tracks.
What is concerning in this chart comparing QYLD to its representative ETF, QQQ, is how poorly QYLD performed on the tail of the pandemic. QYLD took a very large hit, and has only now, over a year later, just barely recovered. Meanwhile, QQQ has been soaring.
Selling covered calls is a great strategy for a market that is either stagnating, minorly bullish, or in a minor correction. When a doomsday scenario hits, like the pandemic, QYLD doesn’t do that much better than its benchmark on the downside. For an ostensibly risk-hedged position, I’d expect more protection.
Why such limited downside protection in a seemingly volatility resilient ETF? The downside protection on QYLD is limited to the premium received from the covered call. Once the market falls by that relatively small amount, you lose money on a penny-for-penny basis with the index.
QYLD in a Bull Market
Not only did QYLD merely mirror the QQQ losses when the pandemic hit, but it also failed to partake in the recovery. We can see this in the area to the right of the dip circled above. Why? The calls that the fund sold were a ballast to the upside potential. When you sell a call, your upside is limited to strike price + premium sold. When the QQQs had some of their huge 5%+ upside months during the pandemic, this fund was limited to a fraction of these gains.
The Future of QYLD?
We are living in strange times. Will market volatility ever subside? If not, QYLD may prove to be a poor investment. We have already proven the fund performs poorly in both very volatile times as well as bull markets.
But let’s say the market does calm down. Many analysts believe the stock market is due for a breather. During a neutral market (which we haven’t seen much of since the fund’s inception) this fund may prove to be very lucrative, surpassing even the total return of the QQQs.
But will that happen? Who the heck knows!
Let’s next take a look at Nationwide’s NUSI fund, which is by far a much more interesting ETF.
- Benchmark: CBOE S&P 500 Zero-Cost Put Spread Collar Index
- 12-Month Dividend Yield: 7.89%
- Expense Ratio: 0.68%
- 1 Year Return: -11.52
- Beta: 0.62
Nationwide’s Risk-Managed Income ETF (NUSI) is a relatively new ETF to the scene, with a fund inception date of December 2019. It is a true capital preserving and income-focused fund with a very low expense ratio (considering the work performed) of 0.68%.
Here is how Nationwide defines its fund:
"An income solution that targets high current income and seeks to provide investors with a measure of downside protection in falling markets and potential for upside participation in rising markets.”
Does that sound too good to be true? Perhaps, but they’ve had a heck of a good run thus far; a 7.89% dividend yield with outstanding downside protection is nothing to sneeze at. How do they do it?
Nationwide’s NUSI ETF has a lot in common with QYLD, with one important difference; NUSI has substantial downside protection. Both QYLD and NUSI provide a source of income by selling calls against the Nasdaq 100, but NUSI goes one step further and buys a put to further hedge downside risk.
This strategy, which involves selling a call and buying a put in combination with long stock, is called a “Protective Collar”.
Let’s take a moment to see how the protective collar works before we continue.

How a Protective Collar Works
The difference between the collar chart above (representing NUSI) and the covered call graph (representing QYLD) is that the red, loss line flattens out with the collar. You’ll notice that the strike price of the long put (X) protects the fund from catastrophic losses. The QYLD ETF, on the other hand, can in theory go to zero. Protective collars, therefore, are a true risk-defined strategy, whereas the covered call provides minimal downside protection.
"Costless" Collar
A collar position can be established so that the premium collected from the short call pays for the long put protection. This is called a “costless” collar because the put doesn’t cost us extra money. Sometimes, you can even collect more from the short call than you pay for the put.
In this case, you are going to receive a net credit from the transaction. That is how NUSI trades collars and is the reason for their generous dividend yield of 7.89%.
I just went through NUSI’s holdings and was able to locate the two current positions constituting their collar:
- Short NDX July 16 14,600 Call for a net credit of 78.45
- Long NDX July 16 12,775 Put for a net debit of 17.30
The net credit here is 78.45-17.30 = 61.15.
And there’s your dividend.
New to options trading? Learn the essential concepts of options trading with our FREE 160+ page Options Trading for Beginners PDF.
2 Advantages of NUSI over QYLD
In addition to having greater protection, NUSI has several more advantages over QYLD. Here are two.
Manager Discretion: A potential advantage of NUSI when compared to QYLD is the discretion the managers have. We’ll remember that QYLD uses a formulaic approach to selling. They sell at the money call options 30 days out. That’s it. NUSI gives their managers more control here. They are not very transparent about the methodologies, but this discretion appears to be working to the fund’s advantage.
Moneyness Structure: NUSI sells out of the money calls (and buys out of the money puts). This call selling strategy gives them more room on the upside when compared to QYLD, which sells at-the-money calls. The 7.89% dividend yield is produced by selling calls that are further out of the money than the puts which are bought.
Let’s next take a look at how the very young NUSI performs over various market cycles.
NUSI in a Bear Market
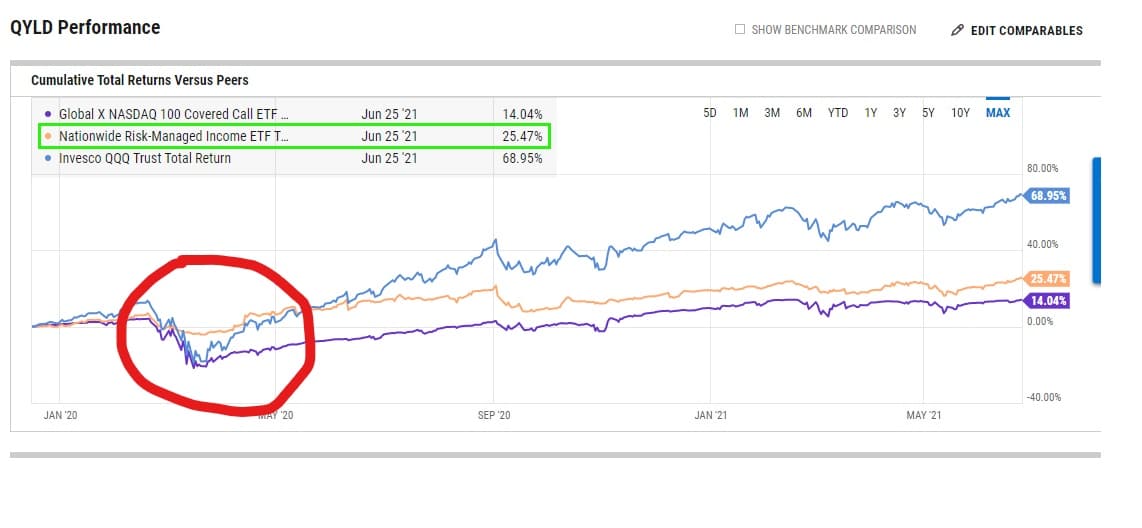
Nationwide’s NUSI is a young fund. It has only truly been tested once, during the pandemic (the orange line in the red circle above). When compared to QYLD and QQQ, it performed superfluously well. The long put hedged the fund against the steep losses the NDX incurred. NUSI performed just beautifully.
I wonder how NUSI will perform over a longer, less volatile bear market. Since it seems to be an adaptive fund, only time will tell.
NUSI in a Bull Market
I was surprised to see that QYLD did not vastly outperform NUSI during the past year. During this time, QQQ skyrocketed (as you can see in blue). Since NUSI is buying puts, shouldn’t that be a drag on their performance relative to QYLD, which doesn’t buy puts at all, but only sells calls?
A possible reason for the superior performance of NUSI could be in the strike price of the calls sold. QYLD, you will remember, sells at-the-money calls. These calls drastically limit upside potential and prevents the ETF from participating in large rallies, as the QQQs have seen this year.
NUSI, on the other hand, sells out-of-the-money calls. This gives them more wiggly room on the upside.
A possible reason for the superior performance of QYLD could be in the strike price of the calls sold. QYLD, you will remember, sells at-the-money calls. These calls prevents the ETF from participating in large rallies, as the QQQs have seen this year.
The Future of NUSI?
It is far too early to tell how NUSI will play out in the years to come. NUSI was created only in late 2019. We know it performs well in very volatile times and holds its own in bull markets. But how adaptive will it be if and when markets calm down? Since the managers have some discretion here, it’s completely in their hands.
It should be noted that the volatility of 2022 has taken a large chunk out of NUSI’s value.
The DIY Approach
For all they provide, the expense ratios for both NUSI and QYLD are exceptionally low. If you were to replicate these strategies on your own, not only would you need the options expertise, but you would also have to pay commissions on options contracts, which adds up over time. Additionally, you’ll need a lot of money.
Both NUSI and QYLD buy every individual stock within the Nasdaq 100 – can you imagine how much time and money this would take to do on your own?
Additionally, there are more risks involved when trading options on your own, such as “pin risk” (when the stock closes right at your strike price on expiration), as well as “dividend risk”, which you always have to keep an eye on when you’re selling calls.
That said, there is nothing preventing you from doing a covered call or a collar on a broad ETF such as QQQ. The at-the-money call selling that QYLD utilizes is not for everyone. If you did it on your own, you could sell that call a little further out of the money, thus making your position slightly more bullish.
If you’d like to learn more about trading covered calls and collar positions on your own, please check out our videos below!
Collar Tutorial
Covered Call Tutorial
Even if you decide to not go the DIY route, the covered call and collar strategy are nonetheless great strategies to have in your toolbox. Covered calls are a fantastic way to earn extra income in a sideways market; collars can be beneficial to hedge individual stocks against times of high volatility, such as earnings.
Conclusion
So far, NUSI appears to be the winner over QYLD, but that could all change rapidly. I have a feeling we are going to be seeing a lot more ETFs based on options strategies in the near future. If neither of these fit your risk profile, there should be plenty more coming down the pipeline soon.
Happy trading.
projectfinance Options Tutorials

Mike Martin
Additional Resources
New to options trading? Learn the essential concepts of options trading with our FREE 160+ page Options Trading for Beginners PDF.
2 thoughts on “QYLD vs NUSI vs DIY: Which Options ETF Strategy is Best?”
I’m trying to choose between investing in JEPI and QYLD. Are there any significant pros and cons between these two ETFs? Thanks!
Thanks for the question Isabelle!
JEPI is having a stellar year in 2022 relative to the market. This fund invests in low-volatility stocks and sells calls on these stocks. QYLD has a similar strategy, but this fund sells calls on the NASDAQ 100. In 2022, Nasdaq stocks have taken a hit. JEPI’s low volatility stocks are beating QYLD’s tech-heavy portfolio so far this year!
But who knows what will happen in the future!
Mike