Last updated on February 11th, 2022 , 12:49 pm
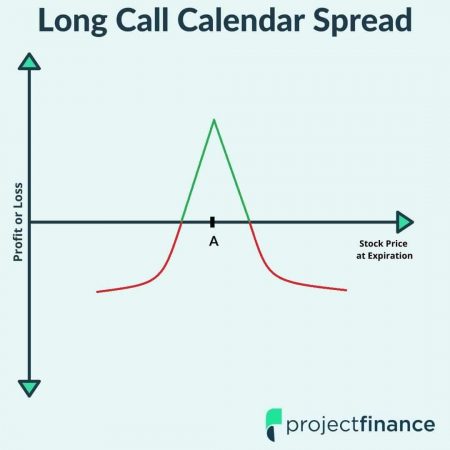
The above graph represents the profit and loss of a long call calendar spread as expiration approaches. Strike price “A” represents the strike price of the options both bought and sold.
Calendar Spread Definition: In options trading, a “calendar spread” is a financial term used to describe a strategy that consists of buying and selling two options of the same underlying security with matching types (call/put) and strike prices, but different expiration dates.
Calendar Spread Max Profit: Back Month Premium (minus) Front Month Premium (minus) Net Spread Debit
Calendar Spread Max Loss: Net Debit Paid
Highlights
A long calendar spread consists of two options of the same type and strike price, but with different expirations
Long calendar spreads are great strategies for options traders who believe the stock price will trade near the short option price, allowing traders to profit from “pinning” the future stock price to this strike
Calendar spreads offer traders the flexibility to profit in neutral, bullish, and bearish markets
The difference in the speed of time decay between the short and long options allows long calendar spreads to profit
After learning how the “single option” and “vertical spread” options strategies work, investors often next turn to the calendar spread.
If you don’t yet fully understand the mechanics of the above options strategies, you will probably struggle in learning how calendar spreads work.
Why? Calendar spreads are by far more complicated strategies. This article presumes you have a fundamental understanding of basic concepts such as time decay and basic volatility. If you’d like to better understand the more elementary strategies first (or simply need a refresher), projectfinance has some excellent content on both!
Single Options Tutorials
Vertical Spread Tutorials
Let’s first take a look at the inputs of a vertical spread, as well as a trade example.
Vertical Spread Components:
Long Call/Long Put of identical type, expiration and quantity at one strike price
- Short Call/Short Put of identical type, expiration and quantity at a different strike price
Vertical Spread Example:
Long AAPL Jan 150 Call
- Short AAPL Jan 155 Call
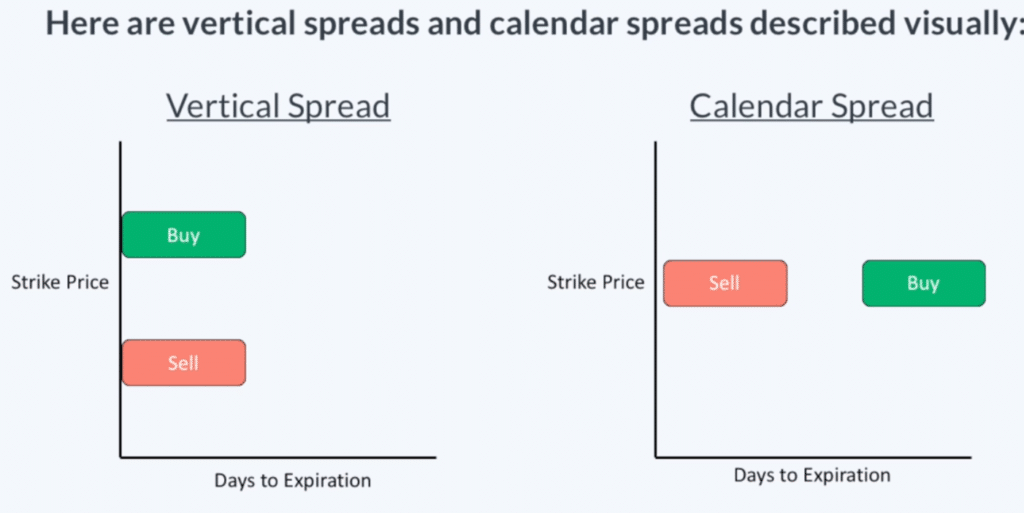
Before we dive into calendar spreads, let’s take a look at a visual from Chris Butler which illustrates why calendar spreads are also known as horizontal spreads.
Let’s now take a look at a long calendar spread example composed with calls:
Long AAPL Jan 150 Call
- Short AAPL Feb 150 Call
In calendar spreads, we have options with different expirations; in vertical spreads, we have different strike prices. In both strategies, the options will still be of the same type (call/puts) as well as quantity. Though the change is minor, trading different expiration cycles within one strategy can complicate matters.
You can either short or go long a calendar spread. This article will focus on long calendar spreads as they are by far the more popular trade.

New to options trading? Learn the essential concepts of options trading with our FREE 160+ page Options Trading for Beginners PDF.
How Long Calendar Spreads Work
When you cross expiration cycles, things can get confusing. It’s not just you: most options traders struggle when “time” clouds things up. After all, since we have two options expiring at different times, doesn’t that throw everything off?
What happens to the other options when one expires? Will we be naked/long? All good questions, and we’ll answer them soon. Let’s dive into a trade example.
Long Calendar Spread Example
Below, you will find the details of our spread.
Stock Price at Entry: $171.98
- Short 170 Call (39 Days to Expiration) for a Credit of $5.50
- Long 170 Call (74 Days to Expiration) for a Debit of $7.75
Before we get into the analysis, take a moment to try and figure out what we want the underlying to do here. Answers are much better understood when the questions are waiting!
Let’s look at the individual legs first. We paid $7.75 for the 74 days-to-expiration (DTE) call and received a credit of $5.50 for the 39 DTE call.
Since we ultimately paid $2.25 ($7.75-$5.50) for this spread, it is therefore a debit spread. Our max loss is therefore $225.
What interests us most here is the strike price of our spread, which is 170.
Remember, the stock was trading at $171.98 when the trade was put on. Therefore, the spread should profit if the stock price hovers around that level. Let’s find why next.
Long Calendar Spread Over Time
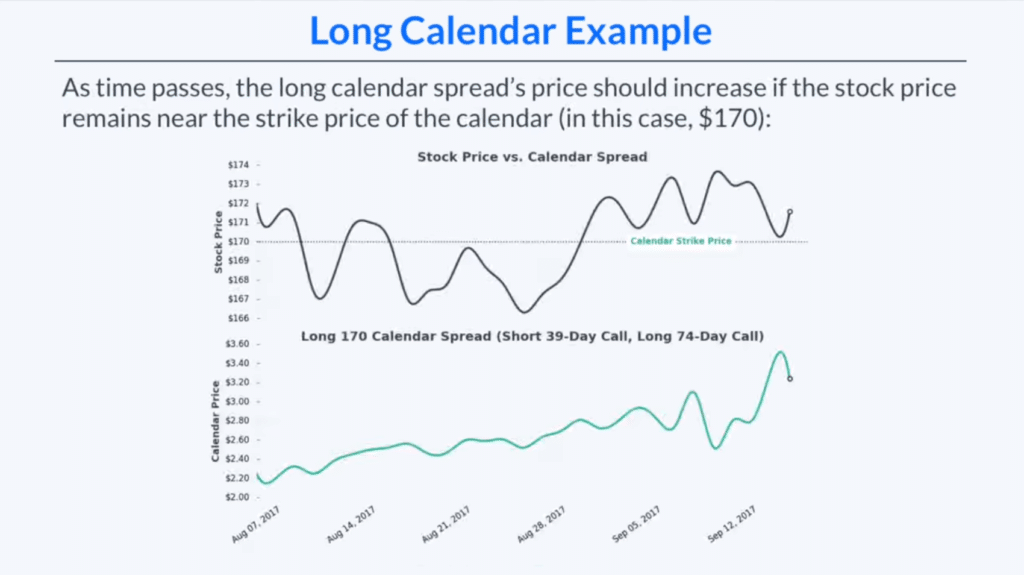
To understand how our above trade plays out in the market, let’s compare the performance of our spread with the performance of the stock over time.
Take a moment to study the above image. Notice how well our spread performs when the stock is trading near our strike price of 170?
These changes are subtle at first, but over time, as time decay, or the Greek “theta”, goes to work on the options, this spread becomes much more responsive. Notice how our spread reaches its highest profitability just a few days before expiration?
You may have noticed that the stock was at this same level back in August; why wasn’t our spread at that higher profitability at that point? Because of that “theta” we spoke of earlier, which we will get to.
Right now, let’s focus on understanding why exactly the price of our calendar spread increased.
Long Calendar Spread Breakdown
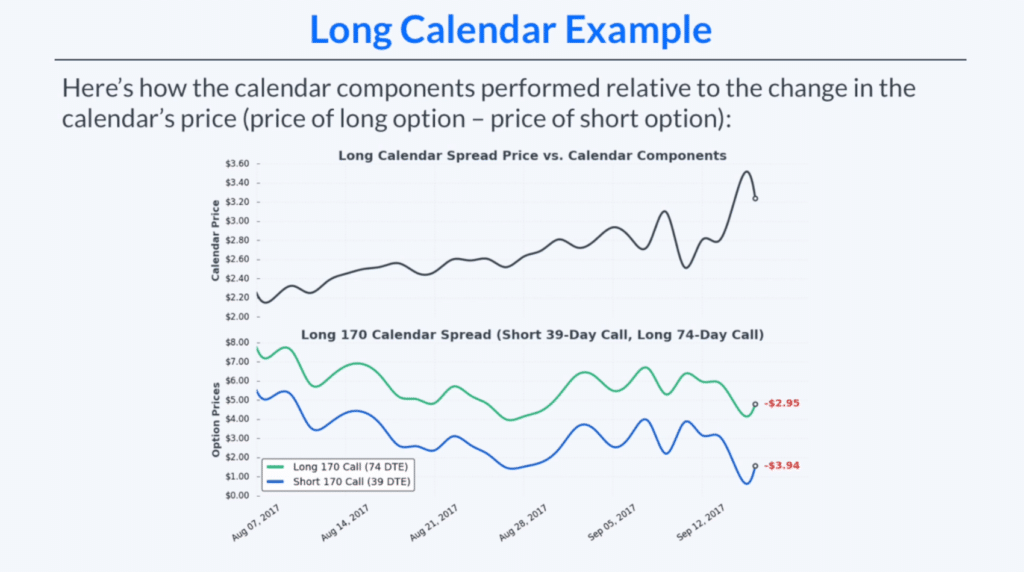
The below image shows us how the two components of our calendar spread react to changes in the stock price.
By studying the above chart, we can see that the short 170 call (blue line) decreased at a faster rate than the long 170 call (green line). While both options still lost money, the short leg lost $0.99 more ($3.94-$2.95). Remember, it’s not the individual prices that we’re concerned with, it’s the spread between the prices.
Since our short option lost more than our long option, the value of our spread increased. Since we own the spread, this is a good thing! Don’t you want the value of something you own to go up?
Understanding Calendar Spread Pricing
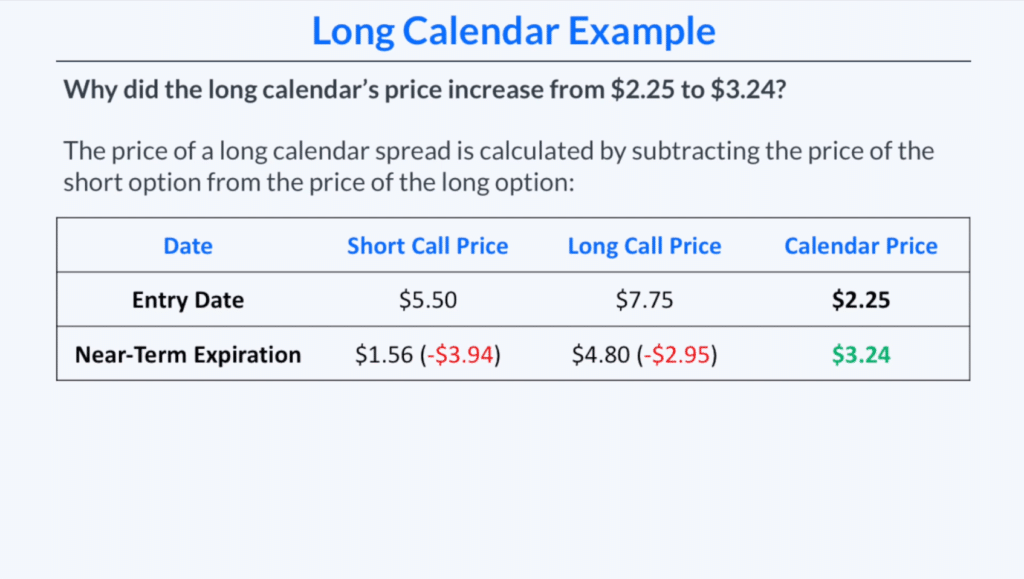
As we said before, to determine the price of a long calendar spread, we simply subtract the price of the short option from that of the long option. Take a look at the below image.
At the time of trade entry, the price of our short call was $5.50 while the price of our long call was $7.75. This results in a net debit of $2.25.
As expiration nears, the price of our two options change (as illustrated above).
The total value of the spread has gone from $2.25 to $3.24. That results in a profit of $0.99 to us!
So why did the option we were short going down faster than the option we were long?
Again, when in doubt, think about this intuitively. When two options have the same strike price but different expirations, which one will have more premium? The more time a stock has to move, the more premium that option will have.
Therefore, the option with 39 DTE (our short) will have decreased faster than our option with 74 DTE (our long).
Last up, let’s really drive it home by looking at a visual comparing ALL components of the calendar spread.
Long Calendar Spread: Complete Components
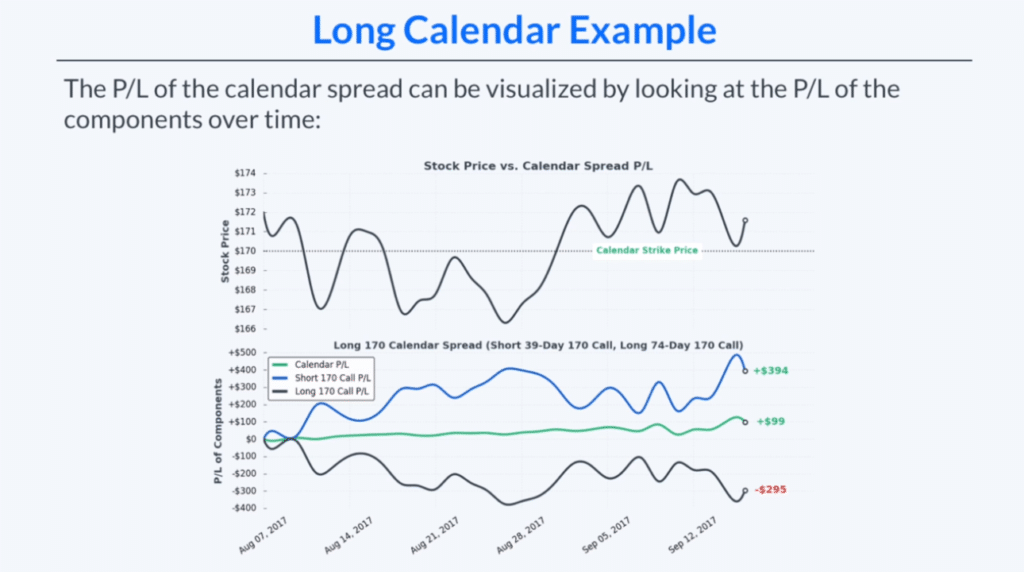
The below image adds to what we have studied by illustrating how all component’s of our trade change over time.
The top portion of the above graph shows us the changes in the stock price relative to the calendar strike price of 170. The bottom portion of the graph shows us the P/L of the calendar spread as a whole in addition to the components of this spread.
Our short call decreased in value by $3.94. Since we are short this all, this is a profit of $394 to us.
Our long call decreased in value by $2.95. Since we are long this call, we lost $295 here.
What’s the net? $99 ($3.94-$2.95) profit, which can be seen in the middle green line.
Why Our Long Calendar Spread Increases with a Neutral Stock Price
When purchased near/at the money, the short option in a calendar spread will lose money faster than the long option. This results in a profit for us. Again, in order to understand how this works, you must understand time decay.
With calendar spreads, you don’t have to trade near-the-money strikes; you can choose whatever strike price you want. When you buy a calendar spread, your aim is to “pin” the future stock price as closely as you can to your chosen short strike price. The further away from the market price you go, the more profit you make (and the lower odds of success you’ll have!).
Please note that our example is elementary; it does not take into account implied volatility. Around earnings season, you will notice the pricing on calendar spreads can be a bit out of whack.
Some traders even refer to calendar spreads as “long volatility” trades. We disagree. If you’d like to learn more on this or give us your opinion, please check out our video below!
Final Word
Calendar spreads are options strategies definitely reserved for the more advanced options trader. If you don’t know what you’re doing, you can lose quite a bit of money.
For example, if you decided to “short” a calendar spread, and you mismanaged or simply forgot about the position, you could lose quite a bit of money. How? If you let the long leg on your trade expire without adjustments, you will still be naked short the other call/put.
That being said, since we are dealing with opposing expirations, even long calendar spreads require active management.
Next Lesson
projectfinance Options Tutorials

New to options trading? Learn the essential concepts of options trading with our FREE 160+ page Options Trading for Beginners PDF.
