?> April 2022 - projectfinance

Market Makers in Options Trading: What Do They Do?

Market Making

Market Maker Definition: A market marker acts as a liquidity provider by both buying and selling a security to satisfy the market. 

Market makers are the backbone of all public markets. Without them, it would be very difficult indeed to both enter and exit any type of security, including stocks, options (derivatives), ETFs, and futures. 

If you’ve ever placed a market order before, you’ve probably been surprised at how fast that order was filled. This is because a market maker was waiting, armed with a software-based trading system using algorithms, to take the other side of your trade. 

In this article, we will explore the function of market makers, and how they contribute to the smooth running of our capital markets. 

              TAKEAWAYS


  • The function of a market maker is to provide liquidity for the markets. 

  • Market makers make money from the “spread” by buying the bid price and selling the ask price. 

  • Market makers hedge their risk by trading shares of the underlying stock.

  • Citadel and Virtu are the largest option market makers. 

  • A broker acts as an intermediary, facilitating orders from buyers and sellers; a market maker provides order execution.

What Is the Purpose of Market Makers? 

Market makers are the reason our market orders get filled instantaneously. They also (eventually) fill stop orders, limit orders, and virtually any other type of order your broker offers. Without market makers, you would have to sit on the order until another counterparty came around and decided to take the other side of the trade. When might that time come? Who knows. This “illiquid” market would certainly cause us to distrust the markets. 

The ease to enter and exit trades is called liquidity. Providing liquidity is the primary function of all market makers. These market participants buy the bid price and sell the ask price on their specified security for any order that comes their way. 

Of course, market making is no charity – the difference between the bid and the ask is called the spread, and this spread is how market makers make money.

What Are Examples of Option Market Makers?

Let’s jump right into an example to see how market makers help markets run smoothly. 

This example is going to involve a put option on AAPL with three market participants: Jane, Joe and a market maker. 

  • Jane is currently long a AAPL put option contract and wants to sell.

  • Joe wants to buy the same contract Jane is selling.

  • The AAPL put is currently bid for 1.20 and offered for 1.60

Market Making Visualized

market maker options

Both Jane and Joe send a market to both sell and buy, respectively, their put option. These orders are sent to an exchange. Some major exchanges for options include:

  • Chicago Board Options Exchange (CBOE)

  • International Securities Exchange (ISE)

  • NYSE (New York Stock Exchange) Arca

  • Various Nasdaq Markets

After being sent to an exchange, the order is then seen on the screen of a market maker. The market maker buys the put from Jane while simultaneously selling the same put to Joe. 

Since the market maker bought the option at the bid of 1.20 (from Jane) and sold the option for 1.60 (to Joe), the market maker made a profit of 0.40, or $40 taking into account the leveraged multiplier effect of options. Remember, one options contract represents 100 shares of stock. 

Sometimes, Joe and Jane can trade directly together, but the vast majority of the time, a market maker is needed to facilitate these trades. What if there was no other trader out there who was willing to buy that put option Jane wanted to sell? How would she ever get out of her position?

How Do Market Makers Set Option Prices?

Market makers set option prices for all listed derivatives, including equity, ETF, and index options

In the above example, the market for our put option was 1.20/1.60. This means that if you were to buy this option at 1.60 and wanted to sell it immediately, you would have to sell it for 1.20. In other words, you would lose 0.40 (1.60-1.20), or $40, immediately. 

Of course what you lose, the market maker gains. 

But why is this market 1.20/1.60? Is this some arbitrary price? No! 

The width of a market (set by the various market markers for a security) depends on several factors. The more liquid a security is, the easier both you and a market maker can enter and exit positions in that security.

3 Liquidity Measures in Options

Market Makers Liquidity

Before determining the spread of an option (or any security), a market maker considers several liquidity factors. Three of these are:

  1. Volume: How many option contract have been traded so far on any given day.

  2. Open Interest: How many contracts are outstanding in an option.

  3. Bid/Ask Size: How many contracts are bid/offered at that price. 

The higher the volume and the more open interest an option has, the easier a market maker can exit the position they just bought or sold from you. 

Remember, market makers have to exit positions as well! If markets are illiquid, they are going to widen out the spreads to make up for the risks of holding a position in an illiquid market. 

How Market Makers Hedge

Market makers don’t generally turn around and immediately sell an option they bought from you. They’ll have to wait a bit for another trader to come around and give them a good price. So how do they hedge the risk of holding options?

Let’s take a look at an example to find out.

We’ll say AAPL just reported horrible earnings, and every trader out there is trying to sell their call options. A market maker in AAPL must therefore buy these options to fulfill their duty as a liquidity provider. 

This will result in a boatload of long call options for the market maker. That’s a lot of risk! How do market makers offset this risk?

Delta and Gamma Hedging

To mitigate this risk, a market maker keeps an inventory of either long or short stock. How much stock? That depends on their position “delta” and “gamma“.

Δ β θ Read! Introduction To The Option Greeks

For example, if an out-of-the-money call option has a delta of 0.84, that means this contract trades like 84 shares of stock. To offset this risk, a market maker would sell 84 shares of stock.

Sometimes, in volatile markets, a lot of stock must be purchased or sold for a market maker to offset their risk. This can cause stock prices to both soar and tank in value. Market makers hedging their short call options with long stock is the reason many meme stocks soared in value in 2021. This rare market condition is called a gamma squeeze

If you’d like to read more about delta hedging (which both market makers and traders utilize), read our article, Delta Hedging Explained (Visual Guide w/ Examples)

How Do Market Makers Make Money In Payment for Order Flow?

Retail traders are not known for their market savviness. Market makers want retail order flow, particularly in options. Why? The bid/ask spread in options is much wider than in stocks. 

Market makers want this order flow so bad, that they are willing to pay brokers for the right to fill their customer’s orders. 

This is known as payment for order flow. 

Every time you send an order through your broker (unless your broker internalizes their order flow), an auction takes place between your broker and numerous market makers to see who gets to fill your order. 

In these flash auctions, the best bid/offer wins. Payment is sent from the market maker to the broker for filling the order, and the customer is filled.

Market makers do not get paid here – the brokers (like thinkorswim, Robinhood, or tastyworks) do. Market makers make their money in “arbitrage” by trading the products they are specialists for. 

Read: 💲 Payment for Order Flow Explained Simply (w/ Visuals)

Who Are the Largest Options Market Makers?

Although there are many market-making firms, two, in particular, dominate the space: 

  1. Citadel Securities
  2. Virtu

So what percentage of volume do these two firms take from the stock and options markets? The below image, from the Financial Times, shows just how much.

Market makers can be small independent businesses or large hedge funds. In the modern era, hedge funds are taking business from the smaller market makers. You must be very well capitalized to compete in this space!

What Is the Difference Between a Market Maker and a Broker?

With a few rare exceptions, (such as Interactive Brokers), retail brokers do not act as market makers. These two business models provide completely different services. 

  1. Brokers act as intermediaries by facilitating trade orders from both buyers and sellers by bringing together assets.

  2. Market Makers are dealers in securities who provide liquidity to a market by buying and selling that market’s securities at all times. Market makers provide trade execution.

Option Market Makers FAQs

Market makers provide liquidity by both buying and selling options of all types, including call and put options. To offset the risk from selling call options, market makers must purchase stock. This can result in a gamma squeeze. 

In order to adequately mitigate their risk, market makers in options must hedge their positions by either buying or selling shares of stocks. This can lead to fluctuations in the underlying share price, which some believe to be manipulation.

Market makers buy options to satisfy the market. As liquidity providers, the role of the market maker is not limited to buying options – they must stand ready to both buy and sell all options strategies to fulfill their obligation. 

Next Lesson

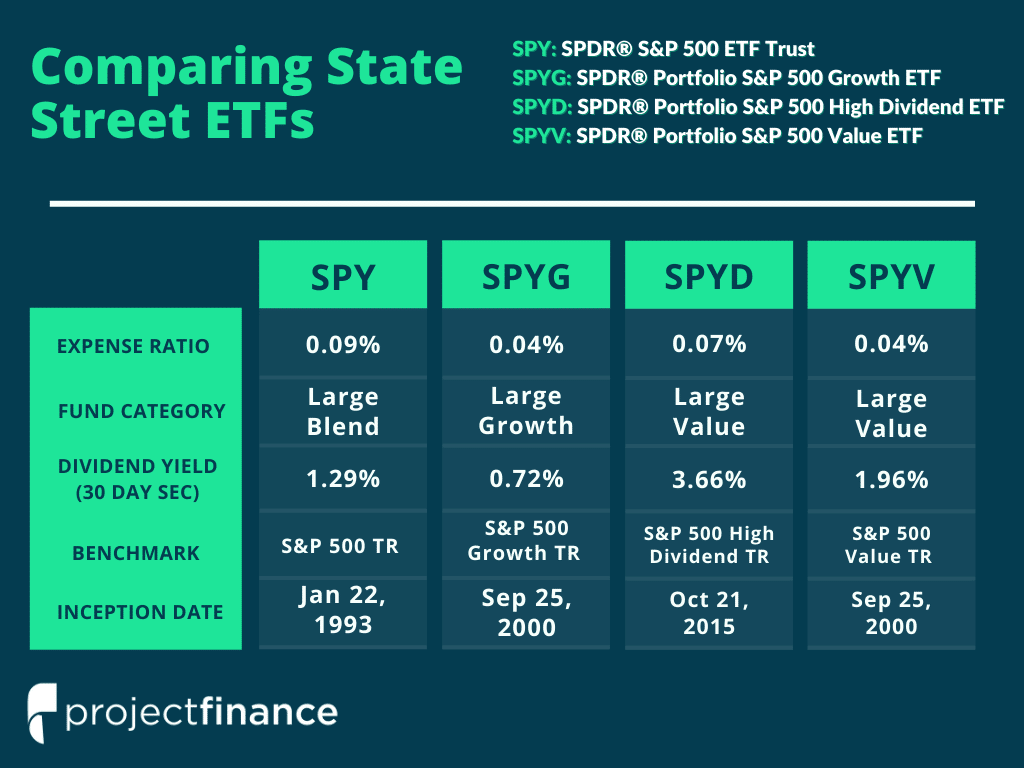
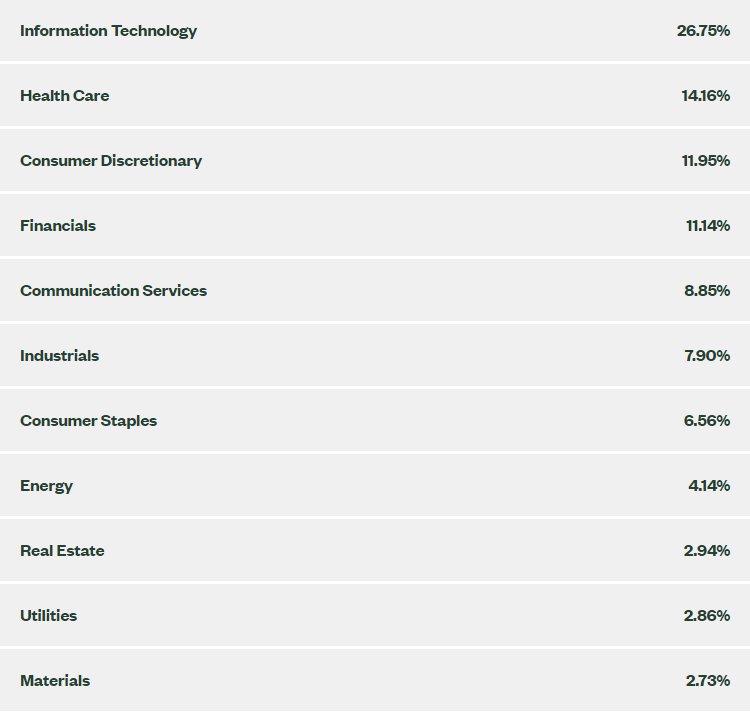
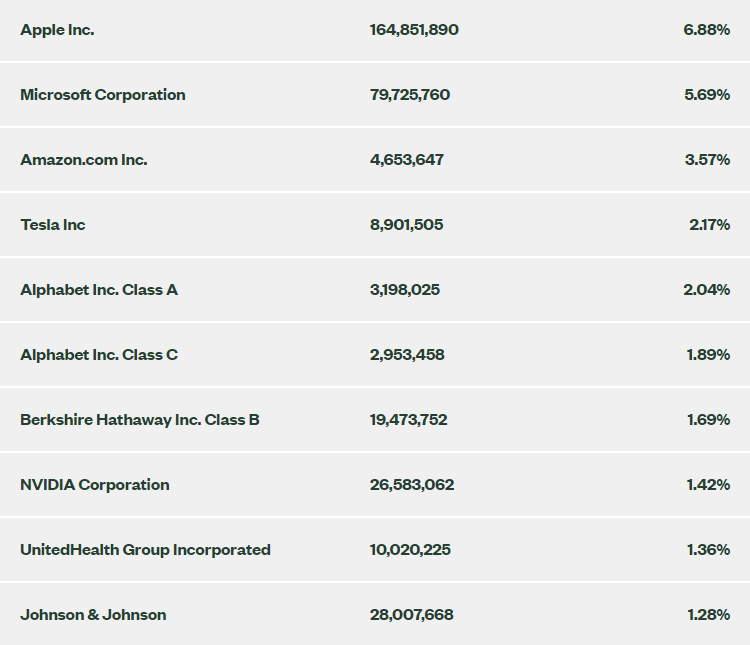
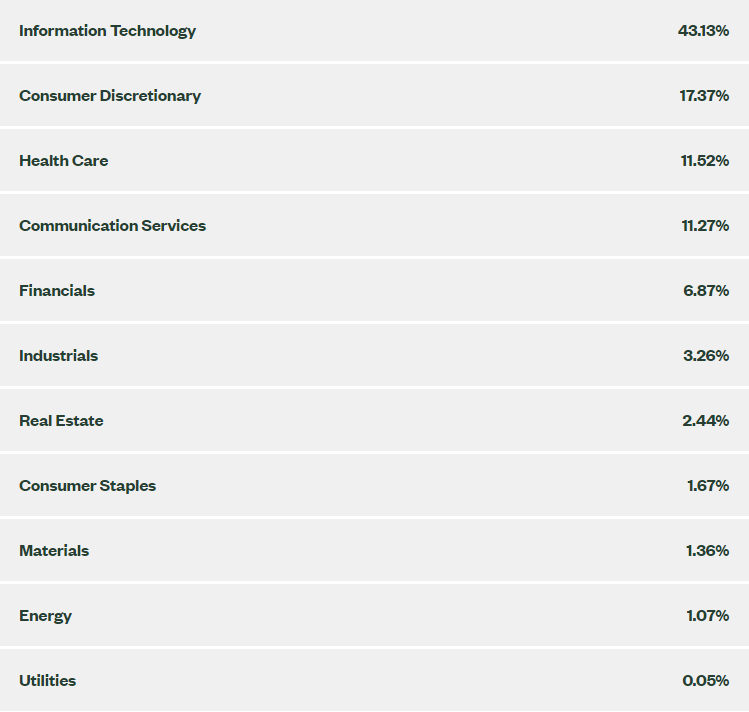
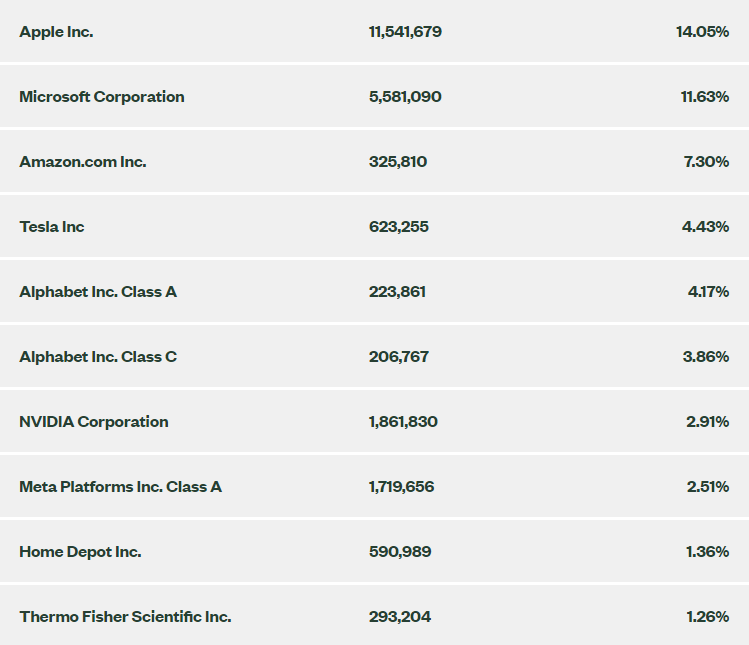
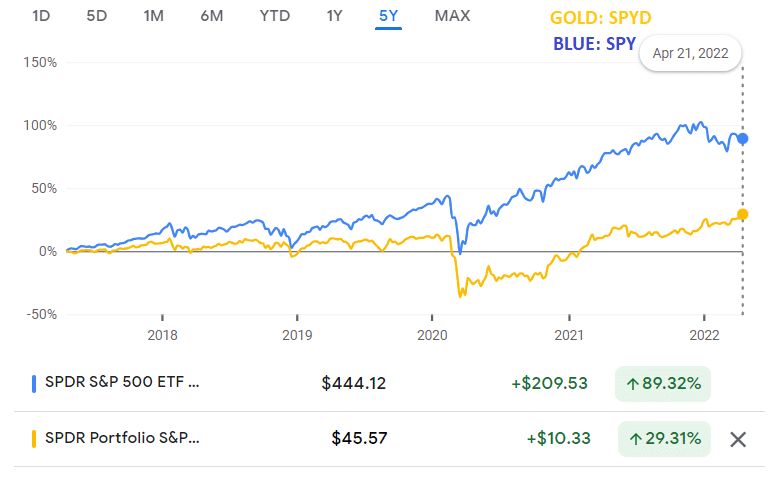
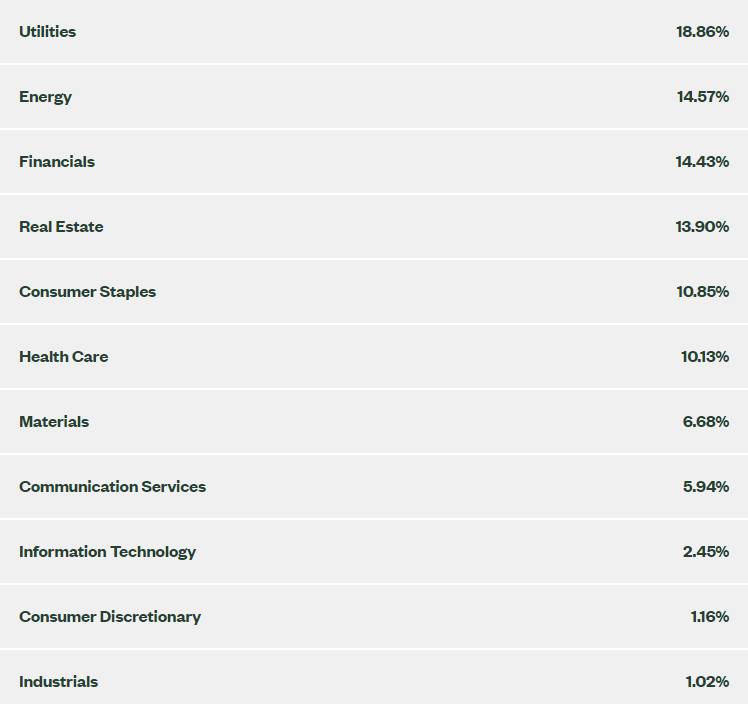
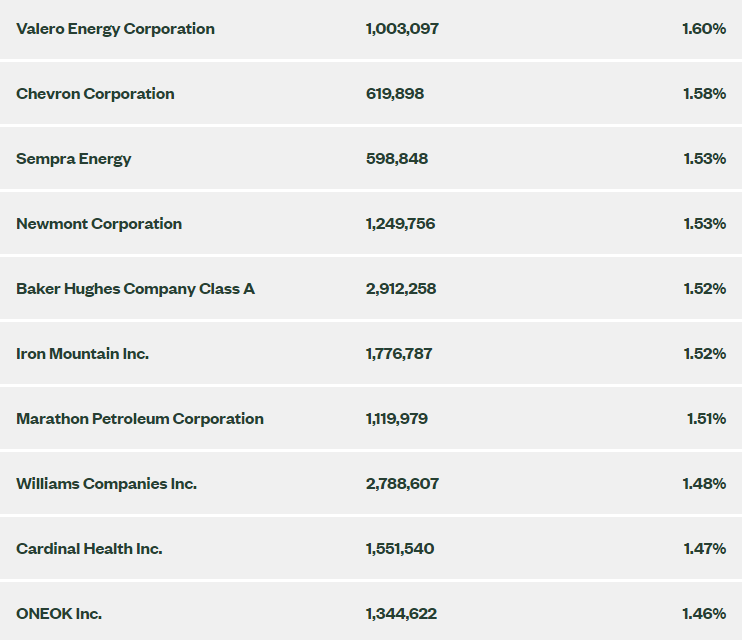
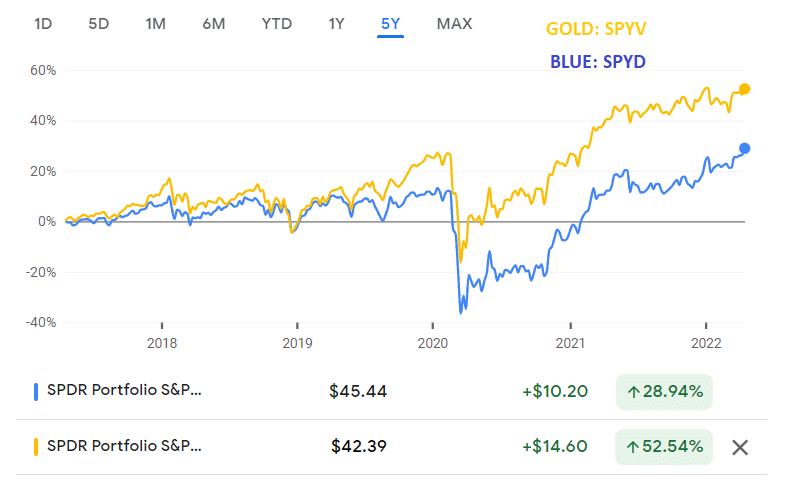
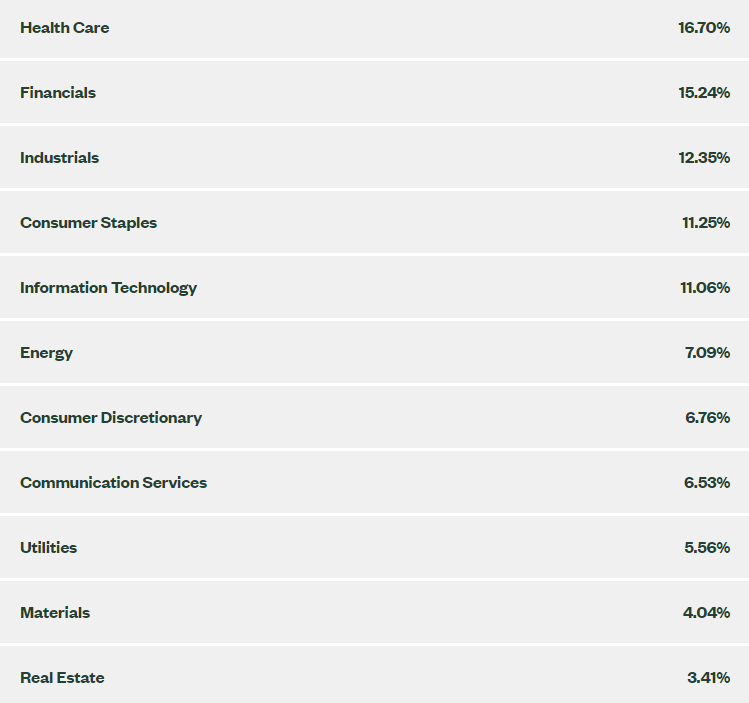
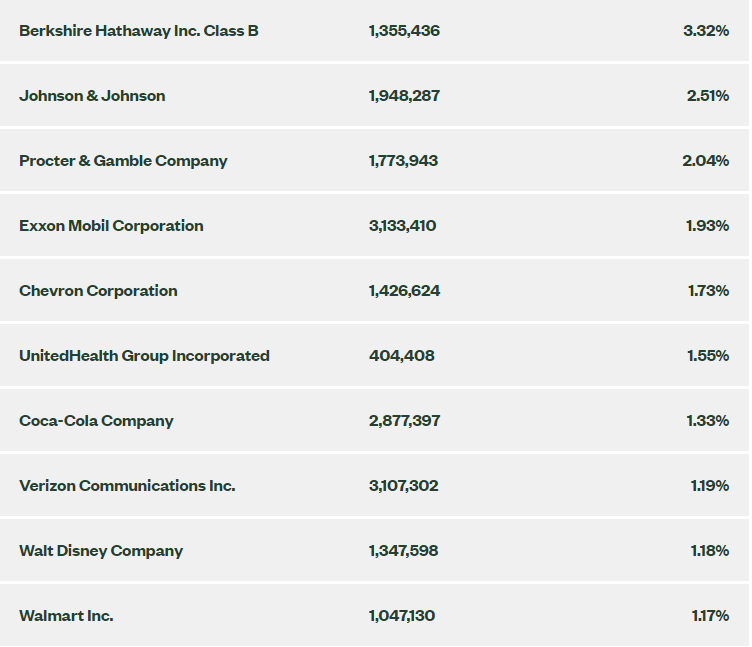
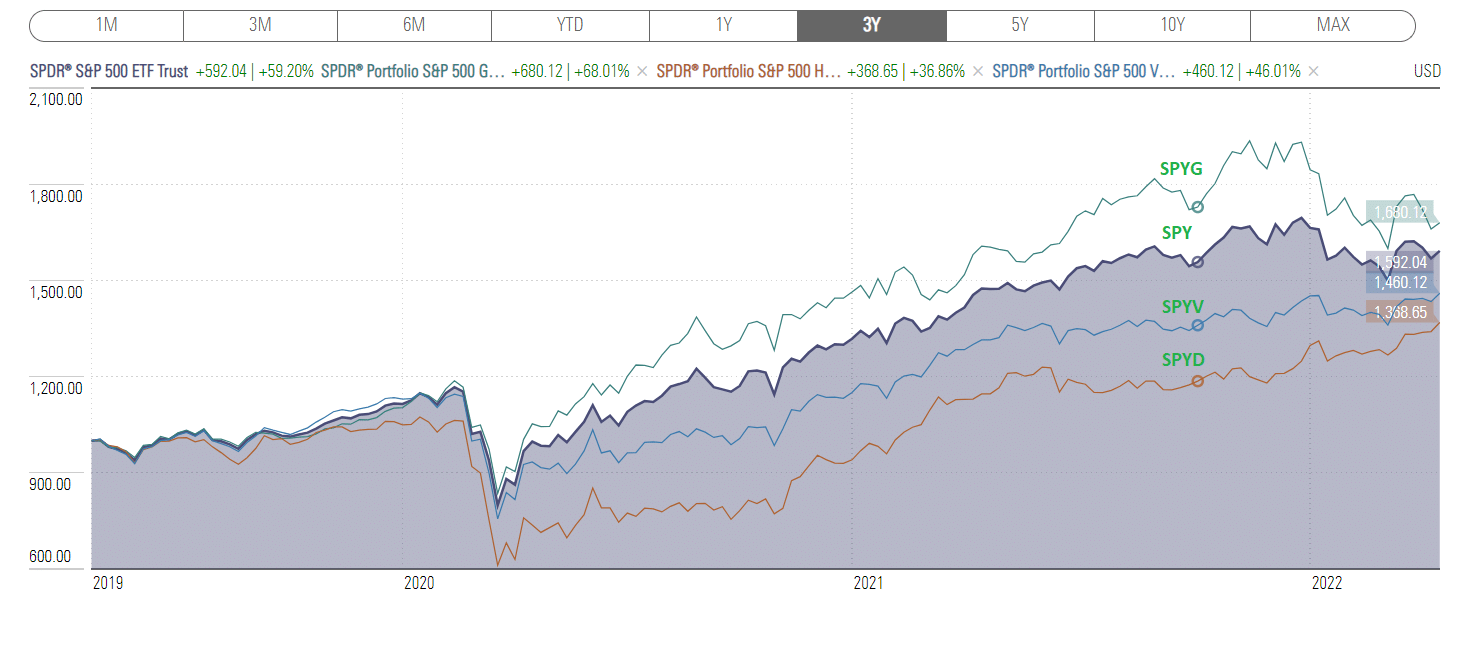
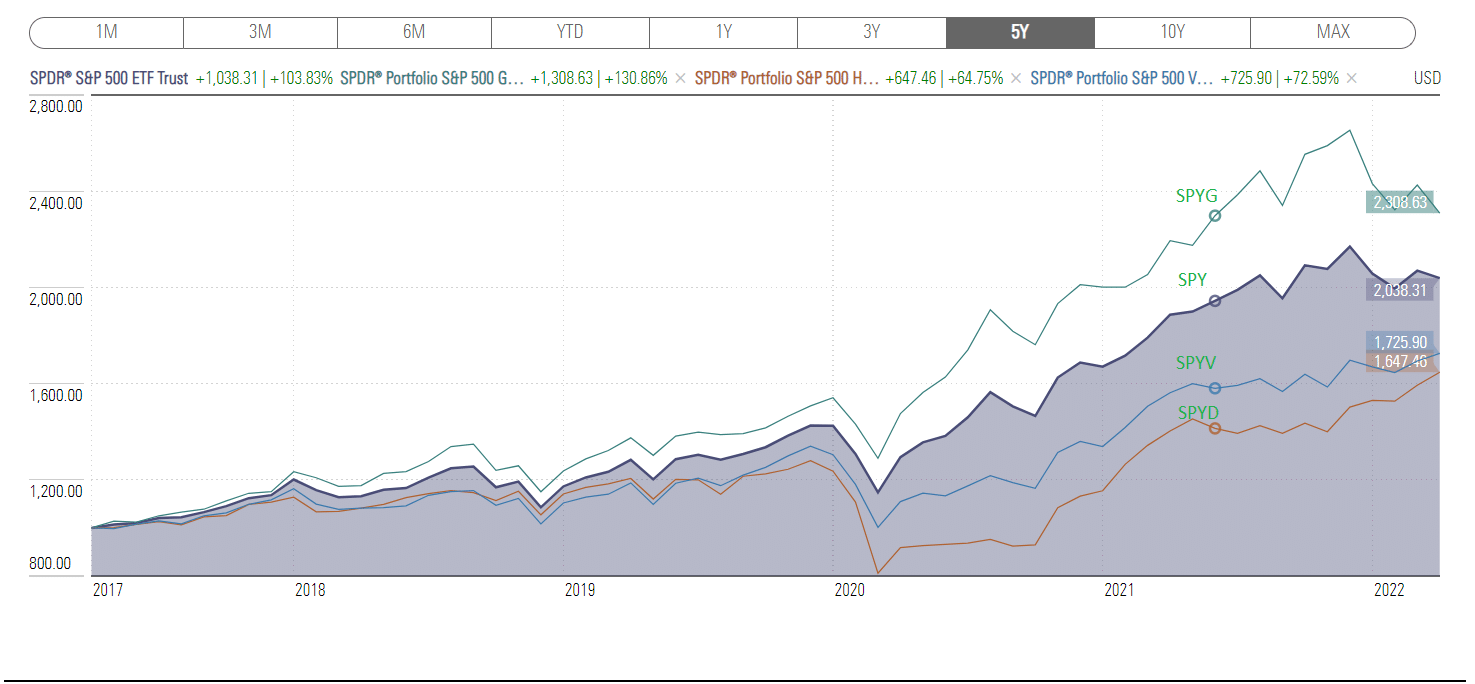
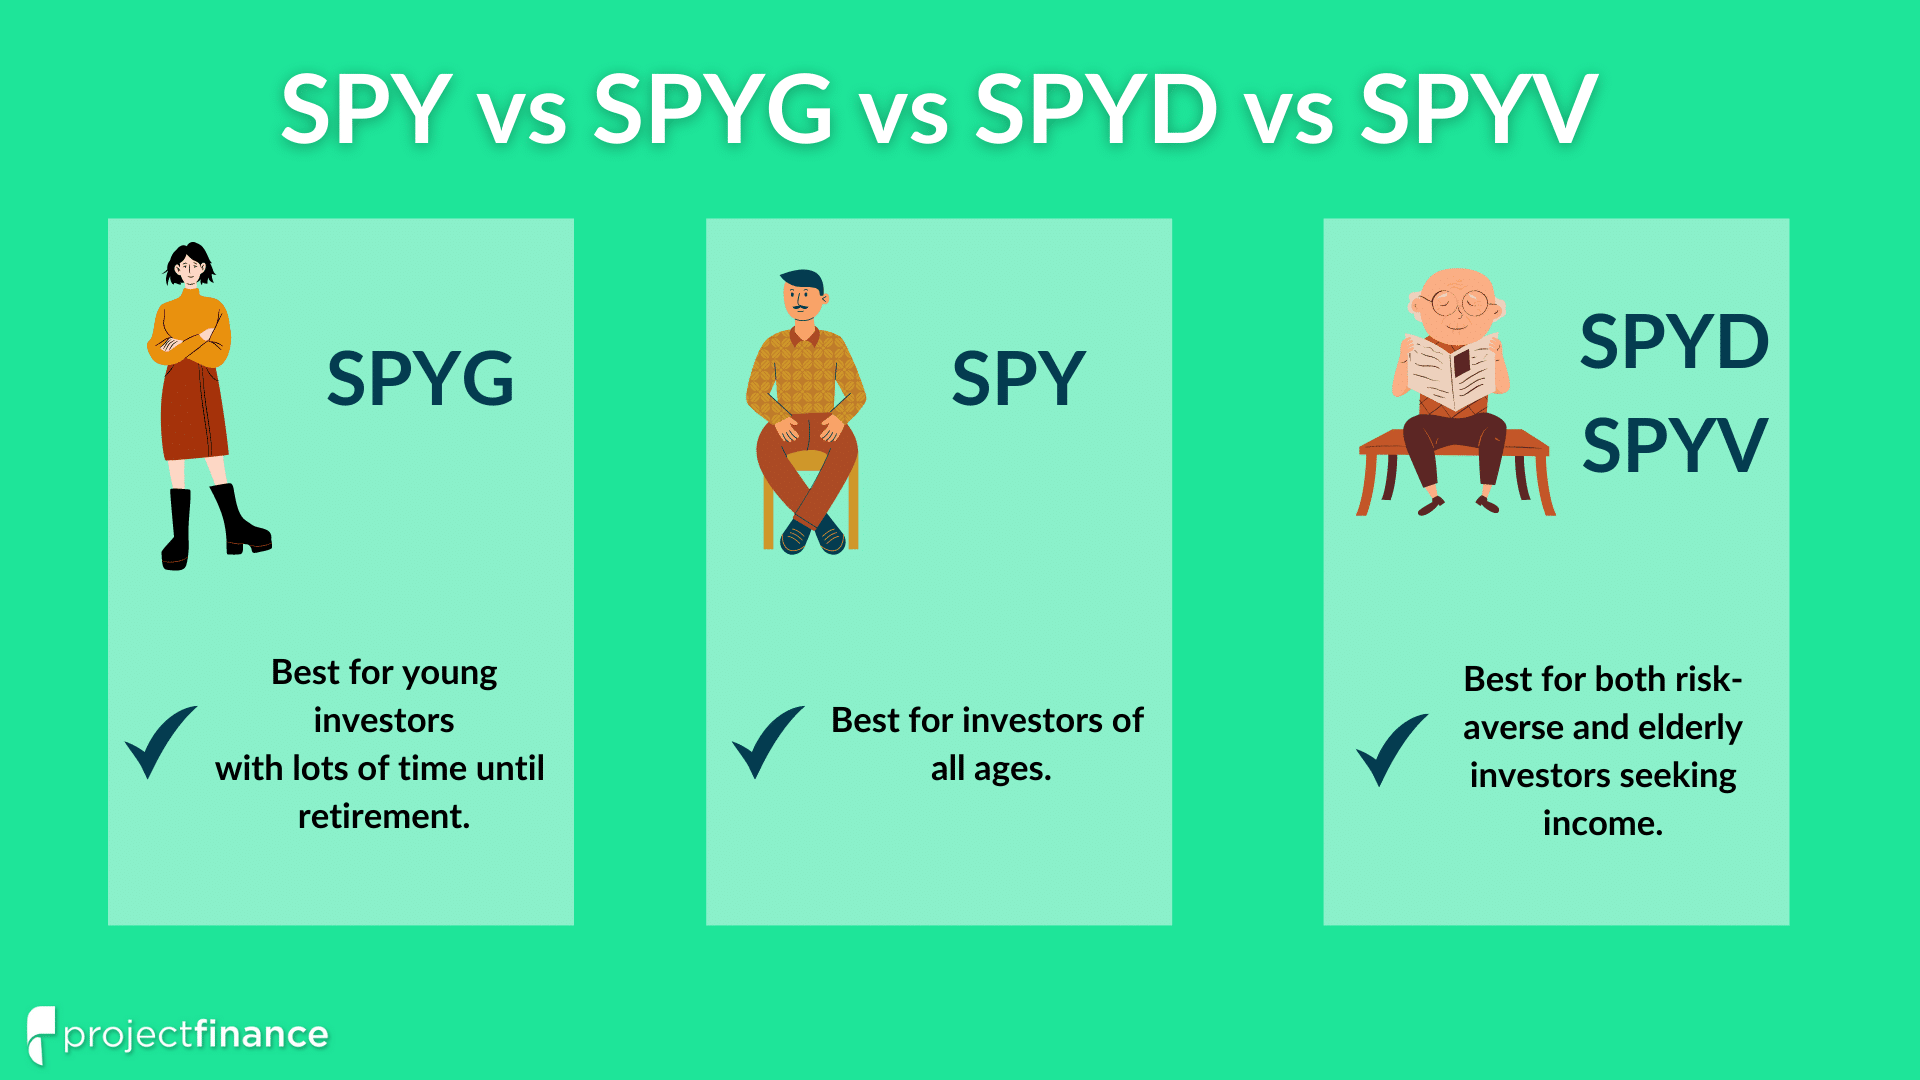
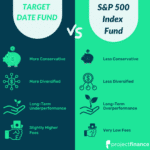
SPY vs SPYG vs SPYD vs SPYV: Head-To-Head ETF Comparison

In 2022, State Street Corporation currently offers more than 130 ETFs (exchange-traded funds). Generally speaking, ETFs are cheaper and more liquid than mutual funds. 

The most popular of State Street’s ETFs is the SPDR S&P 500 ETF Trust, SPY

The SPY ETF uses the S&P 500 Market Index as its benchmark. SPY is the largest and most liquid exchange-traded product (ETP) in the entire world. 

The popularity of SPY led State Street to create numerous S&P index fund-tracking spinoffs. Some of these funds include:

  • SPYG: SPDR Portfolio S&P 500 Growth ETF

  • SPYD: SPDR Portfolio S&P 500 High Dividend ETF

  • SPYV: SPDR Portfolio S&P 500 Value ETF

  • SDY: SPDR S&P Dividend ETF

  • SPDR: SPDR S&P Biotech ETF

  • SPLG: SPDR Portfolio S&P 500 ETF

In this article, projectfinance will compare the performance and characteristics of four of these funds; SPY, SPYG, SPYD, and SPYV. Let’s look at the takeaways, then get started with a data-table comparison!

              TAKEAWAYS


  • State Street’s SPY, SPYG, SPYD ad SPYV all track different variations of the S&P 500 stock market index.

  • SPY is the oldest and most popular straight S&P 500 tracking ETF in the world.

  • SPYG tracks 240 growth stocks within the S&P 500.

  • SPYD tracks only 79 stocks. This ETF has strict criteria for entry, favoring stocks with high dividends.

  • SPYV track 447 stocks in the S&P 500, all of which are high value. This “value” is determined by factors such as book value to price ratio.

  • SPYG experiences the most volatility of all the funds but also has the most upside potential.

  • Though SPYD offers a high dividend, it contains many energy stocks, which are known for their volatility. 
SPY SPYG SPYD SPYV

Fund Issuer:

State Street
State Street
State Street
State Street

Fund Name:

SPDR® S&P 500® ETF Trust
SPDR® Portfolio S&P 500® Growth ETF
SPDR® Portfolio S&P 500® High Dividend ETF
SPDR® Portfolio S&P 500® Value ETF

Fund Category:

Large-Cap Blend
Large-Cap Growth
Large-Cap Value
Large-Cap Value

Underlying Index:

Expense Ratio (fees):

0.09%
0.04%.
0.07%
0.04%

Number of Holdings:

505
240
79
447

1 Year Return:

+15.47%
+18.20%
+18.60%
+12.45%

Morningstar Rating:

☆☆☆☆☆
☆☆☆☆☆
☆☆

Fund Structure:

UIT
(Unit Investment Trust)

ETF
ETF
ETF

Dividend:

(30 Day SEC Yield)

1.27%

0.70%

3.62%

1.93%

What Is the SPY ETF?

  • SPY has a dividend yield of 1.27%

  • The expense ratio (total fees) of SPY is 0.09%

  • State Street’s SPY exchange-traded fund is the first ETF to be issued.

  • SPY tracks the S&P 500 Index.

  • Because of its age (inception date 1993), SPY is structured as a UIT (unit investment trust), though it trades just like an ETF.

  • SPY is currently the most widely traded investment product in the world.

State Street’s SPDR® S&P 500 ETF (Ticker SPY) was the first exchange-traded product in the world to be issued. Here is how State Street describes its fund:

SPY is a straightforward ETF. This low-cost fund tracks the S&P 500 Index (SPX), which is the most followed index in the world. Here are a few quick facts about SPX:

  • The S&P 500 Index contains the 500 largest US companies by market capitalization.

  • The S&P 500 is a float-weighted index, which means larger companies have greater weight than smaller companies.

  • The S&P 500 index is generally considered to be the best gauge for the health of US stocks.

  • The S&P 500 index can not be directly invested in as indices do not offer shares.  

What does the SPY ETF Hold?

The S&P 500 is a well-diversified index containing large-cap stocks from numerous sectors. 

The below image was taken from the factsheet of State Street Global Advisors, the issuer of the SPY ETF:

SPY Sectors

Image from ssga.com

As we can see, information technology accounts for a large segment of the S&P 500 index. Health Care and Consumer Discretionary stocks also have heavyweight in this index, but nowhere as close as tech. 

The IT (tech) sector is dominated by FAANG Stocks, which represent Meta (FB), Amazon (AMZN), Apple (AAPL), Netflix (NFLX), and Alphabet (GOOGL). 

So what percentage of the SPY ETF is invested in these behemoths? Let’s take a look at the top ten holdings in this fund to find out!

SPY Top Ten Stock Holdings

Image from ssga.com

What Is the SPYG ETF?

  • SPYG has a dividend yield of 0.70%.

  • The expense ratio (total fees) of SPYG is 0.04%.

  • SPYG tracks the S&P 500 Growth Index.

  • Growth stocks have more risk than balanced or value stocks.

State Street’s SPDR® Portfolio S&P 500® Growth ETF (SPYG) tracks only part of the S&P 500 index. Which part? As you can probably guess from its name, this ETF singles out only the growth companies within the S&P 500 Index. 

Growth companies tend to be more volatile than value companies. In bullish markets, growth companies tend to outperform the market while these stocks typically underperform the market in bearish markets. Here is how State Street describes its fund:

So what companies does SPYG track? Let’s look under the hood to find out!

SPYG Sectors

Image from ssga.com

Many information technology stocks fall under the growth sector. Because of this, SPYG has huge exposure to IT stocks – 43.13% to be exact. Compare that to SPY’s IT exposure, which is still lofty at 26.75%. 

So what stocks does SPYG contain? 

As we can see below, SPYG has a lot in common with SPY, with Apple (AAPL), Microsoft Corporation (MSFT) Amazon (AMZN, Tesla Inc. (TSLA), Alphabet Inc. (GOOGL), and NVIDIA (NVDA) all representing the top positions.

However, SPYG places a much greater weight on these IT stocks in relation to SPY. 

SPYG Top Ten Stock Holdings

Image from ssga.com

What Is the SPYD ETF?

  • SPYD has a high dividend yield of 3.62%.

  • The expense ratio (total fees) of SPYD is 0.07%.

  • SPYD tracks the S&P 500 High Dividend Index.

  • High-dividend paying stock tends to be more value-oriented.

State Street’s SPDR Portfolio S&P 500 High Dividend ETF (SPYD) is a great fund for income-thirsty investors. 

This ETF isolates 80 high dividend-yielding companies within the S&P 500 Index. The result is a dividend yield of 3.62%. This yield is higher than SPY’s dividend yield of 1.27% and far surpasses SPYG’s dividend yield of 0.70%.

The downside tradeoff of high dividend-paying stocks usually comes in the form of long-term underperformance. SPYD has vastly underperformed SPY over the past five years, as can be seen below. 

SPY vs SPYD: 5 Year Chart

High dividend-paying companies tend to be less volatile than growth companies. In bullish markets, these companies tend to underperform the market while these stocks typically outperform the market in bearish markets.

Let’s next check out how State Street describes its high dividend-paying fund. 

SPYD Sectors

Image from ssga.com

Our first two ETFs (SPY & SPYG) were dominated by information technology stocks. SPYD, on the other hand, places a relatively minuscule weight on tech equities.

As we can see above, IT stocks account for only 2.45% of SPYD’s weighting. This fund favors utilities, energy, financials, consumer staples, and health care stocks. These stocks tend to be more financially stable, relying on steady income and revenue for steady dividend streams. 

Let’s next see what stocks in particular the SPYD ETF favors. 

SPYD Top Ten Stock Holdings

Image from ssga.com

As we can see, big energy stocks dominate the top ten holdings of SPYD. Let’s take a look at the dividend yields of a few of these companies to see why:

  1. Valero Energy Corporation (VLO): 3.63% Yield

  2. Chevron Corporation (CVX): 3.37% Yield

  3. Sempra Energy (SRE): 2.67%  Yield

What Is the SPYV ETF?

  • SPYV has a dividend yield of 1.96%.

  • The expense ratio (total fees) of SPYV is 0.04%.

  • SPYD tracks the S&P 500 Value Index.

State Street’s SPDR Portfolio S&P 500 Value ETF (SPYV) contains the stocks within the S&P 500 index that are most value forward. A high-value stock is determined by three factors:

  1. Book value to price ratio.

  2. Earnings to price ratio.

  3. Sales to price ratio

Of the 504 the stock in the S&P 500 index (remember that some companies like Google issue two classes of stock – class a and class c), 447 make the cut to be included in this ETF. This is in comparison to SPYD, which only includes 79 stocks. 

High dividend-paying stocks are not synonymous with high-value stocks.

As we will soon learn, SPYV is concentrated in far less volatile stocks than SPYD, with names such as Berkshire Hathaway Inc, Johnson & Johnson, and Procter & Gamble Company topping its holdings.

Let’s do a quick 5-year comparison of SPYD and SPYV, then move on to examine the holdings and top stocks within SPYV. 

SPYD vs SPYV: 5 Year Chart

SPYV Sectors

Image from ssga.com

SPYV Top Ten Stock Holdings

Image from ssga.com

SPY vs SPYG vs SPYD vs SPYV: Performance

Let’s conclude the article by comparing the historical price performance of our four State Street ETFs.

The below two charts compare the three-year and five-year growth of $1,000 invested in our various ETFs. To enlarge the images, simply click on them!

SPY vs SPYG vs SPYD vs SPYV: 3 Year Chart

Image from ssga.com

SPY vs SPYG vs SPYD vs SPYV: 5 Year Chart

Image from ssga.com

SPY vs SPYG vs SPYD vs SPYV: Which is Best?

Every ETF on our list comes with different levels of risk. Generally speaking, SPYG has the most risk and SPYV has the least risk. 

SPY can work for investors of all ages. Its great diversification and high liquidity (its assets under management are over 4B) make this fund very versatile.  

SPYG contains growth stocks, which can be quite volatile during stock market downturns. 

Though SPYD does indeed have a very high dividend, its energy heavy portfolio can prove to be ballast on long-term term returns. 

SPYG is more suitable for younger investors, while SPYD and SPYV are best suited for older investors because of their relative price stability. 

Worth noting here are some of State Street’s competitors: Vanguard’s VOO ETF tracks the S&P 500 as well, but it does so for a lower expense ratio of 0.04%. 

Have a question or comment? Drop a line below and I’ll make sure to reach out to you!

FAQs

SPY track the S&P 500 index. SPYG tracks only the growth companies within the S&P 500 index. The SPYG ETF has 240 stocks within it while the S&P 500 currently has 505. SPYG is more volatile than SPY. 

SPYG, as determined by Morningstar’s 5 star rating, is currently a great investment for investors with a long-term time horizon looking for exposure to large-cap growth stocks. 

Historically, SPYG has significantly outperformed SPY. However, SPYG will most likely underperform SPY in the next bear market. This is because SPYG is comprised of high beta “growth” companies, which are typically in the volatile “Information Technology” sector.

Next Lesson

How to Calculate Your Roth IRA and 401k Paychecks

Calculate Retirement Paychecks

Saving for retirement is a big deal. Every one of us needs some way to survive when we age out of the workforce and retire. Some lucky few can start successful ventures and save more money than they can ever spend, but most of us need to be a little slower and more deliberate with it.

We rely on a 401(k), an IRA, or multiple accounts to fund retirement. The trouble is, it’s pretty challenging to determine just how much you’ll have to live on when you retire. There are many moving parts and different factors to consider.

Moreover, if you search online, much of what you’ll find is about saving for retirement, not how to calculate what you’ll have as a payout when you finally retire.

How can you estimate what your retirement paychecks will be?

Let’s get started.

Age of Retirement

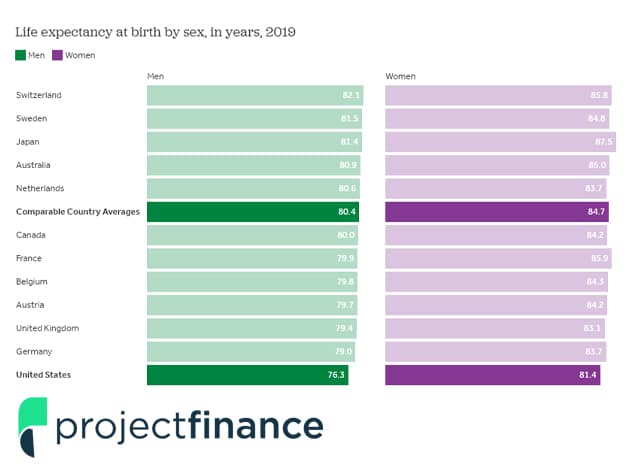
The average retirement age varies by location, culture, and income level. The one commonality is the age of 60. With an average life expectancy of about 78 in America today, this gives you a solid two decades to enjoy the twilight of your life. Of course, some people don’t retire until 65 or even 70.

Life Expectancy and Retirement Chart

The commonality is the age of required disbursements from investments.

Both IRAs and 401(k)s allow you to start taking payments from them when you hit a certain age. 

That age, as of current laws, is 59 ½. 

Why the half-year, and not just 59 or 60? Who knows! 

There’s probably a reason buried in the depths of time, but if there is, it’s not easy to find.

Additionally, those accounts require you to start taking payments at age 72.  

On top of that, some people qualify for early disbursements, starting at age 55. Specifically, if you leave your job once you turn 55, you may be able to take payments from that job’s 401(k) plan without penalty. Like a 401(k) you own or an IRA, other accounts do not allow this exception.

The age of retirement makes a big difference in your payment calculation. The longer you want to live off your investments, the longer those investments need to last. Ideally, you will have enough principal stashed away to live solely on interest payments, but that’s not always possible. More on that later.

The other reason age of retirement matters is market volatility. The longer you want to live on your retirement funds, the more likely you’ll have to cope with a downturn. Investment accounts take advantage of the fact that, over decades, the markets always rise. In the short term, however, volatility can affect interest rates and monetary value, and significant market volatility can have a significant impact, like a global pandemic affecting the world markets.

Additional Investments and Payments

An IRA and a 401(k) are not the only possible investments you can have for your retirement; they’re just two of the most common.  

When calculating your eventual retirement paycheck, remember to consider additional income streams. 

Two, in particular, are relatively common.
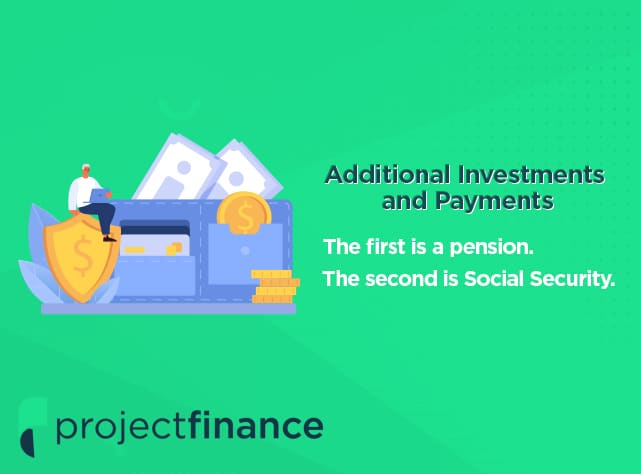
Additional Investments

The first is a pension

A 401(k) is technically a form of pension, but a “traditional” pension operates a little differently. These tend to be most common in major companies and government organizations, and they’re slowly growing less common over time. 

If you have one, you will likely have a fixed payment from a company pension, though you may have the option to cash it out or roll it over to another account so the company doesn’t need to deal with it anymore.

The second is Social Security. Throughout your life and your career, you pay taxes. Some of those taxes go to the government to spend as they will, some go to state governments, etc. Some of it, however, goes towards the Social Security fund. Everyone who works in America pays into Social Security, and everyone who worked in America long enough to earn enough credits is entitled to Social Security when they retire.

Social Security payments typically begin at age 62 and are usually calculated to be roughly 40% of your income level when working. Alternatively, you can delay taking your payments until age 70 to increase the amount you get each year.

Keep these two sources of retirement income in mind. Calculating your desired total retirement income requires considering all of your income streams, not just those from your primary accounts.

401(k) vs. IRA

In the title, we mention 401(k)s and IRAs as the two investment vehicles we will calculate. 

Is there any significant difference between them in retirement?

Traditional IRA vs Roth

The answer is not really. 

There are a lot of differences between IRAs and 401(k)s, but they’re all relevant to investing in them, not taking money from them. Once you reach retirement age, taking money from either of them – or even rolling them together – is acceptable. Either way, you have a principal invested in the markets, which earns interest based on its investment package. You take money from it as required once you retire. How much? Well, that’s the question.

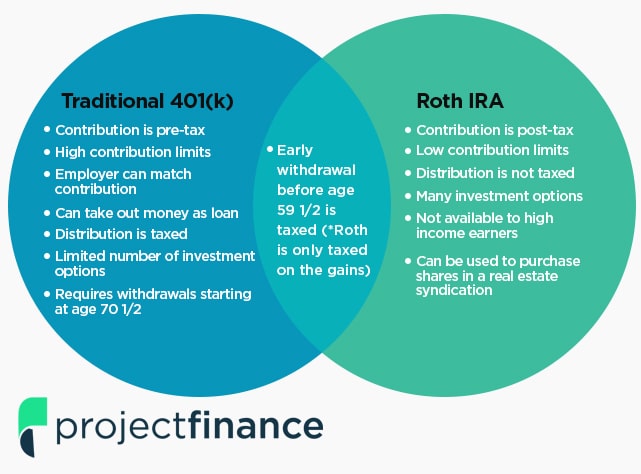
Roth vs. Traditional

One concern is whether your 401(k) or IRA is a Roth account or a traditional account. 

This decision has tax implications which can be relevant to calculating your paycheck in retirement.

With a traditional account, the money contributed to the account is tax-free. When you file your taxes annually, you count the money you put into your investments as a deduction, effectively reducing your overall income and allowing you to invest that money without paying taxes.

Roth vs Traditional

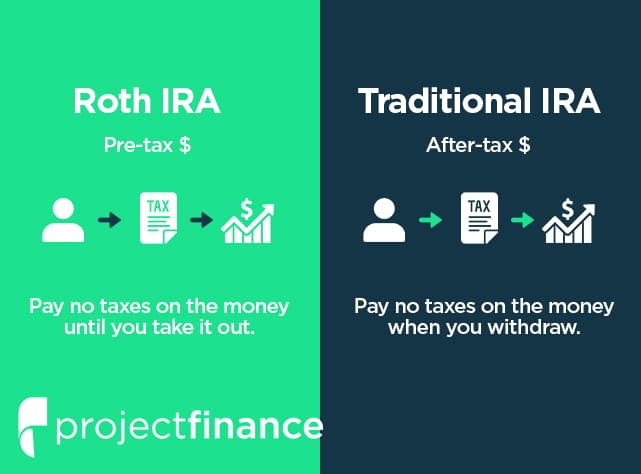
The government always gets its due. When you retire and start withdrawing money from a traditional IRA or 401(k), that money you pull is a paycheck and is taxed as income. You may have to pay income tax on that paycheck, calculated based on your income tax bracket with that new income in retirement. The amount of taxes you’ll have to pay depends on your retirement account type and varies from state to state.

Roth accounts work in the exact opposite way. With a Roth account, the money you contribute comes from your money after paying income taxes on your contributions and is not considered a deduction on your taxes when you earn that money and invest it. However, since you already paid taxes on that money, you don’t have to pay taxes on the disbursements you take when you retire.  

There are ways to roll a traditional account into a Roth account, but they get into more complicated tax strategies that we’re not going to discuss today. If you have a traditional IRA or 401(k), you have to consider income taxes as an additional drain on your retirement paycheck, whereas if you have Roth accounts, you do not.

There’s one other vital factor to consider: the required minimum withdrawal from your accounts. You must take a distribution every year with a traditional retirement account once you hit age 72. With a Roth, you don’t need to take any money out of it. The only requirement is that when you die, your dependents or beneficiary of your inheritance must take the distribution.

How Payouts Work

Once you reach a certain age, you can begin taking distributions from your retirement accounts. Once you reach an even later age, you will be required to do so. As mentioned above, the earliest age you can take money out of a retirement account without penalty is 55 in specific circumstances, or 59 and a half for most people. Once you hit 72, you’ll be required to take payments.

Note: This can change. The age used to be 70 and a half, but it was changed in 2019 under the Setting Every Community Up for Retirement Enhancement (SECURE) Act. It’s possible that, if you’re not already at retirement age, that age can change by the time you reach it. All of these numbers are subject to change based on the whims of the government.

The amount you must take out of your account each year is called the RMD, or Required Minimum Distribution. You can, at any time, take more out of your accounts if you wish, though this is usually a bad idea if it’s not strictly necessary, so we’ll discuss it more in a moment.

How Payouts Work

To quote the IRS:

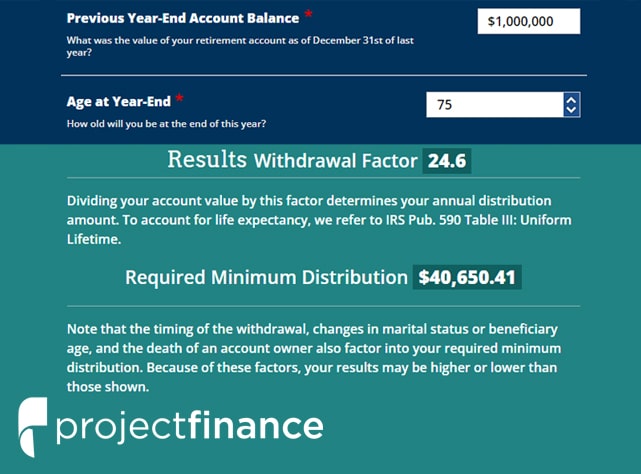
“The required minimum distribution for any year is the account balance as of the end of the immediately preceding calendar year divided by a distribution period from the IRS’s ‘Uniform Lifetime Table.'”

If you thought that table would be simple, here’s the IRS page for it. This page is over 38,000 words long, so settle in for some serious reading.

Luckily, you can use a simple calculator to estimate how much you will need to take out. The IRS provides one here. For example, if your retirement account has one million dollars in it when you turn 75, you must withdraw $40,650.41 from the account that year. These funds work out to be a monthly income from your account of $3,387.53, though it will be subject to whatever the income tax rate will be when you retire.

Payout Calculator Example

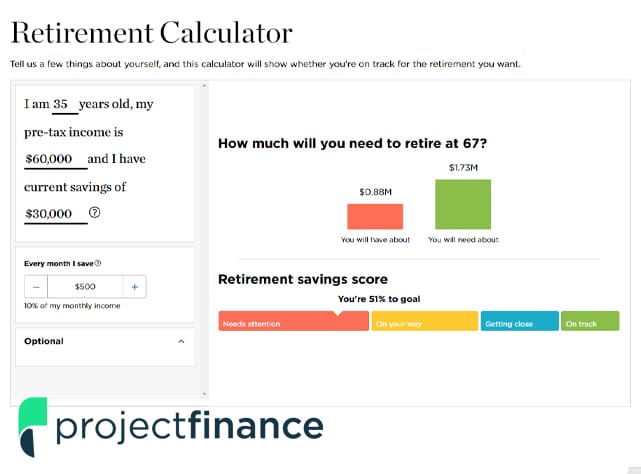
Assuming you have a flat one million in your retirement account is excellent for simple math calculations, but it’s unrealistic. To calculate how much you’ll have in your account at any given age, you will want to use a retirement calculator like this one. By filling in information about your contributions and your investment vehicles, you can estimate how much you’ll be getting paid in your retirement.

The truth is, the amount you earn in retirement will vary by too many factors to offer a simple answer. 

You can also always withdraw more than the minimum to maintain a standard of living you’re comfortable with.

The Dangers of Drawing on Principal

Before we wrap up, one thing to mention is the difference between principal and interest in a retirement account.

The goal of every good retirement plan is to have enough money set aside to live entirely off the interest it provides or near enough as it makes no difference. A sufficiently large investment, placed in a series of investments with high rates of return, will earn enough money each year to cover the minimum disbursement plus any extra you want to withdraw.
If you tap into the principal of the investment, however, your overall total investment value declines.

That gives you less leeway for future payments, but it makes the amount you earn from interest even lower. If you don’t take a lower amount of distribution to compensate, you can enter a cycle of ever-decreasing funds until you, eventually, run out of money.

Dangers on Principal

It’s impossible to say with certainty the threshold for this. You may notice that we’ve given very few numbers throughout this post.

That’s because everyone’s situation will be different. It will vary depending on factors like:

  • Your life expectancy
  • Where your money is invested and what the rate of return is
  • Market performance, which is impossible to predict, especially decades into the future
  • Chances to the tax and legal code that may make the situation better or worse for you
  • Your cost of living and how much money you will need to maintain your standard of living
  • Any medical conditions that will require ongoing treatment and the expenses associated with it

There are too many factors to consider. You can use calculators to estimate the minimum required distribution, but it’s an estimate. You can never know for sure until you’re actually at the moment of taking the money, at which point it’s too late to plan.

It’s always best to start investing as early as possible and invest as much as possible as soon as possible. The more you have in your investments, and the longer they have to grow, the less likely you will need to worry about it when you retire.

FAQ: How Much Cash Should Retirees Keep on Hand?

How Much Cash Should Retirees Keep on Hand

Saving is something many of us do throughout our careers. These savings are often divided between long-term and liquid investments, the latter of which can help pay for immediate expenses. 

General financial advice is to have 3-6 months’ worth of expenses tucked away in savings. The more liquid these funds are, the easier they can be withdrawn for emergencies. These funds can be used to pay for immediate needs, such as vehicles and sudden medical expenses. Alternatively, you can use these funds to cover the ongoing costs of living in the event of a loss of income, giving you leeway to find a new job.

Does this advice still hold once you reach retirement age? Probably not.


  • In retirement, your income drops and stabilizes; you begin to get payouts from your retirement accounts, social security, and similar sources.

  • More importantly, in retirement you no longer have penalties for withdrawing money from your retirement accounts beyond the loss of principal for the still-accumulating growth.

Meanwhile, other expenses can start to ramp up. Medical bills grow more common and more significant as we get older and our bodies wear.

Is having a 3–6-month emergency fund still relevant in this period of our lives? Should you have more cash on hand or less when you can pull from your retirement accounts as needed?

What Does Cash Mean?


Before we dig too deep, let’s take a moment to discuss what “in cash” means. As a retiree, you want to have money accessible when you need it.


Three Forms of Cash


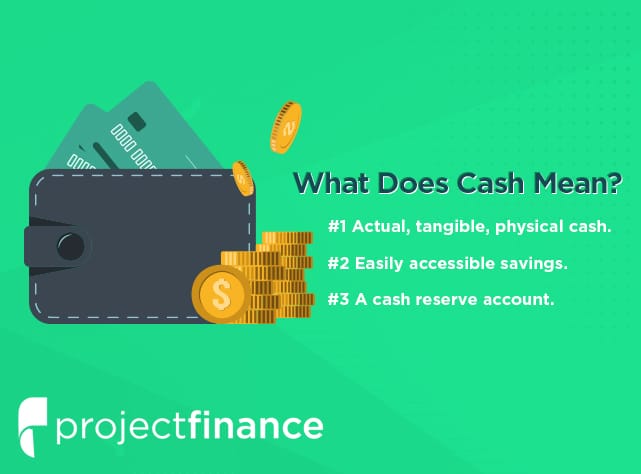
Three forms of “cash” get tossed around interchangeably, but they have slightly different implications.


  1. The first is actual physical cash. Most of the time, no one is advocating keeping cold, hard cash on hand. You may want some physical cash for everyday expenses, particularly if you travel to places where businesses may less commonly accept cards, but that’s pretty minimal these days. Keeping physical cash around was more of a habit for those who lived through the Great Depression, where investments bottomed out. Today, hoarding physical cash can even be risky; plenty of vendors no longer accept cash, preferring to handle everything digitally.


  2. The second is easily accessible savings. A savings account can have money pulled from it whenever you like and is often tied to a debit card for immediate purchasing power. This definition of cash is what most often what people talk about when they mention cash; it’s liquid, not tucked away in an account which you can only access indirectly, and it’s not there to linger and earn interest.


  3. The third is a cash reserve account. Cash reserve investments are generally tied to a currency’s value. These accounts can have interest rates ranging from near-nothing (keeping your dollar value 1:1 with the value of a dollar) or rising in times of economic hardship. Federal reserve rates have sometimes been as high as 5%, offering modest growth while the money is still reasonably accessible.

For today’s post, we’re looking primarily at #2, though #1 also qualifies. The idea is to draw a line between investments that earn interest and cash on hand. You can spend these funds immediately on anything from living expenses, medical bills, and leisure purchases.

Do You Still Need an Emergency Fund?

 
Emergency Fund


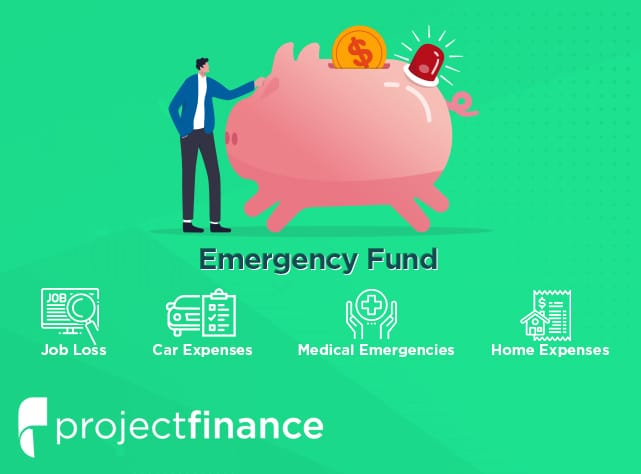
The point of an emergency fund is two-fold. 

  1. First, it serves as insulation against hardship. If you lose your income or have a sudden considerable expense, you need to cover it without defaulting on other payments or letting unfortunate events cascade. Losing a job can quickly shift into losing a vehicle or housing if you don’t have funds to keep paying those bills while you search for new income.

  2. The other purpose of an emergency fund is to have money on hand that you can tap into without touching your long-term investments. Before retirement age, if you want to tap into your assets, you can take out a loan against them (and kick the financial hardship can down the road until you have to repay it), or take an early withdrawal and pay a penalty fee for doing so.

Once you reach retirement age, though, do you still need that protection? You don’t need to take a loan against your retirement accounts; you can pull money from them with no penalty. Does it not, then, serve as an emergency fund itself?


Yes. You still want to avoid pulling from your long-term investments for a straightforward reason: growth.


You know by now that the point of long-term investing is to build up as much money as possible in your portfolio so that interest can compound. The more money you have, the more interest makes that money grow. The more interest makes money grow, the more money you have. It feeds back on itself.


When you pull money from your long-term investments, you lose that compounding growth. When you’re pulling out your income in retirement, the idea is for your investment to remain stable for as long as possible; you only pull from interest, so your core investment stays the same, and thus the interest stays the same.


The trouble happens in two ways.


  1. Firstly: tapping into the principal reduces the core amount of money that is earning interest. This reduces the amount of interest, further reducing your regular income. Tapping into your principal can start a dangerous loop, forcing you to reduce your investments until you eventually drain your account.


  2. Secondly: what happens if an economic downturn hits, as it did in 2008, or temporarily in 2020 due to Covid? Interest rates and growth plummeted during these periods. However, you need to keep paying your bills and cost of living. If you’re relying on your investments to pay your way, you have to tap into your principal. If you keep cash around, on the other hand, you can use these funds instead and ride out the financial hardship without worrying about making your investment position worse.

How Much Cash Should You Keep On Hand?


It’s impossible to give general numbers as to how much cash you should keep on hand in retirement. It all comes down to an examination of your expenses. Someone living in a home they own in a rural area in Tennessee will have significantly different costs from someone living in the Bay Area in a rented unit.


To calculate how much cash you should keep on hand, you first need to have a solid idea of your monthly expenses. Maybe you’re spending $3,000 per month on typical living expenses. Perhaps that number is closer to $10,000 for other people. Keep in mind that this number is likely to rise over time. The cost of living keeps going up in 2022, and everything from energy to food to medical care is most likely going to grow more costly.


The second thing you need to know is what other sources of income you may have. Even though you’re retired, you may have additional income streams. 


Cash to Keep on Hand


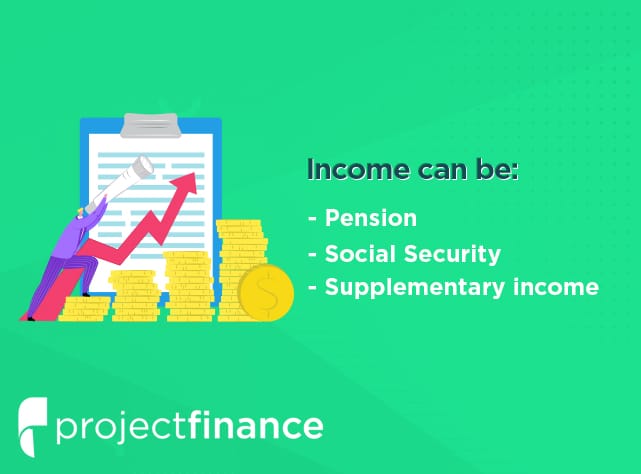
Income can come in a few forms:

  • If you’ve worked a career that has accrued a pension, that pension will pay out once you retire, with a fixed amount each year. Pensions are less common than they used to be, but they aren’t entirely gone quite yet.
  • Social Security. As a government-managed and public program, social security is a basic income for anyone of retirement age. Some people don’t qualify for social security income – exceptions include a variety of relatively narrow categories of people – but it still provides a consistent, if low, income for most retirees. There’s some doubt whether social security will still be available in a few more decades, but if you’re retiring now, you should have it.
  • Supplementary income.  Many retirees pick up hobbies they can monetize (for example, selling handicrafts online) or pick up a part-time job to have both preoccupation and income. You should count this income as well.


Now that you know how much it costs to live and how much you’re pulling in from various non-investment sources of income, what category do you fall in?
 

  • Under-covered. This scenario is by far the most common position. Your expenses are higher than your income. These expenses are paid with disbursements from your investments.
  • Your income and expenses balance out, so you can leave your investments alone.
  • Over-covered. You make more than enough from your non-investment sources; you don’t need to worry about running out of money right away.


Generally, it would help to calculate your necessary cash on hand based on the discrepancy between income and expenses. 


For example, suppose that your costs of living sum up to $7,500 per month. Your income covers a little under half of your expenses, leaving $4,000 per month to come from somewhere else, typically your investments. 


Let’s say you have $2,000 per month in a pension, $1,000 per month in social security, and $500 per month in part-time income.


Expenses Calculation


To calculate your emergency fund, decide how many months you want to be covered. Pre-retirement, the general recommendation is 6-12 months. In retirement, opinions differ. Some financial advisors say 12-18 months, while others say 24+ months. 


Consider this: the larger your cash on hand, the more insulated you will be from economic hardship by adjusting your investments. The markets can take between 6 and 18 months (or sometimes longer) to recover from a downturn, so you want at least that much set aside to pay expenses to avoid tapping into your investments which you’d be selling for a low value.


Moreover, different investment portfolios may take more or less time to recover. An investment made of half stocks and half bonds, for example, can take up to 40 months to fully recover from a downturn. 


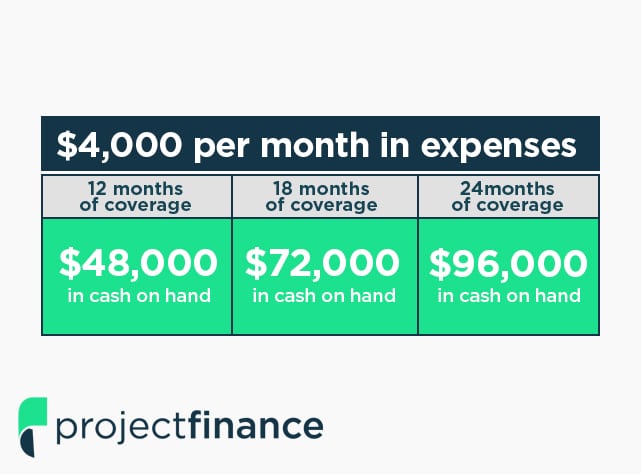
In our example, with $4,000 per month in expenses not covered by a stable income, you would want:

  • Twelve months of coverage, or $48,000 in cash on hand.
  • Eighteen months of coverage, or $72,000 in cash on hand.
  • Twenty-four months of coverage, or $96,000 in cash on hand.


So, somewhere between $50,000 and $100,000 is the right number in this hypothetical scenario. Your numbers will vary quite a bit depending on your unique living situation.

Just because you retired doesn’t mean you want to cash out all of your investments. Long-term investments can continue to grow as long as you have the luxury to let them. You never know how long you’re going to live after retirement or what unexpected expenses mar arise. 


You want your investments to stay as large and as stable as possible for as long as possible and only tap into them in the case of an unavoidable emergency.


Remember, as well, that you may have other sources of funds in an emergency. You may be able to leverage a home equity line of credit, the funds in a Health Savings Account, or other credit lines if you need them before tapping into your retirement accounts. 

Using Your Best Judgment


No one can predict what the markets will do. Over the long run, historically, they’ve gone up. Once you hit retirement age, you can no longer rely on long-term recovery from short-term downturns. To avoid financial hardship, it would help if you found the right balance of income and savings from various sources to insulate yourself from downturns.


Use Your Best Judgement


Everyone’s financial situation is unique. The best you can do is create a plan based on what you know and make the best judgment about your future. It may be worth talking to a financial advisor directly, considering all of the unique factors in your life. 


Are you close to retiring, or have you already retired? What is your primary intention for wanting to keep cash on hand? Do you have any questions for us on maintaining your retirement funds and maintaining an emergency cushion that you can access quickly? Please share with us in the comments section, and we’ll get back to you with a thoughtful answer to point you in the right direction!

Can You Contribute to Multiple 401(k) Accounts Simultaneously?

Contribute to Multiple 401k

The humble 401(k) is among the most popular forms of retirement account. It is typically employer-sponsored and often includes employer matching (to a point), allowing retirement funds to ramp up faster than other investment vehicles simply due to the additional influx of cash.

Before 1974, a few U.S. employers had been giving their staff the option of receiving cash in lieu of an employer-paid contribution to their tax-qualified retirement plan accounts. The U.S. Congress banned new plans of this type in 1974, pending further study. After that study was completed, Congress reauthorized such plans, provided they satisfied certain special requirements. Congress did this by enacting Internal Revenue Code Section 401(k) as part of the Revenue Act. This occurred on November 6, 1978.” – Wikipedia.

Though this form of retirement plan didn’t become popular until the 80s, it is now one of the most common plans available due to its benefits for employers and employees. Most companies that offer retirement benefits do so through a 401(k) plan today.

In the past, careers were stable. You could get a job and reasonably expect to work for that company for decades and possibly keep that same career to your retirement. Retirement parties were a common sight.

Today, company loyalty is at an all-time low, with many people job-hopping every 2-3 years. Companies often fail to provide avenues for advancement or raises, even to counteract the cost of living, so changing companies is often seen as the only way to progress in a career.

There are a ton of repercussions to this shift in employment culture, but one that many people overlook is the retirement plan. If you’re hired on to a company that offers a 401(k), and you work for them for three years, great! You have three years of contributions to your retirement account.

What happens if you leave the company and go to another that also offers a 401(k) plan? Chances are they’re with various brokerages or use different asset distributions. They open a new 401(k) for you, but your old one still exists.

Can you have two 401(k) plans legally? Can you contribute to both of them? Are there any salient details you should know?

Let’s dig in and find out.

Are There Legal Restrictions on Multiple 401(k)s?

First of all, there’s no legal restriction against having multiple 401(k) accounts. You can have multiple 401(k) accounts from W-2 employers, or you can have both an employer-sponsored 401(k) and an individual 401(k) as suits your needs.

  Legal Restrictions on Multiple 401ks

It’s pretty typical for people to have more than one 401(k). There are no laws or regulations against it. If you change jobs, you can keep your old 401(k), roll it over into your new account, consolidate it, or even take a payout.

However, there is one restriction: your old 401(k) needs to have at least $5,000 in it to maintain it. If it has less than that amount of money, the employer is entitled to shuffle that money around, often rolling it into an IRA. If your old 401(k) has less than $1,000, they will cash it out and send you a check.

The other limitation is that you cannot contribute to an old 401(k) from an employer you no longer work with. You can’t tell your new employer to contribute to your old account, nor can you contribute to it; after all, your old employer has no real incentive to help you with your retirement; they’re not allowed to do anything with those funds other than continue to manage them.

How to Contribute to More Than One 401(k)

So, wait. If you can’t contribute to an old employer’s 401(k), how can you contribute to more than one 401(k)? There are two options.

The first is having an employer 401(k) and an individual 401(k).

Individual 401(k)s are only available to people who have their own companies or are self-employed. Individuals with self-employment income and people who have C corps, S corps, or LLCs and no employees can create their 401(k) plans.

Contribute to More Than One 401k

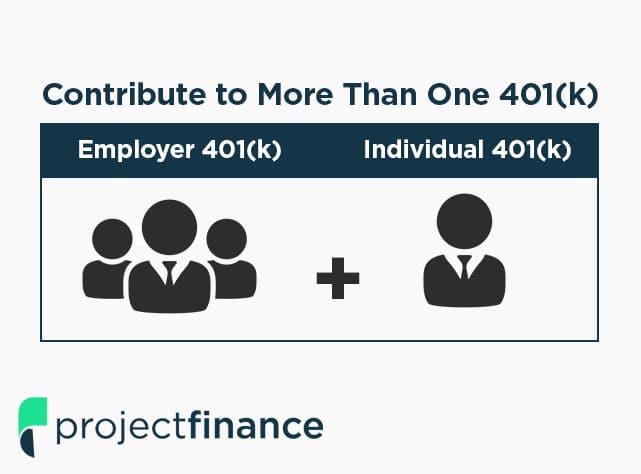
The individual 401(k) is unique in that the contribution limits are higher because you can “match” your contributions as both the employee and the business owner; you can “match” your contributions. This strategy isn’t “free” money the way an actual employer match is – since you’re contributing both sides, rather than one side coming from a company – but it effectively allows you to have a much higher contribution limit than a standard 401(k).

The second option is to have more than one job.

If you work two jobs, and both of them offer 401(k) plans to their employees, you are free to have both. In some cases, this can be a good idea because it allows you to access different asset mixes and funds and accrue more employer matching above the contribution limits.

What are The 401(k) Contribution Limits?

There are two relevant 401(k) contribution limits you need to know.

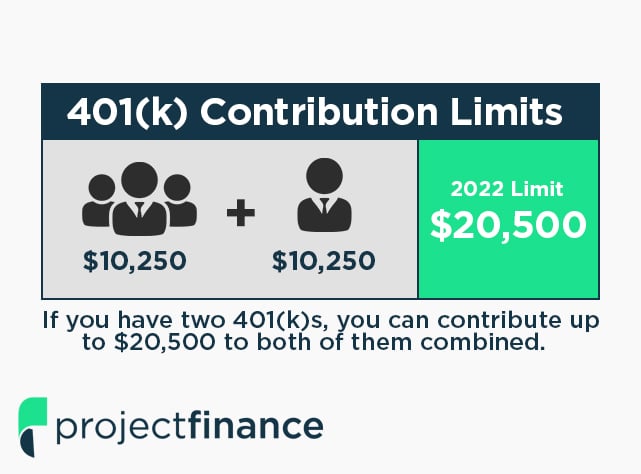
The first is the individual contribution limit. This contribution limit is a limitation that applies to all 401(k)s. In 2022, that limit is $20,500.

A 50/50 split means each 401(k) would support up to $10,250 and not a penny more. So, if you have one 401(k), you can contribute up to $20,500 to it. If you have two 401(k)s, you can contribute up to $20,500 to all accounts combined.

The distribution can vary. If you want to put $20,000 in one 401(k) and $500 in the other, you can do so. It would be best if you simply made sure neither employer over-funds your accounts through automatic contributions. If you over-contribute, you may be subject to additional taxes on the excess, and you’ll be required to remove the extra contributions, paying the 10% early withdrawal penalty. In general, over-contributing is penalized and isn’t worth trying to do.

Contribution Limit #1

There’s a second contribution limit, though, and it’s the most exciting. It’s the employer contribution limit. This limit, as of 2022, is $61,000. 

There’s one quirk, however. This limitation is calculated per employer rather than per employee.

In other words, both of your employers can potentially contribute up to $61,000 to your 401(k)s. If you work two jobs and have two employers, and all three of you max out your contributions, that’s $20,500 + $61,000 + $61,000.

Employer contributions are usually based on a percentage of the employee’s salary and contributions, carefully calculated to be as minimal as possible while still compelling to the employee. Very few companies will max out contributions for most of their employees. However, that’s a more social and political discussion than a legal one.

If you’re using an individual 401(k) as a self-employed person with a day job, you can contribute to both the employer and employee side of your individual 401(k). 

Contribution Limit #2

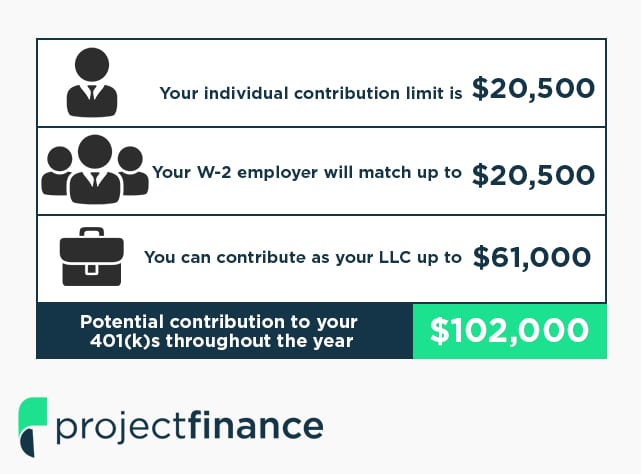
Imagine a scenario such as this:


  • You work a W-2 job with 401(k) matching, dollar for dollar, up to your contribution limit.
  • You have a lucrative LLC on the side.

You have three relevant values here:


  • You can contribute as your LLC by up to $61,000.
  • Your individual contribution limit is $20,500.
  • Your W-2 employer will match up to $20,500.

That means you can potentially have $102,000 added to your 401(k)s throughout the year. 

If your W-2 employer wanted, they could even contribute more, up to that $61,000 amount, though it’s relatively unlikely to happen.

This practice is perfectly legal; you simply need the funds to supply the account from your LLC.

Remember, too: if you’re over 49 years old, you can add “catch-up contributions” on top of your other contributions; the limits are higher for older people to better take advantage of a limited number of years of compounding interest.

Before we continue, there’s one more quirk you should be aware of: employee vesting. When you sign up for a retirement plan with an employer, they will usually have a clause about “vesting” in the employer contributions.

Vesting is partial ownership of the money the employer invests in your account. If an employer has, say, 20% per year vesting, it will take five years for you to be entitled to the total amount the employer has contributed. 

This contribution limit is essentially a way for an employer to avoid paying into an employee’s account, only to have that employee leave after 1-2 years and take the money with them. While most of the time, this wouldn’t be valuable to do anyway, some specific businesses and industries have excellent retirement benefits. Thus, vesting rules prevent it. It would be beneficial to do so.

In practice, what this means is that if you leave an employer before you are fully vested in their 401(k) contributions, they can keep some percentage of the money – the percentage you weren’t invested in. This limitation can be a rude awakening if you roll over an old 401(k), only to find that some portion of the value doesn’t come with you.

What to Do with Multiple 401(k)s

Suppose you find yourself in a situation where you have more than one 401(k). What should you do? What’s the correct move financially?

The truth is, there’s no one correct answer. Your best bet is to talk to a financial advisor directly. However, we can offer some general advice and scenarios.

What To Do With Multiple 401k Accounts

If you left a job with a 401(k) and you started a new career with a 401(k), you generally want to do something with the old 401(k). There are several reasons for this.

  • If the value is too low, under $1,000, the employer will cash out the old 401(k) in your name, and you will be subject to a penalty for early withdrawal.
  • If your old 401(k) value is under $5,000, the employer is not required to keep a handle on it and can force you to roll it over or otherwise claim it.
  • Since IRAs and 401(k)s are different accounts, they are subject to additional rules, asset mixes, and management practices. If you leave the retirement account alone, your employer will likely roll it over into an IRA for you to manage on your own. After all, the employer doesn’t want to manage your money when you no longer work for them.
  • If the old employer goes bankrupt or collapses, it can be challenging to track down and claim the money in the old account, especially years after the fact. Of course, you’re entitled to it, but getting ahold of it can be challenging and frustrating.

Generally, the best option is to roll over your old 401(k) into your new one, so your interest keeps compounding. There are occasionally good reasons to leave your old 401(k) in place, such as taking advantage of limited investment vehicles. Again, though, talk to a financial advisor about your specific situation.

Remember that you can’t contribute to a 401(k) managed by an employer you no longer work for. While they may be required to keep managing the money if it’s over $5,000, they are not required to allow you to pay into the account.

On the other hand, if you have two 401(k)s because you’re self-employed, you can use the contributions from the employer site to invest more than you “should” be able to invest. Careful management of employer matching with your W-2 job, plus maximizing your contributions as an LLC, can be a compelling way to save more for retirement.

Summing Up

To sum things up in brief:

  • Yes, you can have more than one 401(k) account.
  • Yes, you can contribute to more than one 401(k) account if you actively work for two employers (even if one of those employers is yourself).
  • Your individual contribution limit is shared across all 401(k) accounts, and you will be subject to taxes and penalties if you over-contribute.

Depending on your specific situation, there are a few potential benefits to having more than one 401(k). Still, you would do best to talk to a financial advisor directly about your particular circumstances to get the best advice.

Summing Up

Do you have multiple 401k accounts, or are you thinking of opening one? Are you worried about hitting contribution limits? Have you had trouble rolling over your 401ks, or are you worried you’re doing something incorrectly? Please share with us in the comments below, and we’ll do our best to point you in the right direction!

Next Lesson

QQQJ vs QQQM vs QQQN vs QQQE vs QQQ: What’s The Difference?

Comparing Nasdaq ETFs

In 2022, there are a lot of different Nasdaq funds to choose from. In this article, projectfinance will compare five of the more popular ETFs in the tech space: QQQJ, QQQM, QQQN, QQQE and QQQ.

It is important to note that a few of the funds on our list are almost identical (QQQ & QQQM), while others are quite different indeed (QQQJ & QQQE). 

So which fund is best for you? Let’s first break down the data from our 5 ETFs in a table, and then put each one under the microscope!

              TAKEAWAYS

  • The QQQ ETF tracks the Nasdaq 100 Index and is the oldest and most popular fund on our list.

  • QQQM is basically an exact replica of QQQ with lower fees.

  • QQQE tracks the Nasdaq 100 on an “equal weight” basis, which provides better diversification.

  • QQQJ tracks the next 100 stocks in queue for inclusion in the Nasdaq-100 Index.

  • QQQN tracks the next 50 stocks in queue for inclusion in the Nasdaq-100 Index.
QQQJ QQQM QQQN QQQE QQQ

Fund Issuer:

Invesco
Invesco
VictoryShares
Direxion
Invesco

Fund Name:

Fund Category:

Mid-Cap Growth
Large-Cap Growth
Mid-Cap Growth
Large-Cap Growth
Large-Cap Growth

Underlying Index:

Expense Ratio (fees):

0.15%
0.15%.
0.18%
0.35%
0.20%

Number of Holdings:

101
104
49
102
102

1 Year Return:

-7.92%
+14.06%
-8.07%
+4.56%
+14.15%

Morningstar Rating:

Not Rated
Not Rated
Not Rated
☆☆☆☆
☆☆☆☆☆

Fund Inception Date:

10/13/2020
10/13/2020
09/09/2020
03/21/2012
03/10/1999

Fund Structure:

ETF
ETF
ETF
ETF
UIT

What Is the QQQ ETF?

Invesco’s QQQ Exchange-Traded Fund (ETF) is the dinosaur on our list. It was one of the first NASDAQ funds issued and has been active since 1999. The next oldest fund on our list is QQQE, which began 13 years later in 2012.

The Invesco QQQ ETF passively follows the Nasdaq 100 index. 

➥ The Nasdaq 100 Index represents 100 of the largest US and international non-financial companies listed on the Nasdaq Stock Market.

Like most of the funds on our list, QQQ is dominated by big technology companies. The larger of these companies include the “FAANG” stocks – Facebook, Amazon, Apple, Netflix, and Google.

So how have big tech companies fared in the overall market, as indicated by the S&P 500 tracking ETF SPY?

Let’s find out!

QQQ vs SPY: 5 Year Chart

As we can see, QQQ has outperformed SPY considerably over the past 5 years. 

Let’s next take a look under the hood of QQQ by looking at its sector allocation strategy and top holdings. 

QQQ Sector Allocation

Image from Invesco

Ae we can see, Invesco’s QQQ ETF is more than just a tech fund. In addition to information technology companies, its sector allocation spans across multiple sectors and industries. 

But what companies in these sectors does QQQ invest in most? Let’s take a look at the big five next!

QQQ Top Five Holdings

Company Weight

Apple Inc

12.53%

Microsoft Corp

10.22%

Amazon.com Inc

7.32%

Tesla Inc

4.95%

NVIDIA Corp

4.00%

QQQ has huge exposure to AAPL. Why is this? The Nasdaq 100 is a modified capitalization-weighted index. AAPL is the largest company by market capitalization and therefore has the greatest weight. 

Not all ETFs on our list are weighted; QQQE (which we will soon get to) is an equal weight ETF. 

What Is the QQQM ETF?

Invesco’s Nasdaq 100 ETF QQQM has a lot in common with their QQQ fund. The stocks contained within these two funds are mirror images of each other. However, there are two differences worth noting:

QQQ vs QQQM: 2 Differences

  1. QQQ is structured as a UIT (unit investment trust) while QQQM is an ETF.
  2. QQQ charges a fee of 0.20%; QQQM charges a fee of 0.15%

QQQ being structured as a UIT makes no material difference on the performance of the fund when comparing it to QQQM’s performance. 

What should interest you here is the difference in expense ratios. QQQ does indeed charge a higher fee than QQQM. Though the difference is relatively small (0.05%), over time, fees and expenses can really add up.

What we have here, essentially, is two identical funds with one charging a higher expense ratio. QQQM wins every time. 

Read! ETF vs ETP vs ETN vs ETC: What’s the Difference?

QQQM Sector Allocation

Image from Invesco

QQQM Top Five Holdings

Company Weight

Apple Inc

12.53%

Microsoft Corp

10.22%

Amazon.com Inc

7.32%

Tesla Inc

4.95%

NVIDIA Corp

4.00%

What Is the QQQE ETF?

Both QQQ and QQQM track the Nasdaq-100 Index. This index is weighted.

The top 5 stocks in both QQQ and QQQM account for approximately 40% of these funds’ value. That’s not a lot of diversification!

To answer this desire for diversification, the NASDAQ-100 Equal Weighted Index was created. 

In 2012, Direxion created an ETF to track this index: The Direxion NASDAQ-100® Equal Weighted Index Shares (QQQE).

This ETF has equal weighting on all of its holdings. For example, AAPL (which is 12.5% of QQQs holdings) represents 1% of QQQE’s fund. 

Since the smallest company in this index has the same weight as the largest company, it is better diversified. 

However, this diversification comes with a price: QQQE charges a fee of 0.35%, the highest on our list. 

Is the cost justified? Let’s compare QQQ/QQQM with QQQE to find out. 

QQQ/QQQM vs QQQE

Though QQQE is a great alternative to the top-heavy QQQ ETF, its performance has lagged. Why? It places more weight on those smaller companies, which tend to be focused on consumer staples, industries, and utilities. 

Historically, these less volatile stocks underperform the FAANG juggernauts, as shown in the 5-year chart below.

QQQE Sector Allocation

The below chart illustrates the difference between sector allocation in QQQ/QQQM (as represented by XNDX) and the QQQE equal-weighted index (as represented by NETR).

Image from Direxion

QQQE Top 5 Holdings

Every one of the holdings within the QQQE ETF has the same weight of 1%.

Company Weight

Apple Inc

1%

Microsoft Corp

1%

Amazon.com Inc

1%

Tesla Inc

1%

NVIDIA Corp

1%

What Is the QQQJ ETF?

So far, we have only looked at ETFs that track the Nasdaq 100 Index. 

Invesco’s QQQJ Next Gen ETF tracks the NASDAQ Next Generation 100 Index.

These are the companies in the waiting pool to join the Nasdaq 100. There are no mega-cap stocks in this index. QQQJ is mostly comprised of mid-cap stocks. 

Stocks in this index are the less capitalized “up-and-comers” in the tech space. 

Because of this, QQQJ can be more volatile than the other ETFs we have covered in this list. 

QQQJ Sector Allocation

Image from Invesco

QQQJ Top 5 Holdings

Company Weight

Trade Desk Inc/The

2.18%

MongoDB Inc

2.00%

Expedia Group Inc

1.97%

Enphase Energy Inc

1.95%

CoStar Group Inc

1.82%

What Is the QQQN ETF?

Victory Shares Nasdaq Next 50 ETF QQQN tracks the Nasdaq Q-50 index

This ETF is similar to the QQQJ ETF, but QQQN only tracks the next 50 stocks in line to join the Nasdaq 100. 

Let’s do a quick 1-year comparison between QQQJ and QQQN. 

QQQJ vs QQQN: 1 Year Chart

As we can see, the performance of these two ETFs is quite similar. 

It is worth noting that the stocks within QQQN are better capitalized than those that comprise QQQJ. Because of this, QQQN should experience marginally less volatility than QQQJ over time. 

QQQN Sector Allocation

Image from VictoryShares

QQQN Top Five Stocks

Company Weight

BAKER HUGHES CO

3.46%

GLOBALFOUNDRIES INC

3.09%

TRADE DESK INC

2.97%

MONGODB INC

2.80%

ENPHASE ENERGY INC

2.72%

QQQJ vs QQQM vs QQQN vs QQQE vs QQQ: What's The Best?

A lot of the funds on our list are relatively new, so it is impossible to compare their long-term performance. 

  • QQQ, QQQM, and QQQE all track the Nasdaq 100 index.

  • QQQJ and QQQN track the more growth-centric companies just outside of the Nasdaq 100.

  • A well-diversified portfolio will have exposure to as many stocks as possible, including those within the Nasdaq 100 as well as those on the cusp of joining the index.

FAQs: QQQJ vs QQQM vs QQQN vs QQQE vs QQQ

QQQ is structured as a unit investment trust (UIT) while QQQM is structured as an ETF. Though their performance is identical, QQQM charges a lower expense ratio of 0.15% as compared to the QQQ fee of 0.20%

QQQ invests tracks the Nasdaq 100 index while QQQJ tracks Nasdaq Next Generation 100 Index (Index). This latter index invest in the 101st to the 200th largest companies on the NASDAQ.

Historically, QQQE has underperformed QQQ. QQQE’s equal weight structure applies more allocation to companies outside of tech, such as consumer staples and utilities. These sectors generally underperform in bull markets. 

Next Lesson

Options Straddle vs Strangle: How Do They Differ?

The straddle and strangle options trading strategies are very similar in nature. 

Both of these strategies allow investors to profit from large moves in an underlying security (long straddle/strangle) and neutral markets (short straddle/strangle).

The difference between the straddle and strangle lies in the strike price structure:

➥ The straddle only uses one strike price.

➥ The strangle uses 2 strike prices.

So what does this mean when comparing the performance of these two option strategies? Let’s find out!

              TAKEAWAYS


  • Both the long straddle and long strangle allow traders to profit from large upside and downside swings in a stock.

  • Short straddles and strangles allow investors to profit when the price of an underlying stock/ETF/index fluctuates very little over the duration of the options life.

  • The straddle has a higher degree of risk than the strangle.

  • Short straddles and strangles benefit from time decay (theta); theta works against long straddles and strangles.

  • Straddles and strangles are often sold around earnings to benefit from “vol crush”.

What Is An Options Straddle?

Long Straddle Video

Short Straddle Video

The options straddle strategy consist of two inputs:

  1. Buy/Sell 1 ATM Call Option.
  2. Buy/ Sell 1 ATM Put option.

To be a straddle, both options must be of the same strike price and expiration; the only difference is in the type of options. A straddle consists of both a call option and a put option

Buying at-the-money (ATM) call and put options will result in a long option straddle. Here is the profit/loss graph of this strategy at expiration.

Long Straddle

long straddle

Selling at-the-money (ATM) call and put options will result in a short options straddle. Here is the profit/loss graph of this neutral strategy at expiration.

Short Straddle

Short Straddle

Let’s next break own the various scenarios under which both the long and short straddle will profit, break even, and lose money. 

Straddle: Profit, Breakeven and Loss Scenarios

Long Straddle Short Straddle

Maximum Profit

Unlimited

Total premium received

Maximum Loss

Total debit paid

Unlimited

Breakeven Point

1) Strike A plus the net debit paid.

2) Strike A minus the net debit paid.

1) Strike minus the net credit received.

2) Strike plus the net credit received

Time Decay Effect (Theta) 

Sheds value as time passes, resulting is losses

Sheds value as time passes, resulting in profits. 

What Is An Options Strangle?

Long Strangle Video

Short Strangle Video

The options strangle strategy consist of two inputs:

  1. Buy/Sell 1 OTM Call Option.
  2. Buy/ Sell 1 OTM Put option.

The strangle is like the straddle in that this strategy too involves purchasing/selling both a call option and a put option of the same expiry cycle on the same underlying. There are, however, some pretty big differences. Let’s learn them next!

Options Straddle vs Strangle: Trade Setup

Straddle vs Strangle Difference #1: Moneyness

➥ The straddle generally involves purchasing at-the-money options.

➥ The strangle involves purchasing out-of-the-money options.

Straddle vs Strangle Difference #2: Strike Prices

➥ In the straddle, both options purchased are of the same strike price.

➥ In the strangle, the options purchased are of different strike prices. 

Let’s next take a look at the profit/loss graph of both a long strangle and a short strangle!

Long Strangle

long strangle at expiration

Buying an out-of-the-money call and put option with different strike prices of the same expiration cycle on the same underlying security will result in a long strangle, as visualized above.

Short Strangle

short strangle chart

Selling an out-of-the-money call and put option of the same expiration cycle on the same underlying security with different strike prices will result in a short strangle, as visualized above.

Let’s next break down the various scenarios under which both the long and short strangle will profit, break even, and lose money. 

Strangle: Profit, Breakeven and Loss Scenarios

Long Strangle Short Strangle

Maximum Profit

Unlimited

Total premium received

Maximum Loss

Total debit paid

Unlimited

Breakeven Point

1) Strike A minus the total debit paid.

2) Strike B plus the total debit paid.

1) Strike A minus net credit received

2) Strike B plus the net credit received

Time Decay Effect (Theta) 

Sheds value as time passes, resulting is losses

Sheds value as time passes, resulting in profits. 

Option Straddle Trade Example

Let’s first check out a straddle on Apple (AAPL).

➥AAPL Stock Price: $180

➥Days to Expiration: 10

➥Put Option Strike: 180

➥Put Option Premium: 1.49

➥Call Option Strike: 180

➥Call Option Premium: $1.51

So we can see here that the total cost (or credit) from this trade will be $3 (149 + 151).

Let’s fast-forward 10 days to expiration and see how this trade did. 

➥AAPL Stock Price: $180 –> $190

➥Days to Expiration: 10 –> 0

➥Put Option Strike: 180

➥Put Option Premium: 1.49 –> 0

➥Call Option Strike: 180

➥Call Option Premium: $1.51 –> $10

So how did we do? We must first determine which side of the trade we took.

Like all options strategies, the straddle can be both bought and sold. Let’s first see how the short side performed.

Short Straddle Trade Results

The initial price of our above straddle was $3. If we sold this straddle, we will profit as long as the combined value of both our short call and short put is trading under $3 at expiration.

At expiration, we can see that AAPL rallied $10 a share, all the way up to $190/share. 

This was good news for our short put. It fell in value from $1.49 to 0.

However, our short call did not fare as well. Since AAPL closed at $190 on expiration, our short call was in-the-money by $10, resulting in a final intrinsic value of $10. 

This means we lost $10 here. 

But remember, we took in a credit of $3 initially. Therefore, our total loss at expiration would be $7 ($10-3). Taking into account the multiplier effect of 100, this would result in a loss of $700.

Long Straddle Trade Results

If you understand how the short straddle works, you should have no problem understanding how the long straddle works. 

For the long straddle, we would have purchased both options originally for $3. This net debit paid is also our max loss. 

At expiration, the combined value of the put (worth $0) and call (worth $10) was $10. Remembering we paid $3 initially for this trade, the profit to us here is $7 (10-3), or $700.

This should make sense – if selling this strategy lost $700, buying it must make $700.


Option Strangle Trade Example

Let’s now check out a strangle on Netflix (NFLX).

➥NFLX Stock Price: $390

➥Days to Expiration: 20

➥Put Option Strike: 385

➥Put Option Premium: $16.10

➥Call Option Strike: 395

➥Call Option Premium: $15.90

So we can see here that the total cost (or credit) from this trade will be $32 (16.10 + 15.90).

Let’s fast-forward 10 days to expiration and see how this trade did. 

➥NFLX Stock Price: $390 –> $388

➥Days to Expiration: 20 –> 0

➥Put Option Strike: 385

➥Put Option Premium: $16.10 –> 0

➥Call Option Strike: 395

➥Call Option Premium: $15.90 –> $0

In this trade outcome, the price of NFLX did not move very much. This should tell you right away that selling options would be probably more profitable than buying options. 

Short Strangle Trade Results

At expiration, the combined value of both our short put and short call is $0.

Why? The stock closed at $388. Our 385 put is therefore out-of-the-money and valued at $0. Our 395 call is also out-of-the-money and also valued at $0.

What does this mean for us? We will collect the full premium of $32 received. Taking into account option leverage and the multiplier effect of 100, we will net a profit of $3,200 on this trade!

Long Strangle Trade Results

Since selling this straddle resulted in a profit of $32, the long party must have lost $32.

In order to establish this long strangle position, a trader paid a net debit of $32. If at expiration both of these options are worthless, this will translate to a complete loss of $32, or $3,200. Ouch!

Is The Straddle or Strangle Safer?

  • Neither the short straddle nor short strangle are safe strategies on account of their short call composition.
  • The short strangle has marginally less risk on account of its dual out-of-the-money structure.

  • Long strangles are generally cheaper to buy than long straddles. 
  • Since long strangles require a smaller net debit than long straddles, the maximum risk on long strangles makes them marginally safer than long straddles – probability aside.

When Should You Buy Strangles and Straddles?

Long straddles and strangles are best suited for traders who believe a stock is going to go up or down by a significant amount before the options expire.

 Both of these strategies are directionally agnostic. This simply means (for longs) we don’t care whether the underlying goes up or down, so long as it moves. The opposite is true for short positions in these strategies

Though long straddles cost more than long strangles, their chance of success is greater. Why? Both options bought are at-the-money. With long strangles, both the options bought are out-of-the-money, requiring the underlying to move a greater distance to achieve profitability. 

Straddles and Strangles: What's the Risk?

Straddle vs Strangle Risks

➥ For long straddles and strangles, the primary risk is time decay, or “theta”. Options are decaying assets. With every passing day, if the underlying price does not change, long straddles and strangles will shed value.

Since straddles and strangles are comprised of two options, theta occurs on both legs simultaneously in a stagnating market. 

Additionally, the underlying must move by a significant amount to breakeven on these strategies. This is particularly true in options with high implied volatility (IV).

➥ For short straddles and strangles, the risk is dually high. Theta works to the advantage of short options, but when an underlying begins to move significantly up or down, huge losses can occur!

In order to learn more about the risks associated with options, read this article from the OIC

Straddles and Strangles for Trading Earnings

The straddle and strangle are both great options strategies for trading earnings

Nobody knows how a stock will react post-earnings report. 

➥ For traders who believe a stock will make a significant move either up or down, the long straddle and strangle are great strategies to capitalize off this potential move. 

➥ For traders who believe a stock is not going to move very much post-earnings, the short straddle and strangle both allow traders to profit from the resulting “vol crush” (volatility crush) that often follows earnings reports. 

Read: How the “Straddle” Strategy Can Tell Us The “Expected Move” Post Earnings. 

Straddles and Strangles FAQs

Option straddles are comprised of “at-the-money” options. Option strangles are comprised of “out-of-the-money” options. Since out-of-the-money options are cheaper than at-the-money options, the strangle strategy is cheaper to buy than the straddle strategy. 

The riskiest options trading strategy is the short call (naked call). Both the short strangle and short straddle contain a short call and therefore have considerable risk. 

The iron condor is not a straddle. Straddles are comprised of two options while iron condors are comprised of four options. The additional options in the iron condor strategy help to offset risk. 

Next Lesson