Selling SPY Option Straddles | In-Depth Study

Short Straddle Chart

Selling straddles (a short straddle) consists of selling a call and put option at the same strike price and in the same expiration cycle. Typically, the at-the-money strike price is used because the short call and short put deltas will offset (at least initially), resulting in a directionally-neutral position.

Selling at-the-money straddles can be profitable when the stock price remains within a specific range around the straddle’s strike price, and/or when implied volatility falls.

Jump To

Likelihood of Max Profit & Large Losses

Since the maximum profit potential of a short straddle position only occurs if the stock price is right at the straddle’s strike price at expiration, realizing max profit on a short straddle is very unlikely.

On the other hand, large losses on short straddle positions occur when the stock price moves substantially outside the expected move, or implied volatility surges (typically combined with a notable market selloff). Both of which do not happen often.

The Study

With the previous points in mind, we wanted to know how often short straddle positions have historically reached specific profit and loss levels in relation to the initial entry price. The historical probabilities of profit and loss levels can help set realistic management expectations.

Here’s the methodology we followed for our short straddle profit and loss study:

1. Analyzed straddle positions in the S&P 500 ETF (SPY) from January 2007 to present.

2. On every trading day with a standard expiration cycle between 25-35 days to expiration (DTE), we “sold” an at-the-money straddle. We chose 25-35 DTE to target an approximate one-month straddle.

3. For each straddle position, we recorded the maximum profit and worst loss as a percentage of the entry price.

For example, if a straddle was sold for $1, a maximum profit percentage of 50% means the lowest price the straddle reached was $0.50 ($1 Entry Price x 50%). On the other hand, a loss percentage of 70% means the highest price the straddle reached was $1.70 ($1 Entry Price + $1 Entry Price x 70%).

Options Trading for Beginners(2)(1)

New to options trading? Learn the essential concepts of options trading with our FREE 160+ page Options Trading for Beginners PDF.

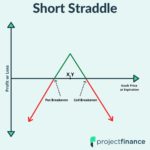
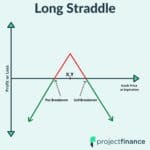
Results: Short Straddle P/L Frequencies

Let’s first look at the overall profit/loss frequencies for all of the 823 short straddle trades with 25-35 days to expiration:


SPY Short Straddle Profit & Loss Frequencies

As we can see from the above results, less than 50% of historical short straddle positions with 25-35 DTE reached profits greater than 50%, which can be explained by the fact that the stock price must remain in a tight range around the stock price to reach the higher profit levels.

Perhaps the most important finding is that at almost all of the profit/loss levels, a higher percentage of short straddles reached profits than losses of equal magnitude (i.e. 84% of trades reached a 20% profit but only 51% reached a 20% loss). This demonstrates that the market typically stays within the expected move, which leads to a high frequency of profits for short premium strategies.

How does implied volatility impact the results? Let’s look at the P/L frequencies for trades entered in the lower 25th percentile and upper 25th percentile of VIX levels over the test period.

P/L Frequencies: Low & High IV Environments

To quantify “low” or “high” implied volatility entries, we calculated the lower 25th percentile and upper 25th percentile of VIX levels on the days in which trades were entered:

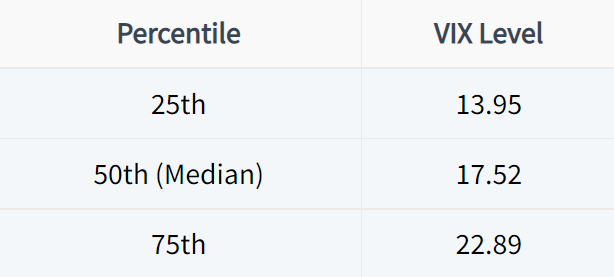
P/L Frequencies: VIX Below 14

Let’s start by looking at the profit/loss frequencies for the short straddles entered when the VIX was below 14 (the bottom 25% of VIX levels on the days of trade entries):


SPY Short Straddles: Profit/Loss Frequency w/ VIX Below 14

Interestingly, more of the short straddles reached the higher profit levels (50%+) when entered with a VIX below 14, but more of the straddles also reached the larger loss levels. An explanation for this is that when the VIX is at a lower extreme, it’s usually accompanied by abysmally low historical volatility, which just means the market’s daily movements are small. The smaller market movements translate to steadily decaying short straddles that don’t take much heat (assuming the market isn’t surging).

However, in the event that the market initiates an outsized move from a low VIX environment, the loss on a short straddle as a percentage of the entry credit can be high. For example, if a 200 straddle is sold for $5 in a low VIX environment and SPY is trading for $190 or $210 at the straddle’s expiration date, the loss on the straddle would be 100% of the credit received (since the straddle would be worth $10 but it was sold for $5).

However, if the 200 straddle was sold for $8 in a higher VIX environment, the loss on the straddle would only be 25% if SPY was trading for $190 or $210 at the time of the straddle’s expiration date (since the straddle would be worth $10 but it was sold for $8).

The above examples help explain why the loss levels were reached at a higher frequency when the straddles were sold in a low VIX environment.

P/L Frequencies: VIX Above 23

Here are the profit/loss frequencies of the SPY short straddles that were entered when the VIX was above 23 (the top 25% of VIX readings on the days of trade entries):


SPY Short Straddles: Profit/Loss Frequency w/ VIX Above 23

Of the three entry buckets (all entries, low VIX entries, and high VIX entries), the high VIX entries had by far the best results. As we can see, high VIX short straddle entries in SPY had substantially higher frequencies of profits at each level and lower frequencies of losses at each level.

When the VIX is high, it is an indication that one-month S&P 500 options are more expensive, which means straddles are more expensive. As a result, larger market movements are required for the short straddles to reach the higher loss levels. The opposite is true for low VIX short straddle entries (as discussed in the previous section).

Additionally, since high VIX environments have typically been short-lived since 2008, the short straddles entered in high VIX environments have benefitted from the volatility contractions as market volatility subsided.

Final Comparison

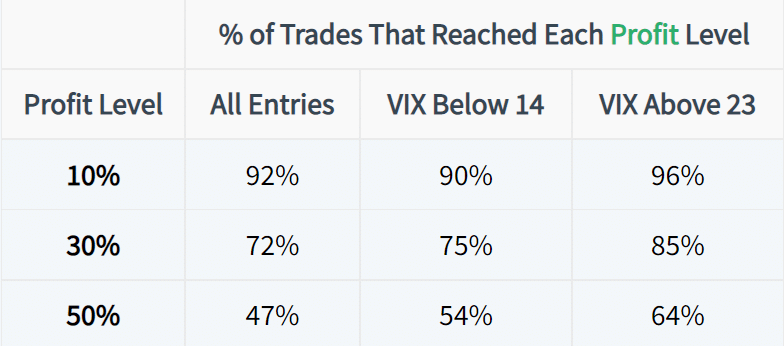
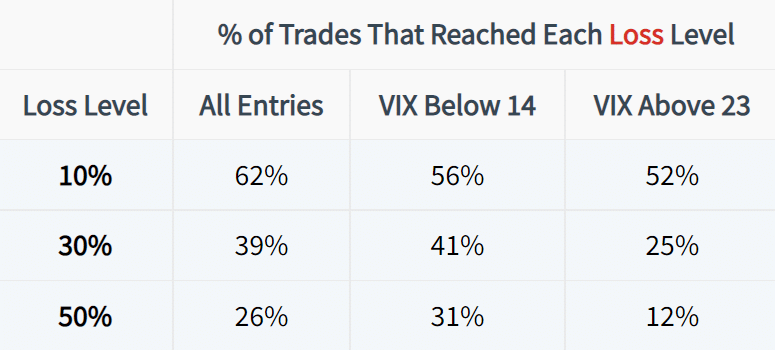
We’ll end with a side-by-side comparison of the most frequent profit/loss levels (10-50%) in each of the three entry filters (all entries, VIX below 14, VIX above 23). Let’s start with the profit frequencies:

winning trades

And the loss frequencies:

losing trades

As we can see, the low and high VIX environments showed improvements in the realized probabilities of short straddle positions that hit specific profit and loss levels. More specifically, the profit levels were reached at a higher rate and the loss levels were reached at a lower rate in both the low VIX and high VIX entries.

The high VIX entries had the highest percentage of trades that reached most profit levels, and the lowest percentage of trades that hit the same loss levels. As a result, selling straddles in high VIX environments over the past 10 years has rewarded those willing to take on the risk, as each spike in volatility was short-lived and premium sellers reaped the benefits of selling options with elevated prices.

Closing Thoughts

On a final note, keep in mind that we’ve primarily been in a low volatility environment since the financial collapse of 2008. During sustained periods of high implied volatility (and historical volatility), the results of the above tests may differ significantly.

When trading short straddles, be sure to have pre-defined profit and loss targets, and keep trade size small. As a lower-risk alternative, short iron butterflies can be traded to gain exposures similar to a short straddle but with limited loss potential. Hopefully, the above study can help guide trade management levels in different volatility environments for these types of trades.

Summary of Main Concepts

To quickly summarize what this post has covered, here are the key points to remember:

  • Since the stock price needs to be very close to a short straddle’s strike price at expiration, realizing maximum profit potential is a low probability event. In the same vein, the stock price needs to shift substantially for a short straddle to book a significant loss in relation to the entry price.
  • Historically speaking, less than 50% of one-month short straddles in SPY have reached the 50% profit level.
  • Regardless of the entry environment, one-month short straddles in SPY have reached each profit level more often than loss levels of the same magnitude (e.g. short straddles have reached 20% profits more often than they’ve reached 20% losses). This can be explained by the fact that the market trades within the expected move most of the time, resulting in frequent profits for premium sellers.
  • Short straddles entered with the VIX above 23 (the top 25% of VIX readings over all of the trade entry dates) realized the highest percentage of trades that reached each profit level and the lowest percentage of trades that reached each loss level. The strong performance can be attributed to short-lived VIX spikes, which have translated to profits from volatility contractions and time decay simultaneously.

Curious how the strangle compares to the straddle? Check out our article here, Straddles vs Strangles.

Chris Butler portrait

About the Author

Chris Butler received his Bachelor’s degree in Finance from DePaul University and has nine years of experience in the financial markets. 

Chris started the projectfinance YouTube channel in 2016, which has accumulated over 25 million views from investors globally.

Our Authors

Share this post

Leave a Reply

Your email address will not be published.