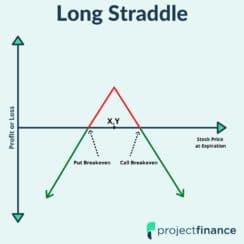
?> December 2021 - projectfinance

11 Tips for Options Traders

11 Option Trading Tips

If you want to become a successful options trader, you need a game plan. It’s that simple.

In this article, projectfinance aims to aid in this process by providing a checklist of useful tips. Be sure to read through the entire article, as many of our tips build upon the other ones. 

The first four options trading tips of our list pertains to setting up and entering trades. Let’s get started!

TAKEAWAYS

  • Both technical analysis and “delta” can be used to determine strike prices for a trade.

  • Always check an option’s “liquidity” before trading it. 

  • High probability trades = high risk.

  • Low probability trades = low risk.

  • Always try to fill a trade at its “mid-price” first.

  • Keep a logbook containing your complete trading history.

  • Don’t trade overlapping strike prices within a security.

1. Setting Up Your Trade

There are two popular methods of choosing the strike prices of options trades. 


  1. Use Technical Metrics
  2. Use the Greek “delta”

Let’s take a look at each of these individually.

Using Technical Visuals to Setup Trades

Many inexperienced traders simply choose their strike prices after studying the historical trading activity of a security. 

Though this can indeed work sometimes, it is important to know that past performance is not always indicative of future results. 

Let’s take a look at an example of this approach on Facebook (FB) stock. 

FB: 200 Level Resistance

After studying the above chart, we can see that FB has experienced resistance at the 200 level. A trader using technical analysis may, in this scenario, sell a call spread with the short strike price being at this 200 level. 

A better (and more mathematically sound) approach to choosing your strike prices is through the delta approach. 

Using Delta to Setup Trades

Using delta to choose your strike prices is a quantifiable system that both simplifies and streamlines the process of choosing strike prices. 

This article assumes you have a basic familiarity of delta. If the Greeks are Greek to you, check our article, Option Greeks Explained: Delta, Gamma, Theta & Vega.

So how does this process work? Let’s jump into an example. 

Delta on Options Chain

The above screenshot (taken from the tastyworks trading platform) has four deltas circled. These four options will comprise an “iron condor” trade strategy. 

  • Short Call Delta: 0.25
  • Long Call Delta: 0.10


  • Short Put Delta: -0.26
  • Long Put Delta: -0.10

An option’s delta estimates the options price change with a $1 movement in stock price. Delta also represents an options probability of expiring in-the-money.

Our short options, therefore have a ~25% chance of expiring in-the-money, which implies a 75% chance of expiring out-of-the-money, which is our goal since we are selling this iron condor. 

Using delta incorporates probability into our trading. When we only look at charts, our decisions are often arbitrary. 

2. Trade Liquid Strike Prices

Liquidity is very important in options trading. To determine the liquidity of an option, three metric must be checked:

  1. Volume (total number of contracts traded on a given day)
  2. Open Interest (total options outstanding)
  3. Spread (difference between the bid and ask)

Liquidity issues should not be a problem for more popular, front-month options. More exotic stocks, however, tend to have wide spreads and very low volume/open interest. 

It is, therefore, best to avoid these options. If a call is bid at $1, and offered at $1.90, that means (assuming you are filled at these prices) you will already have a 50% loss the moment you trade the option. 

Additionally, longer-term options (LEAPS) tend to have less liquid options than shoter-term options.

Take a look at the below two option chain for Tesla (TSLA). The first image shows front-month options. The second image shows options that expire 3 years into the future. 

TSLA: Front Month Options

TSLA: 2024 LEAP Options

TSLA LEAPS

Do you see how the volume and open interest plummets on the LEAP options? Additionally, you could park a truck between those wide markets!

3. Mind Your Risk!

When I began trading options, I only saw the upside. I fast learned to shift this mentality to focus on risk. 

Whenever you place a trade, always examine the maximum loss potential. Losses will occur in options trading. That’s inevitable. Developing your own trading philosophy is vital to your success. 

Just because a trade has a high probability of making money does not necessarily mean it is a good trade. Options trading is all about risk AND reward. 


  • High probability trades generally have little profit potential and a lot of risk.
  • Low probability trades, on the other hand, generally have a high-profit potential and little risk. 

4. Try to Fill at the Mid-Price

This is perhaps one of the more important tips on our list. 

When trading stocks, it is common practice to send “market” orders. These are essentially stop-loss orders in disguise. 

What does this mean? It communicates to the market maker that you want to get filled immediately, regardless of price.

DO NOT USE MARKET ORDERS FOR OPTIONS. EVER.

When I was working on a trade desk, I have seen market orders filled for 0.05, only to see that option trade at $1.00 seconds later. We used to call these order types “donations to the market-makers holiday fund.”

So what do you do? Always, always, always try and get filled at the “Mid-Price”. This price is between the bid and ask price. Whether you are trading single options or complicated options spreads, always start at the mid-point, then work your way down or up. 


Getting Filled at the Mid-Price

Options Mid Point

5. Set a GTC Order at Your Profit Target

The old Wall Street saying goes, “Bears make money, bulls make money, but pigs always lose.”

Perhaps it’s a bit harsh, but how true it is! Whenever you place a trade, always have a profit-taking plan in place

This number should be determined before you enter the trade. A GTC (good-’til-cancelled) order will be working in your account until 1.) your target is met or 2.) the option expires. 

6. Use Multiple Trade Exit Triggers

A “trade exit trigger” is an event that you use to determine when a trade is closed. Here are a few examples:

  1. Profit Targets
  2. Loss Limits
  3. Specific Stock Price Movements
  4. Amount of Time in a Trade
  5. Option Delta Breaching Level

Profit-Based Exit

A profit-based exit is simply closing a trade at a pre-determined profit level (as discussed above). I prefer to use percentages as opposed to dollar amounts. 

Example:
Sell an Iron Condor for $5.00 with a 50% profit target

Profit Based Exit Rule:
Buy back the iron condor for $2.50 (50% profit)

Delta-Based Exit

A delta-based exit is closing a trade at a pre-determined delta breach level.

Example:
Sell an Iron Condor on SPY
(0.25 short call and put delta)

Profit Based Exit Rule:
Close the iron condor if the call OR put delta breach the 0.35 level.

Time-Based Exit

Another good rule-based strategy is to simply close a trade after a certain amount of time has elapsed.

Example:
Sell an Iron Condor with 60 DTE

Time-Based Exit Trigger:
Close the Iron Condor after 30 days, no matter what.


7. Log Your Trades

log book

This may not be the most popular of the tips on our list. It is easy to see how our current trades are performing, but keeping track of historical trades can be important as well. 

Why?

Perhaps there is a certain security on which you only seem to lose money. Stocks can sometimes have their own personalities; some you get along with and others you don’t. If you are persistently losing money on certain trades, or certain stocks, why keep on doing the same thing?

If you trade a lot, sometimes it can be difficult to keep track of all of your trades. Having a sortable, online log will help you to keep track of every trade you ever placed.

If you don’t log your trades, you:

  1. Won’t be able to measure what’s working and what’s not.
  2. Won’t know the specific factors that may be influencing your success/failure rate

8. Trim the Fat

What do we mean by “trim the fat”? Eliminate what’s not working for you and focus on what is. Of course, this is where the above “trade log” comes in handy.

Becoming a successful trader is often accomplished by a process of elimination. If you have tried to make a certain strategy work time and time again only to keep losing money, it is probably best to avoid this strategy. 

Personally, I don’t have the stomach to sell naked options. Whenever the option goes in the red, all I can see is the max loss scenario, and I close the option out. Since I let emotion get in the way of these trades, I simply no longer do them. 


9. Experiment with Different Strategies

In options trading, there are dozens of default template trades. In addition to these, custom trades are only limited by your imagination. 

New traders often only buy call and put options. New traders, therefore, often lose money. Try doing a “vertical spread” if the long game isn’t working for you. 

After you’ve mastered this strategy, you can move on to more advanced trades like the  “iron condor” and “straddle”.  

When compared to stock trading, options trading can bet on literally any market direction movement.

But remember – start small! Experimentation can sometimes be costly!

10. Don't Overcomplicate Matters

When I used to work on a trading desk, I would often get calls from customers who had no idea what their actual options position in a certain underlying was. 

They would have dozens of various strike prices listed, and they simply couldn’t understand why a certain leg of their “iron condor” had disappeared. 

They usually, inadvertently, traded out of this leg while initiating another trade. This would often create some kind of funky ratio spread, or simply a flat position in that particular strike price. 

These Gordian Knot like scenarios can be a real nightmare. The solution? Keep it simple! Simply don’t overlap strike prices.  

Here are a few other ways traders overcomplicate matters:

  1. Trading too many positions with conflicting outlooks 
  2. Looking at arbitrary metrics to determine PERFECT entry/exit points
  3. Pairs Trading
  4. Complex strategy construction

11. Develop a 100% Quant Backed PLan

The ultimate goal of a beginner options trader is to come up with a trading plan that leaves NOTHING to the imagination. i.e., your emotions are completely dormant. 

This plan should incorporate:

  1. The Stock/Product
  2. The Strategy
  3. Specific Strategy Setup
  4. Exact Trade Size

Final Word

Success in options trading does not happen overnight. Mistakes will inevitably be made. 

The best approach (and perhaps the most important tip from this article) is to trade small. 

If you get emotionally excited about the upside prospects of a trade, you’ll probably lose in the long run. Success in options trading can often be linked to the psychology and philosophy of individual traders. This business isn’t for everyone. 

Next Lesson

Here’s What To Do at Option Expiration

Option Expiration

TAKEAWAYS

  • Unlike stocks, all options will eventually expire

  • The expiration date of an option marks the last day that it can be traded. After this date, both calls and puts will be null

  • In-the-money options post-expiration will be exercised (long options) or assigned (short options) 100 shares of stock

  • Out-of-the-money options post-expiration will expire worthless; no action is required 

  • The closer an option is to expiration, the greater the liquidity on that option will be

Options are unlike stocks in that every single one will eventually expire. This time is known as the “expiration date”.

Option Expiration Date Definition: In options trading, the “expiration date” is the last day on which an option holder can “exercise” their contract. After this date, the derivative is rendered null.

Back in the day, all options expired on the third Friday of every month. When I worked on a trade desk, this was always the busiest day of the month for us, particularly in very bearish or bullish markets. 

Over the last 20 years, however, additional expiration dates were added to match exploding demand. The vast majority of options fall into one of the three below categories:

Option Expiration Types

If you’re an options trader, knowing what happens to an option at the end of its life is of utmost importance. 

If your option is out-of-the money at the moment it expires, you don’t have to do anything. If that option is in-the-money, actual will be required.

In this article, projectfinance will review option expiration, as well as the appropriate actions traders must take to avoid potentially significant monetary consequences.

When Do Options Expire?

When looking at an options chain, you will see all the various expiration cycles that a particular security offers.

The below options chain on SPY, an S&P 500 tracking exchange-traded fund ETF, is taken from the tastyworks trading platform.

SPY Expiration Dates

SPY expiration dates

We can see in the above image that some options expire today, and other options expire several weeks into the future. 

If we were to continue scrolling down that chain, we would see options that don’t expire for years!

These are known as Long-Term Equity Anticipation Securities (LEAPS).

Most options expire at the market-close on their listed expiration date. Some ETFs and indices, however, continue trading until 15 minutes after the closing bell. 

It is therefore important to monitor your positions thought the entirety of its last trading day. 

Let’s next explore what actions need to be taken at expiration.  

What to Do on Option Expiration?

At option expiration, a trader has one of three choices:

  1. Sell (or buy back) the option in the open market.
  2. If a long option is in-the-money at expiration, the option will be exercised automatically, resulting in 100 long shares (calls) or 100 short shares (puts) of stock.
  3. If an option is out-of-the-money on expiration, it will expire worthless; no action is required. 

Let’s take a closer look at each of these now.

1. Close the Position in the Market

Call and put options can be closed at any time. Beginner traders often falsely believe a contract has to be held until its expiration date.

To close your option, simply create the exact opposite order that you set up to initiate the position. The vast majority of long option positions with value are exited before expiration to avoid being exercised and converted to stock. 

2. Moneyness and Expiration

Option Moneyness Chart

All options exist in one of three “moneyness” states. 

1.) In-The-Money

If the strike price of a call option is below the stock price, the call option is in-the-money.

If the strike price of a long put is above the current stock price, that put option will be in-the-money.

2.) At-The-Money

At-the-money options have a strike price that is trading at or very near the current security price. However, just about all options will be in or out-of-the-money; this term is used as a generalization.

3.) Out-Of-The-Money

A call option is considered “out-of-the-money” when its strike price is above the current stock price.

A put option is considered “out-of-the-money” when its strike price is below the current stock price.

If you fail to trade out of an option that is “in-the-money” at expiration, your contract will either be automatically exercised by your broker (long options) or assigned (short options). 

This can create a lot of unnecessary risks for traders. Being required to either purchase or sell 100 shares of stock requires a lot more capital than holding a call or put option. If you don’t have the funds to hold this equity, your broker will place you in a margin call. If this call is not met, your account will be liquidated!

The smart thing to do is close out of all in-the-money or at-the-money positions before the closing bell rings on the expiration day. When a stock is hovering near the strike price at expiration, this is known as “pin-risk“. Smart traders close these options well before the bell. 

3. Worthless Options at Expiration

Options that are out-of-the-money on expiration will expire worthless.

For long options, this means a total loss. Short options, however, will see a maximum profit.

When an option is worthless, that means it is zero bid. This means nobody is willing to buy that option. You can’t even sell these options for a penny. 

AAPL Put: Zero Bid

So what do you do? Nothing. The position will simply disappear from your account. But at least you get a tax write-off!

Option Expiration and Assignment / Exercise

If you do indeed neglect to trade out of a long or short in-the-money option before expiration, you will be assigned/exercised. 

The below table shows how many shares of stock will appear in your account the following trading day for various option types. 

Depending on the security you are trading, 100 shares can be A LOT of money. And that’s only for a one lot!

Currently, 100 shares of Amazon (AMZN) would cost you $338,300.

At the moment, an at-the-money call expiring in a few days on AMZN is trading at $14. Taking into account the multiplier effect of option leverage, the total risk here is only $1,400.

That’s a pretty substantial difference in maximum loss potential!

Option Expiration and Liquidity

As a rule, liquidity increases for an option cycle as its expiration nears. An option on Tesla expiring tomorrow is going to have much tighter markets when compared to an option of the same strike price expiring one year away.

There are three metrics to measure liquidity: 

  1. Volume (number of contracts traded on a given day)
  2. Open Interest (total options outstanding)
  3. Spread (difference between the bid and ask)

Now let’s see these metrics in action. 

The below options chain for TSLA (taken from the tastyworks trading platform) shows the markets for options expiring on this stock in 2 days.

TSLA: Front Month Options

Notice how tight the markets are here? Additionally, both the open interest and volumes are very high. This gives me confidence in trading these options.

Now let’s look at some TSLA options expiring in 2024, two years away from today’s Jan. 1st, 2021 date. 

Look at how wide the markets are in these options, in addition to very low volume and open interest. Unless you plan on holding a LEAP for a long time, stay away! 

TSLA: 2024 LEAP Options

TSLA LEAPS

Final Word

Understanding exactly what happens on an options expiration date is very important. If you’re new to options trading, please check out our Options Trading for Beginners article below. 

In this business, it’s far better to be over-prepared than under-prepared.

If you’d like the 2022 expiration calendar from CBOE, find it here.  

Leverage in Options Trading Explained w/ Visuals

Options Leverage

When compared to stock trading, options trading can offer investors leveraged exposure to a security. This exposure is accessed by buying call or put options. Both of these option types typically represent 100 shares of an underlying stock. The premium paid for these derivatives, however, costs only a fraction of what buying 100 shares of the actual stock would cost. 

It is because of this 100:1 ratio that option contracts can sometimes react quite explosively to only minor fluctuations in the underlying stock price. There are a lot of factors that go into determining how options react to environmental changes, and the Greeks go over each of these risk metrics.

This article, however, is going to focus specifically on leverage in options trading. 

In order to understand option leverage, we must first understand how and why options contracts are “Standardized.”

TAKEAWAYS

  • When compared to stocks, options offer investors much greater leverage.
  • Like stocks, options contracts can be bought or sold. The holder (owner) of an option contract has the right to either purchase stock (calls) or sell stock (puts) at the contract’s strike price
  • All option contracts are “Standardized”
  • Option type, strike price, expiration, and share representation are all standardized
  • Options are leveraged at a ratio of 100:1, meaning one option represents 100 shares of stock. This leverage increases risks

Standardized Contracts

Quite some time ago, options contracts became standardized. This standardization process helped produce a trading environment that is both liquid and easily regulated.

The below are the standardized terms of all option contracts.

  • Option Type
  • Strike Price
  • Expiration Date
  • Share Representation

Let’s take a brief look at each of these now. 

1. Option Type

All option contracts are either calls or puts:

  • Call Options give the purchaser right (but not the obligation) to purchase 100 shares of a stock at a specified strike price on or before a set expiration date. 

  • Put Options give the purchaser the right (but not the obligation) to sell 100 shares of a stock at a specified strike price on or before a set expiration date.

2.) Strike Price

All options contracts have a strike price. This is the price at which stock can either be bought (calls) or sold (puts) should the long option purchaser decide to exercise their right.

3.) Expiration Date

Options are decaying assets. Each and everyone will expire at some point in the future. Expiration dates can range from days to years into the future.

4.) Share Representation

Almost all option contracts give the owner the right to purchase (calls) or sell (puts) 100 shares of an underlying stock at the specified strike price. There are a few exceptions to this rule, which we will soon get into.

Why Are Options Standardized?

All option contracts incorporate the above terms. Why is this advantageous?

Let’s say you want to create a contract that allows you to sell 13 shares of AAPL at exactly 176.43 on or before January 14th. 

These are very specific terms. It would take time for your counter-party to decipher these terms before agreeing to them. Additionally, since these terms are so custom-tailored, the regulation would be impossible. How can an agency take the time to look at every one of these contracts individually?

They couldn’t. There are indeed custom-tailored contracts between parties, but these are known as “swaps”, and are often exchanged between large financial institutions. 

The standardization of options offers investors 2 great advantages:

1. Liquidity

Liquidity is the ease with which a position can be entered and exited. Since terms like the strike price and expiration date are set in options, market makers already know what they are dealing with the second an order is received. Fills are usually instantaneous for this reason. 

2.) Regulation

The regulation of the options market eliminates counter-party risk. If these financial instruments weren’t regulated, they would behave more like “swaps”, which present substantial counter-party risk. In options trading, The OCC guarantees that a counter party (or broker) will make good on the terms of the contract.

Now that we have the elementary stuff down, let’s take a closer look at option leverage!

Option Leverage in Action

Take a look at the below options chain for Tesla (TSLA).

TSLA Options Chain

Option Contract = 100 Shares

The squared number tells us that every option under that expiration cycle represents 100 shares of stock. This is the standardized share representation for one option contract, be it a call or put. 

However, one option contract does not ALWAYS represent 100 shares of stock. When the stock of a company (or ETF/ETN) splits, that means that the outstanding options will no longer represent 100 shares of stock. All new options will, but the pre-existing ones will be “adjusted”.

One particular ETN (exchange-traded note) that splits quite frequently is VXX. Take a look at the adjusted options of VXX, which are mixed in with standardized options. 

VXX Options Chain

VXX Adjusted Options

For a few of the above expiration cycles, we can see that one options contract represents not 100, but 25 shares of stock. These are tricky options to trade, and I avoid them for this reason.

But no matter how many shares an option represents, its quoted price must always be multiplied by 100 in order to determine its true dollar cost. 

This brings us to our next topic: the cost of options.

Determining The Cost of Options

Take a look at the below options chain. 

AAPL Options Chain

By looking at the top of the above options chain, we can see that the quote “ask” price of the 170 call option is 2.53.

So would it cost us $2.53 to purchase this option? I wish. In order to determine the true out-of-pocket cost for any option, we must move the decimal point two places to the right. 

As we can see in the lower part of the image, the true cost of this trade is $253. This is because of the “multiplier effect”. Since a call or put contract gives the buyer the right but not the obligation to either buy (call) or sell (put) 100 shares of a stock, we must multiply this number by 100. 

If options represented only one share of stock, this call would cost us $2.53. But, as we are learning, options are standardized contracts.

Utilizing Leverage

Because of their highly leveraged nature, options offer investors two advantages over stocks:

  1. Magnified profit (and loss) potential
  2. Less principle risk

Let’s examine each of these individually.

Options vs Stocks: Return Potential

Sometimes, it is possible to make more on an option than a stock should that stock move in a direction that is favorable to the option.

Let’s take a look at an example employing a LEAP (long-term equity anticipation securities) which is simply an option that expires greater than one year from the present. 

Let’s assume one year ago today we were bullish on the overall market. We purchased a LEAP on SPY, which is an S&P 500 tracking ETF

The below image shows the performance of our option.

SPY Call : One Year Chart

We can see that we originally purchased this option for about $5, for an out-of-pocket cost of $500. SPY had a fantastic year, and we can see towards the end of the options life our call was trading at $40 ($4000).

That means we netted a return of about 700%. Not bad!

How would we have done if we purchased the stock instead? Let’s look at that outcome next.

SPY Stock: One Year Chart

SPY Stock 1 year Chart

So we can see that we would have made money on the stock as well. But not nearly as much! The stock would have netted us a solid return of 28%. This pales in comparison to the performance of our LEAP. 

It is important to note that 2021 was a VERY bullish year. These types of returns are not normal for options. Remember, if the stock had gone nowhere, we would have lost our entire premium of $500 on the call, but our stock position would still be at breakeven.

Options vs Stocks: Principle Risk

If we were to purchase 100 shares of AAPL, that would currently cost us $16,900. If we were to purchase an at-the-money call option on AAPL expiring next month, however, that would only cost us $600 presently. 

What is our maximum risk on the stock? Since any stock can go to zero, our maximum risk here is our entire investment of $16,900.

The maximum loss on any option purchased is the debit paid. Therefore, the most we can ever lose on our option is $600.

So maximum risk is indeed reduced when buying options as opposed to buying stock. 

However, in order for our option to be profitable in a month, we need the stock to go up quite a bit in value. If the stock is unchanged in a month, we will lose our entire $600. Now if we bought stock instead of that option, we would have neither made nor lost money if the stock was unchanged in a month. 

Additionally, it is very unlikely we will realize a maximum loss on AAPL stock. It is very likely, however, that we will realize a maximum loss on our options contract.

It is important to note that 2021 was a VERY bullish year. These types of returns are not normal for options. Remember, if the stock had gone nowhere, we would have lost our entire premium of $500 on the call, but our stock position would still be at breakeven.

Final Word

Options are great tools to help diligent traders capitalize from a future potential movement in a stock price. There is a reason, however, that most retail options traders lose money. 

For every day that a stock (or ETF, index, etc.) doesn’t move in your direction, your long option contract will decrease in value. This is known as “theta” and is one of the options Greeks. Understanding these vital risk management metrics are often ignored by beginner traders. 

Option trading is not free money. Most of the profits made in options trading is done so by selling options rather than buying them.

Next Lesson

5 Major Risks of Options Trading

Risky

When you’re trading stocks, your only true risk is directional. If you’re long a stock, your risk is that this equity will down in value. If you’re short a stock, your risk is this equity goes up in value. As long as the markets are “liquid”, these are the only true risks in stock trading.

Options trading, on the other hand, introduces traders to a myriad of risks. 

In order to understand the risks of derivatives, we must first understand what, exactly, options are. If you already know these basics, please skip ahead directly to the 5 risks of options trading.

TAKEAWAYS

  • Call options are leveraged bullish market bets; put options are leveraged bearish bets.
  • Options are decaying assets. An options time decay, or “theta”, refers to the rate at which an option price declines as time passes in a constant environment.  
  • Implied volatility risk occurs after major events, such as earnings and economic data. 
  • Dividend risk applies to short call positions and occurs in the days leading up to the “ex-dividend” date.
  • Pin risk occurs when the price of a stock/ETF is trading very close to the strike price of an option in the moments leading into expiration.
  • Memory risk is perhaps the most important on our list. Options traders must remain diligent.

Options Trading Explained

An option is a financial instrument that allows an investor to place leveraged bets on an underlying security. This exposure can either be on the upside or downside. Options can also be used as vehicles to hedge, but this article is going to focus on options as financial instruments of speculation, as this is how most investors employ them.

One option contract almost always represents 100 shares of stock. This great leverage introduces great risks.

There are only two types of options; call options and put options. Call Options are “bullish” bets while “put options” are bearish bets. Let’s next examine each one of these contracts closer.

Call Options Explained

Long Call

Call Option Definition: A call option is a contract that gives an owner the right, but not the obligation, to purchase 100 shares of a stock at a specified strike price on or before an expiration date.

Call options are bullish. If you believe a security will go up substantially in value, a call option can offer you:

Let’s say AAPL is trading at $170 per share. You think, that by next month, the price of AAPL will surpass $180 dollars. Let’s take a look at the details of an options trade that would profit should AAPL exceed $180 in one month.

Here are the details of our trade:

AAPL Stock Price: $170

Call Strike Price: 180

Call Price: $3 ($300)

Expiration Date: January 17th (30 days away)

So we paid $3 for this call option. You will recall earlier we mentioned that one option contract represents 100 shares of stock. Though the quoted price of this option is $3, we actually paid $300 for it.

Let’s fast forward 30 days now to expiration and see how our trade did!

Call Outcome #1: Maximum Loss

So let’s say a month has passed. We were wrong. AAPL is trading at only $179. Of course, it went up in value; but not enough for us. In this scenario, since the stock price did not reach our strike price by the expiration date, our call will expire worthless.

This 180 strike price call gave us the right to purchase AAPL stock at $180 per share by our expiration date. Since the stock is trading below this price, why in the world would we exercise our right to purchase the stock at a higher price? We wouldn’t. Therefore, our trade results in a maximum loss of $300.

Call Outcome #2: Profit

In this scenario, let’s say AAPL rallied all the way to $185 in value on expiration day. How did we do?

A lot better! Our 180 strike price option is “in-the-money” by $5 here. So did we make the difference of $500? Not quite. Remember, we paid $3 for the option to begin with. Therefore, this $3 must be subtracted from our $500 profit. To determine our net profit, we simply subtract this premium paid of $3 from the amount the option is in-the-money by ($5), giving us a net profit of $2. Taking into account the multiplier effect, this $2 would represent $200 in profits.

Could we have made more than this? Sure! Since there is no cap on how high a stock can go, a long call has infinite profit potential.

Put Options Explained

Long Put Chart

Put Option Definition: A put option is a contract that gives the owner the right, but not the obligation, to sell 100 shares of a stock at a specified strike price on or before an expiration date.

Everything we learned of call options is true of put options, with one major difference: put options bet on a downward move in the stock. 

Let’s take a look at that same trade, but this time we think AAPL will be trading not at $180 in one month, but $160, making us bearish. We will therefore buy a put option.

Here are our trade details:

AAPL Stock Price: $170

Put Strike Price: 160

Put Price: $3 ($300)

Expiration Date: January 17th (30 days away)

Put Outcome #1: Maximum Loss

So let’s say the 30 days have passed and our put option is expiring. AAPL is trading at $165 on this date. Our put option gives us the right to sell 100 shares of AAPL at $160 per share. 

When you sell a stock, you want to sell it for as much value as you can. Therefore, why would you sell stock at $160 per share when the current market value is $165?

You wouldn’t. Therefore, this 160 strike price put option will expire worthless, and we will lose the entire $3 ($300) premium we paid for it.

Put Outcome #2: Profit

In this scenario, let’s say AAPL fell all the way to $152 on expiration day. Our 160 strike price put is therefore in the money by $8 ($800). 

But did we make $800? Not quite. Remember, we need to subtract the debit paid from this amount. We paid $3 ($300) for this option, therefore we will see a net profit on this trade of $500 ($800-$300).

In a nutshell, these are the basics of options contracts. If you’d like a complete lesson, please check out our video, Options Trading for Beginners below. 12 million views and counting!

Let’s now take a look at some key risks in options trading. Bear in mind that these are only a few of the more salient risks: options trading has dozens of them!

1.) Time Decay Risk

Options, unlike stocks, have a lifespan. They are decaying assets. If you buy a 180 call on a stock that is trading at $175, and in a week from now the stock price hasn’t changed, your call option will most likely go down in value. This is assuming implied volatility hasn’t changed.

Why will it go down? Because as time passes, the odds that that stock has of reaching your strike price have diminished. This is known as “time decay”.

Professional options traders rely on a set of risk management metrics called “The Greeksto mitigate risk. There is indeed a Greek pertaining to time decay, and it is called “theta”.

Theta tells us how much an options contract will go down over the course of a day should all else (stock price and implied volatility) remain the same. The below table shows us how this Greek interacts with a long call position.

Type Strike Price Theta

Call

147

3.25

-.52

Call

148

2.63

-.56

Call

149

2.11

-.54

For each day that passes, in an environment where all else remains constant, the theta values above tell us how much each corresponding option will decline in value.

So time decay is indeed a risk to option buyers; but what about option sellers? If you buy an option, somebody has to sell you that option, right? Traders’ short options love time decay, because, unlike option buyers, they want that option to go down in value.

2.) Volatility Risk

Option Premium

An option’s value is comprised completely of extrinsic and/or extrinsic value.

Intrinsic Value DefinitionIn options trading, the intrinsic value represents the value of an option should that option be exercised at the moment of observation.

Extrinsic Value DefinitionIn options trading, the extrinsic value represents all option value that is not intrinsic value.


So what, exactly, comprises extrinsic value?


  1. Time Decay
  2. Implied Volatility

We just learned above about time decay. Let’s now explore the other half of extrinsic value – implied volatility.  This metric also happens to be our next options trading risk.

All options have assigned implied volatility. This figure tells us the expected move of an underlying security over a certain time frame. 

In addition to different stocks having different implied volatility levels (IV), the different expiration cycles within each stocks options chain have their own unique IV levels, as illustrated on the tastyworks trading platform below.

Implied Volatility per Expiration

If a company is to release earnings in the days ahead, this will probably cause the stock to either go up or down more in value than on a normal trading day. Because of this, events like earnings (or even economic news) can jack up IV levels.

Guess what happens after the news is released? Bingo. The IV levels (usually) drop. This is referred to as “volatility crush” and is a great risk to long options traders. When the IV of a specific options expiration goes down, so does the premium of all options listed under this expiration.

Just like with time decay, this is a negative for long option positions but a positive for short options. 

3.) Dividend Risk

Dividends

Dividend risk applies to all short call option positions on a dividend issuing security.  

Owning stock comes rights. One of these is the right to share in corporate profits via dividends. Options, however, have no such rights. Therefore, sometimes, it makes sense for a long call to exercise their right to purchase stock before a dividend is issued to collect this dividend. This poses a risk for short-call positions. 

In the time leading up to the “ex-dividend” date, assignment risk on short in-the-money calls can rise. 

If the value of the issuing dividend exceeds the value of a short call option, dividend risk is indeed present. 

4.) Pin Risk

Pin Risk Definition: Pin risk arises when the price of a security is trading very close to the strike price of an options contract at the moments leading up to expiration

A lot can happen in the moments leading up to an options expiration. 

Let’s say we are short the AAPL 170 call while AAPL is trading at 169.50. It is the day of expiration and there are only 2 minutes left in the trading day. 

At the moment, we are safe. As long as AAPL stays under 170, we will remain safe. But what if, in the last two seconds of trading, a wave of buy orders comes in, sending AAPL to $170.15? 

Our option is in-the-money, and the markets are closed. So what can we do? Not much. We will probably be assigned on our short call, and forced to sell 100 shares of stock. We could hedge this risk by buying 100 shares, but there is no guarantee that we will be assigned. This is a messy situation and can result in huge monetary losses. 

To eliminate pin risk, close out of any short at-the-money options before the bell rings. It’s that simple.

This risk can be present in long options too, but long options can inform their broker to NOT exercise their contract. This is assuming the trader is paying attention. This brings us to our next risk. 

5.) Memory Risk

memory

After working in the retail options industry for 15 years, I can tell you the greatest of all risks comes from individual traders’ negligence. 

Options trading requires diligence. There are a lot of moving parts in this business. You have to stay on top of your game at all times. The “set it and forget it” mentality does not work in options trading. 

If you tend to be forgetful, make it a habit to set reminders for important upcoming events, such as “earnings calls” and important expiration dates. If you are habitually forgetful, options trading probably isn’t for you. There are simply too many risks!


Final Word

This list is by no means exhaustive. For example, “liquidity risk”, just like in stocks, is present in options. You want to make sure there is sufficient volume in a stock before placing an options trade on that stock. Additionally, the bid-ask spread should be tight. 

Hopefully the above list will get you started on understanding the risks of options trading.

A lot of money can be both made and lost in options trading. It is always best to start small and slowly increase your positions as you become more comfortable. 

All new traders eventually make a mistake. However, it is far better for this mistake to involve a one-lot than a one-hundred lot!

Next Lesson

Index Options Trading Explained (Guide w/ Visuals)

INDEX OPTIONS ETF OPTIONS EQUITY OPTIONS

Exercise Style:

European
American
American

Settlement:

Cash-Settled
Physical Delivery
Physical Delivery

Tax Advantages:

Has Tax Advantages (60/40)
No Tax Advantages
No Tax Advantages

Dividends:

No Dividends
Dividends
Dividends

An index option is a derivative financial instrument that gives the buyer the right, but not the obligation, to either buy (call) or sell (put) an underlying index at a specific strike price on an expiration date. 

In the world of options trading, there are three dominating categories of underlying’s upon which derivatives are based:

  1. Equity Option Definition: These types of contracts use a specific stock as their underlying, such as Apple (AAPL) or Tesla (TSLA).
  2. ETF Option Definition: These types of options use exchange-traded funds (ETFs) such as SPY and QQQ as their underlying. The values of ETF options are derived from the physical stock which composes whatever basket of funds that ETF tracks.
  3. Index Option Definition: Index options track “indices” which, unlike ETFs, are not actually comprised of individual stocks, but a non-equity issuing benchmark index, like SPX or NDX.

To differentiate index options from the others on our list, let’s start by looking how these types of options are exercised.

TAKEAWAYS

  • Index options track a non-share issuing underlying index

  • These types of contracts are settled in cash, reducing the large monetary risk that comes with other types of options that are physically settled

  • Index options are “European” style. These types of options can only be exercised at expiration and therefore pose no early-assignment risk to short positions

  • Because of the “60/40” rule, index options benefit from reduced taxation

  • Indices pay no dividends, therefore dividend risk is eliminated in index options.

Index Options: European Style

All options contracts are either settled in the “American” or “European” style. 

  • American Style options allow the owners the right to exercise their call or put option any time before and including the expiration date.
  • European Style options can only be exercised on the day of their expiration. 

All index options are settled in the European style. 

This is great news for traders’ short options. Early assignment risk is virtually removed from index options. 

If you are short a call or short a put option on a stock (like AAPL) or ETF (like QQQ), your long counter-party has the right to exercise this option at any time.

Early exercisement can occur when an options extrinsic value plummets, or when dividends are issued (for calls). Additionally, short options can in theory be assigned at any time. This may not be a bad thing, but it can still be a risk nonetheless. 

With index options, this early-assignment risk is virtually removed. This is one reason professional traders prefer trading options on indices, like SPX (CBOE) and NDX (NASDAQ).

Index Options: Cash-Settled

Image from CBOE.com

All options contracts are setted either via cash or physical deliver. 

  • Physical Delivery settled options require actual delivery of the underlying product (whether it be stock or ETF)
  • Cash- Settled options simply require an exchange of cash equal to the options notional value at the time of expiration

Index options are cash-settled. 

When an option is exercised (and thus assigned) the short party must produce a lot of capital to hold that position. For equity and ETF options, 100 shares of stock are exchanged per one lot. 

For retails who don’t always watch their accounts closely, this can be huge risk. If you were short a call option on AMZN going into expiration and forgot to buy it back, you would be required to have (at its present value of $3,400) $340,000 in your account! This can result in huge monetary losses.

This is just yet another reason why index options are typically the favorite of professional traders.

Index Options: Tax Advantages (60/40)

Image from CBOE.COM

When compared to equity and ETF options, index options offer investors a pretty substantial tax break. Let’s take a look first at how equity and ETF trades are taxed, then look at the advantages that index options have over them.

Normal Taxation

For investors trading in taxable accounts, both long-term and short-term capital gains must be paid (depending on the position duration). These taxes are often contingent upon an investor’s net income.

  • Short-Term Capital Gains apply to the profits made on positions held for under one year.
  • Long-Term Capital gains apply to profits on positions held for more than one year and are taxed at rates varying from 0% to 20%.

Almost in every situation, paying long-term capital gains is preferred to short-term capital gains. Why? Short-term capital gains are taxed at your normal tax rate. Long-term capital gains are taxed at (lower) rates varying between 0% to 20%.

Index Option Taxation

Index options are taxed a little differently than this. According to section 1256 from IRS.gov, gains on index options are treated at 60% long-term capital gains and 40% short-term. 

Short-term capital gains are almost always higher than long-term capital gains. Sometimes, traders hold positions for over one year just to avoid paying short-term capital gains. 

Section 1256 tells us that no matter how long you hold an index option (be it a minute or year), the profits on these transactions will be taxed at the 60/40 rate. This is quite the monetary benefit indeed!

This is the third way in which index options are superior to equity and ETF options. 

Index Options Eliminate Tracking Error

Tracking Error

The above graph (compliments of the Financial Times) shows how the values of ETFs can deviate from that of the underlying benchmark that they represent. 

This generally isn’t a problem for more liquid ETFs (such as SPY and QQQ), but when you’re trading more exotic ETFs, the performance of the product can sometimes differ from the securities it attempts to represent. ETFs employ fund managers and price stabilizers to keep this price in line, but it doesn’t always work.

Index options track an index without having to worry about acquiring the individual stocks that comprise that index. Therefore, with index options, you know its current market price will (almost) always be 100% in line with its true value. 

Index Options Pay No Dividends

The majority of ETFs and stocks pay dividends. 

This poses a risk to those short options, particularly calls. Since options do not pay dividends, sometimes it makes sense for a party long a call option to exercise their contract. This mostly occurs on options that are deep in-the-money. 

If you are short that option, this will most likely result in a monetary loss to your account. I remember working for an advisor who neglected to trade out of an “ex-dividend” short call position. I also heard about the trader on the floor who decided to “exercise” this long call – it was a lot of risk-free money to him!

Popular Index Options List

  • SPX – S&P 500 Index
  • NDX – NASDAQ 100 Index
  • RUT – Russell 2000 Index
  • DJX – Dow Jones Industrial Average 1/100 Index
  • OEX – S&P 100 index
  • VIX – S&P 500 Volatility Index
  • XEO – S&P 100 (European) Index

Final Word

In summation, we can conclude that index options do indeed offer traders many advantages over other types of options.

  1. Index options eliminate early assignment risk.
  2. These options do not require physical delivery (a risk to neglected short option positions).
  3. Index options offer superior tax advantages.
  4. With index options, dividend risk is removed.

So it seems like index options are all upside. Are there any drawbacks?

Perhaps one of the few disadvantages of index options lays in their strike prices. 

Index options generally have strike prices listed 5 points apart. For smaller retail accounts looking to do small trades (like a one-point vertical spread) this would be an impossibility. 

ETFs on liquid products like SPY, on the other hand, offer even half-point strike prices.

Next Lesson

Recommended Video

Implied Volatility Explained (The ULTIMATE Guide)

implied volatility

Implied Volatility Definition: In the financial markets, Implied Volatility (IV) represents the expected volatility of a stock, ETF, or index over the life of an option. IV helps to determine the prices of options. 

There are few trading terms more daunting to the beginner options trader than implied volatility. 

However, when broken down into its parts and looked at visually, this concept can be mastered by anyone willing to take the time to learn.

If you want to become a serious options trader, you must understand implied volatility. It’s that simple.

Let’s get started!

TAKEAWAYS

  • Implied volatility uses options to forecast the likely future movement of a security’s price

  • IV can help predict future price movements caused by upcoming earnings, economic data and interest rates. 

  • Historical volatility measures past moves in a stock’s price over a predetermined time frame

  • 1 Standard Deviation includes 68% of outcomes; 2 Standard Deviations includes 95% of outcomes

  • IV (Implied Volatility) Rank tells traders whether implied volatility is high or low based on IV data from the past year

  • IV (Implied Volatility) Percentile is frequency-based.  This measure shows traders how often a stocks implied volatility has been below the current level of implied volatility over the past year. 

What is Implied Volatility?

Aside from being vehicles of hedging and market speculation, options (derivatives) also help traders to predict future stock movements. 

They do this by incorporating components of the Black-Scholes option pricing model formula relating to the price variation of options contracts.

To better understand how options are able to do this, let’s jump right into an example by comparing the option premiums on two different stocks with similar prices.

PEP Option: 37 Days to Expire

Stock: $102

105 Strike Call Option Price: $0.80

100 Put Price: $1.17

Implied Volatility: 16.4%

UNP Option: 37 Days to Expire

Stock: $103.60

105 Strike Call Option Price: $2.72

100 Put Price: $1.92

Implied Volatility: 30.9%

Let’s first note the different prices of these stocks. PEP is trading at $102; UNP is trading at $103.60. These prices are quite similar. However, we can see that the options on UNP are trading substantially higher than the selfsame options on UNP. Why are the options premiums on UNP so much higher? Because the implied volatility on UNP is higher!

The high premiums on UNP, therefore, suggest that the underlying stock is expected to move further (either up or down) than the stock of PEP.

Implied Volatility and Extrinsic Value

Option Premium

An option’s premium consists of extrinsic and/or intrinsic value. When we’re talking implied volatility, we are focusing only on the extrinsic value of an options price. 

Implied volatility represents the amount of extrinsic value that exists in a stock’s options relative to the time until the expiration date

Option Buying/Selling and Implied Volatility

When options buyers pay a high amount of premium for call and put options, the sellers of those options must therefore receive substantial credits.

Therefore, high volatility is implied by the option prices.

When option buyers pay relatively small amounts of premium for long call and long put options, option sellers receive small credits as well. This means that neither party is expecting the underlying asset price to move by much. 

Here, low volatility is implied by the option prices. 

So, what makes traders pay high premiums for some options? It’s not completely arbitrary – there is a method in the madness of options pricing. 

The answer to this lay in “historical volatility”. Let’s compare this term to implied volatility next.

Implied Volatility vs Historical Volatility

Historical Volatility Definition: A statistical indicator that measures the historical return distribution for a security over a predetermined period of time.

The above image compares the one-month historical volatility of the S&P 500 against the VIX index after recording the levels of observed volatility.

The VIX measures one-month option prices on the S&P 500 index. By comparing the S&P 500 historical volatility to the VIX index, we can draw a conclusion as to whether or not historical volatility has any impact on the S&P 500 options prices. 

We can draw three conclusions from the above comparison:

  1. S&P 500 option prices (as measured by the VIX Index) are closely related to the amount of historical volatility in the S&P 500.

  2. At low levels of historical volatility, the VIX Index (one-month SPX option prices) tends to be low.

  3. At higher levels of historical volatility, the VIX Index (one-month SPX option prices) tends to also be high.

To conclude, historical volatility looks at past volatility while implied volatility looks at future volatility. 

Implied Volatility and Probability

When you look at an options chain, you will see that every option expiration cycle has an implied volatility (IV) level associated with it.

So what does the implied volatility of an option actually represent? Let’s break this number down.

Implied Volatility is Annualized

Implied volatility is expressed as an annual percentage (Optiver). Even if the options on your chain expire in 30 days, the IV number is still annualized

The IV percentage in our above options chain represents the “one standard deviation” stock price movement over a one-year period.

In statistics, a one standard deviation range encompasses about 68% of the outcomes around the mean/average.

Expected Range Formula

In the stock market, this mean/average is the current price of a stock. Here is the formula to compute this:

1 – Year Expected Range = Stock Price +/- (Stock Price x Implied Volatility)

Let’s take a look at a few examples now to really understand this. 

Expected Range Example

Below you will find our trade details. 


NFLX Trade Details

Stock: $374

IV: 39%

1 SD Range (1 Year): $228.14 – $519.86

The above information tells us there is a 68% probability (1 SD) that NFLX is within +/- 39% of its current price of $374 in one year. 

Let’s take a look at one more example. 

KO Trade Details

Stock: $52

IV: 20%

1 SD Range (1 Year): $41.60 to $62.40

In this trade, there is an estimated 68% chance that KO is within +/- 20% of its current price of $52 in one year. Pretty simple, right?

Let’s next take some time to visualize SD and implied volatility.

1 Standard Deviation Explained

The above chart shows a $100 stock with 25% implied volatility. 68% of the area under the curve falls between $75 and $125, indicating that the market is implying a 68% probability that the stock price is between these two levels one year from today. 

This doesn’t mean that the stock price won’t trade beyond this price, but it does imply the odds of this happening are relatively low. 

So this chart shows a 1 standard deviation move; what about 2 and even 3 standard deviation moves – what will they look like?

2 Standard Deviation Explained

The above image shows a $100 stock at 25% implied volatility. Simply multiplying the 1SD range by 2 gives us the 2SD range, which is the implied 95% probability range.

  • 1SD Range (68%) = +/- $25
  • 2SD Range (95%) = +/- $75

So all this tells us is that our stock has a 95% chance of remaining between $50 and $150 one year in the future.

Every stock has its own level of volatility. Some stocks are high volatility; others are low. Let’s next compare these two.

Low IV vs High IV

The above chart compares two similarly priced stocks; one with a 10% IV (green) and another with a 25% IV (blue).

We can see that the 10% IV stock (which has cheaper option prices) is not expected to deviate too far from its current price of $100.

On the other hand, the 25% IV stock (which has very expensive options) is implying large stock price fluctuations in the future price (relative to the 10% IV).

Again, this information is all relayed to us via the options market. In an environment where the stock price is the same, the stock with a higher IV is expecting to move more (in either direction) and therefore has higher-priced options.

IV Rank and IV Percentile

These two implied volatility metrics help traders to determine whether a stock’s IV is currently high or low relative to the stock’s historical levels of IV. 

By only looking at a stock’s current IV,  it is not immediately clear whether that level of IV is low or high.

In order to determine whether a stock’s IV is fairly priced, traders look to IV Rank or IV Percentile

Both of these metrics measure a stock’s current IV against its historical levels of implied volatility. Let’s look at these closer next. 

Implied Volatility Rank

IV Rank is a calculation that takes a stocks current level of IV and compares this with the highest IV as well as the lowest IV that has been observed in that stock over the past year

Here is the formula for this:

IV Rank Formula

A 20% IV stock with a one-year IV range between 15% and 35% plugged into this formula would appear as below:

IV Rank Formula

Different IV ranks can tell us many things.

  • An IV rank of 0% indicates the current implied volatility is the lowest its been over the past year
  • An IV rank of 50% indicates the current implied volatility is at the midpoint of the IV range seen over the past year
  • An IV rank of 100% indicates the current implied volatility is the highest its been over the past year

Implied Volatility Percentile

Unlike IV Rank, IV percentile is frequency-based. IV percentile shows us how often a stocks implied volatility has been below the current level of implied volatility over the past year. 

For example, an IV Percentile of 85% means the stock’s IV has been below its current IV level on 85% of days over the past year. 

Here is the formula used to reach this figure:

IV Percentile Formula

We are dividing by 252 and not 365 because there are only 252 trading days in a year. 

For example, if a stock’s IV has been below the current IV on 180 of the past 252 trading days, the IV percentile would be:

This IV percentile of 71.42% means the stock’s IV has been below its current IV on 71.42% of trading days over the past year. 

IV Rank vs IV Percentile: Which is Better?

Every trader has their own preference here. However, one of the limitations of IV rank is that it does not tell you the frequency at which a stocks implied volatility was lower than the current level of implied volatility. 

Instead, IV Rank simply tells us where a stock’s current level of IV falls within the one year IV range.

A downside of IV Rank is that after a period of abnormally high IV, the IV Rank will come in at lower readings for almost all levels of IV into the future, regardless of whether or not that level of IV is still high or low. 

To prove this, lets compare S&P 500 implied volatility to IV Rank.

S&P 500 IV vs IV Rank

S&P Vol vs IV Rank

If you focus on the left side of the chart, you’ll see the S&P 500 IV was around 22.5%, which translated to an IV Rank of over 75%.

However, later on in the year, IV spiked to 40%. In the shaded region on the right of the graph, you’ll notice that the IV rose to 25% but the IV Rank was less than 50%.

When IV falls after a surge in IV, IV Rank readings will be low even when the IV of a stock is still relatively high. 

In this example, the IV of the S&P 500 is below 20% most of the year, but after the spike in IV,  the subsequent IV of 25% translated to an IV Rank of less than 50% later in the year.

Let’s look at how IV Percentile tracks the S&P 500 IV next. 

S&P 500 IV vs IV Percentile

S&P 500 IV vs IV Percentile

The above chart compares the S&P 500 implied volatility to IV Percentile.

Since IV Percentile is frequency based, this metric falls more in line with the S&P 500 implied volatility. Therefore, this measure gives us a better representation of true market volatility over periods of time.  

Final Word

This material should get you started on your journey to learning about implied volatility. If you’d like to learn more, please check out Chris Butler’s video on the subject, which builds upon the topics in this article as well as expands into the world of implied volatility and company earnings

Implied Volatility FAQs

Higher levels of IV (implied volatility) result in higher option premiums. Therefore, if you are selling options, a higher IV means a higher reward. Of course, higher reward potential comes with greater risk. 

Determining the ideal level of IV will depend on your options trading strategy. Generally, option sellers prefer a high IV when entering trades, and a lower IV over the course of the options life.  

Volatility, also known as historical volatility, represents the past volatility of a stock, ETF, or index. Implied volatility represents the future potential volatility of a security, as measured by that securities option prices. 

Next Lesson

What is The Straddle Options Strategy? Simplified w/ Visuals

Short Straddle Chart

The straddle is a vital trading strategy that all options traders must have in their toolbox. Even if you never place a straddle, the information this strategy relays to us is of utmost importance.

In this article, projectfinance will be reviewing both the long and short straddle options strategy. We will also examine how this strategy, regardless of whether or not you actually trade it, can give us a pretty good idea as to the future movement of a stock, ETF, index, or any security, for that matter.

Let’s start by looking at the long straddle.

TAKEAWAYS

  • A straddle consists of both a call and put option on the same security, strike price, and expiration date.

  • In a long straddle, both the call and put options are purchased

  • In a short straddle, both the call and put options are sold

  • Long straddles benefit from either large upside or downside movements in a stock

  • Short straddles benefit in flat, or sideways markets

  • At-the-money straddles on near-term options help traders to forecast a stock’s expected move

Long Straddle Explained

Long Straddle Definition: In options trading, a “Long Straddle” position is established when both a call and a put contract are purchased on the same strike price and expiration date for a security.

In options trading, you can both buy and sell all strategies. When your trade results in a net debit (meaning it costs you money) the cost of this trade will be debited from your account. 

Long Straddle Components

  • Long Put X
  • Long Call Y

So all we are doing here is buying both a long call and long put option simultaneously. In order for our net position to result in a straddle, our options must be:

  1. On the same security
  2. Of the same strike price
  3. Of the same expiration date

When all of these conditions are met, you will have a long straddle.

Since we are a net purchaser of options here, we expect the underlying stock to move. But in what direction? That’s the beauty of a straddle: since we are long both a call and put, if the stock moves up OR down, by a lot, we will make money.

But under what conditions will we make money? How far does the stock have to move? Where do we break even?

Let’s first take a look at at the profit/loss profile of this trade, then an example. 

Long Straddle Profile

Long Straddle Maximum Profit:

Unlimited, no cap on the call

Long Straddle Maximum Loss: 

Total debit paid

Long Straddle Break Even: 

Upside: Long call strike Y (plus) total premium paid

Downside: Long put strike X (minus) total premium received

Long Straddle Example Trade

To begin, we must first choose the strike price of the call and put that we will be buying. For straddles, this strike price is almost always close to or at-the-money.

Take a look at the below sample options chain.

Long Straddle Options Chain

We said before that most long straddles use at-the-money options. Since the stock is trading at $250 here, we have purchased both the at-the-money 250 call and 250 put for a net debit of $30.30.

Buying at-the-money options allows us to profit from equal upside and downside stock moves. If you purchased that straddle at the $275 strike price, you would be much more bullish and the profile/loss profile would be skewed. 

Let’s take a look at a visual of this at-the-money straddle, then break down its profit/loss profile.


Long Straddle Chart

Long Straddle Maximum Profit

In theory, the maximum profit is unlimited on straddles. This is because of the long call.  Since there is no cap on how high a stock can go, the value of a call can theoretically go to infinity. 

Long Straddle Maximum Loss

Whenever you purchase options, the most you can ever lose is the premium paid. Since we paid $30.30 for this straddle, our maximum loss would be $3,030 (taking into account the options multiplier effect of 100).

When would this happen? If the stock closes at $250 exactly on the expiration day. Under this scenario, both our long call and long put would be (just about) worthless.

Long Straddle Break Even

Since we are long two options, we have two breakevens.

  1. Call Break Even: 250 + 30.30 = $280.30
  2. Put Break Even: 250 30.30 + $219.70

In order to determine the break even here, we must start by looking at our total debit paid. On expiration day, one of these options must have enough value to gain us $30.30, our net debit paid. 

That’s a pretty big move! And if that happens, we will only break even. In order to make money, the stock price needs to move more than $30.30 in either direction.

Therefore, you should only purchase a straddle when you believe the underlying price will move by a substantial amount. If you were confident in the future direction of a stock’s movement,  you wouldn’t buy a straddle, but simply a call or put. 

Let’s now take a look at the short straddle, which is simply the exact opposite of what we just learned. 

Short Straddle Explained

Short  Straddle Definition: In options trading, a “Short Straddle” position is established when both a call and a put contract are sold on the same strike price and expiration date for a security.

Since we are net sellers of options here, we will be receiving a credit for this trade. Therefore, this trade will result in a credit of cash to our account.

We learned before that the long straddle profits when the stock moves a lot. Short straddles are the exact opposite; these strategies profit when the underlying stock moves very little

Therefore, this strategy is best for more market-neutral traders. 

Short Straddle Components

Just as with the long straddle, the short straddles must be composed of options that are:

  1. On the same security
  2. Of the same strike price
  3. Of the same expiration date

Let’s take a look at this strategy’s profit/loss profile, then move on to an example. 

Short Straddle Profile

Short Straddle Maximum Profit:

Total credit received

Short Straddle Maximum Loss: 

Unlimited, there is no cap on how high the short call can go

Short Straddle Break Even: 

Downside: Short put strike X (minus) total premium received

Upside: Short call strike Y (plus) total premium received

Short Straddle Example Trade

Just as with the long version of this trade, we are going to placing the short version with at-the-money options (the 250 strike price from the below options chain).

Straddle Options Chain

So we have sold both an at-the-money call and put option here. Under what circumstances would a trader place this trade? When they believe the underlying is not going to move

Generally, straddles are sold when a trader believes the options premium (due to implied volatility) is too high. The volatility of options (particularly short-term options) is usually elevated before major market events, such as earnings reports and unemployment numbers.

Next, let’s take a look at a visual of this trade, as well as the circumstances under which we will make money, lose money, and break even.


Short Straddle Chart

Short Straddle Maximum Profit

Whenever you are a net seller of options, your maximum profit is always the credit that you take in. 

For this trade, we took in a credit of $30.30. Therefore, when accounting for the multiplier effect, our maximum profit is $3,030.

Short Straddle Maximum Loss

When we went over the long straddle, we said that (because of the call) maximum profit was unlimited. Guess what the maximum loss is for the short straddle? Bingo. Unlimited. That short call can, in theory, go to infinity.

It is because of this great risk that brokers usually require a substantial margin to hold these trades.

Short Straddle Break Even

Again, since we have two options, we have to break evens: 

  1. Call Break Even: 250 + 30.30 = $280.30
  2. Put Break Even: 250 30.30 + $219.70

Our net credit for this trade was $30.30. Therefore, either of our short options must be trading at this value on expiration for us to break even. This occurs in either of the above two listed scenarios. 

Short Straddle: The Expected Move

The straddle (whether actually traded or not) is an invaluable asset to traders. Why? It can do a pretty darn good job of predicting future stock price movements. 

Let’s take a look at a TSLA options chain on the tastyworks trading platform. 

TSLA Options Expiring in One Day: Stock at $2,965

TSLA options chain

The above options expire in one day. Let’s assume that Tesla will release earnings tomorrow morning. The stock is currently trading at $2,965.

By adding together the combined premiums of both the at-the-money 2965 calls and 2965 puts, we can get a ball park range of how much TSLA will move post earnings. 

In this instance, the stock is expected to move by about $30 ($15 + $15).

Using straddles to predict future price movement is a great window into the (potential) future of a stock. If you’d like to learn more about the expected move, check out this article by MarketWatch, which tells of calming volatility in GameStop.

Note: Curious how the straddle compares to the strangle? Check out our article here! Straddles vs Strangles.

Straddles and The Greeks

Let’s conclude our article by studying how the straddle interacts with the option Greeks.  

Long Straddle Greeks

Next Lesson

Gamma Squeeze and Meme Stocks Explained

Gamma Squeeze Image

If you spent any time during 2021 reading about stocks like AMC Entertainment Holdings Inc (AMC) and GameStop Corp. (GME), chances are you came across the phrase “gamma squeeze”. Will the trend continue into 2022?

In a nutshell, here’s what this means.

TAKEAWAYS

  • A gamma squeeze causes dramatic swings in the price of a stock, almost always on the upside

  • A gamma squeeze is caused by traders purchasing large volumes of near-term call options

  • Market makers that sell these options most hedge their short-call positions with long stock in a process called “gamma hedging”

  • Gamma is one of the options Greeks and is the second derivative of “delta”, which is the first Greek

  • A “short squeeze” is the product of many traders buying back a short stock that moves against them; a “gamma squeeze” occurs only on stocks that offer options, and is caused by call option buying

Gamma Squeeze and Call Options

During the meme stock craze of 2021, retail traders were buying hoards of near-term “call options” on stocks like AMC, GME, and BBBY.

Call options are derivatives that allow traders to place leveraged upside bets on an underlying stock. Puts, conversely, allow traders to bet the same way, but these contracts profit when the security falls in value. In this article, however, we will be focusing on calls, as they are the culprits behind gamma squeezes. Let’s do a quick rundown of call options before we continue.

  • A call option gives the owner the right to purchase 100 shares of an underlying stock at a specific price by a specific date
  • Call options are bullish, meaning a purchaser expects the underlying to go up a lot in value. If the stock stays the same or goes down, long calls lose money
  • The expiration date for options varies widely; from days to years away (LEAPS).
  • A gamma squeeze results from massive near-term call option buying 

So retail traders buying these short-term call options were the catalyst to numerous gamma squeezes. But in order to understand what this means, we have to look at the parties that were selling these call options to the retail traders: market makers.

Market Maker Explained

Market Maker Definition: A liquidity provider who facilitates both buy and sell orders on a particular security.

Whenever you send an order to get filled, chances are this order is routed to a market maker. If you buy 100 shares of TSLA, this market participant will sell you 100 shares of TSLA, leaving them short 100 shares of the stock. 

The same is true of options.

If you were to buy 10 call contracts on GME, a market maker would sell you those contracts. You would be long 10 options; the market maker would be short 10 options. 

Market makers make money by buying at the bid and selling at the offer. You can compare this profession to that of a car dealer – a car dealer buys cars at an auction, then sells the cars to you, pocketing the “spread”. Depending on the size of the trades and widths of the market, market makers can make a pretty good living.

Market Makers and Hedging

So let’s imagine you are a market maker who just sold a customer 10 call options on GME. That leaves you net short a pretty large position in a pretty volatile stock. Wouldn’t you prefer to hedge (or offset) that short option position as fast as you can? Remember, you’re after the “spread”, not market speculation.

In order to hedge their short-call options, market makers purchase stock. The goal of non-speculating market makers is to maintain a delta-neutral position. This means that they have offset all of their risks. Maintaining this neutrality is a constant battle.  

A long stock position offsets a short call position. When a lot of calls are purchased, a lot of stock must also be purchased in return by market makers. This causes the stock price to skyrocket, resulting in a “gamma squeeze”.

We mentioned “delta-neutral” before. Delta is one of the option Greeks. Gamma, too, is one of the option Greeks. In order to understand gamma, however, we must first understand delta. 

Let’s get started!

Option Delta Explained

Δ Option Delta Definition: In options trading, the Greek “delta” represents the amount an option price is forecasted to move in relation to a $1 change in the underlying stock price. 

In options trading, the Greek “delta” allows a trader to predict how a particular option will react to a future change in the price of a security. In other words, delta offers traders a window into the future. 

Like everything in options trading, the Greeks are standardized. An options delta is the amount the price of an option is expected to move in relation to a $1 change in the underlying stock.

  • Call options have a delta value between 0 and +1. 
  • Put options have a delta value between 0 and -1.

Let’s take a look at a simple options chain now to see delta in action.

AAPL Option Delta Example

Type Strike Price Delta +$1 Share Price Affect -$1 Share Price Affect

Call

147

3.25

.64

3.89

2.61

Call

148

2.63

.52

3.15

2.11

Call

149

2.11

.42

2.60

1.62

Where AAPL is trading at $148.20

The above table illustrated how the prices of various AAPL call options react to a +/- $1 move in the underlying stock. 

Let’s look at the 148 call, initially valued at $2.63. If the stock price were to pop by $1 immediately, the price of this call would rise to $3.15. How did we get this number? By simply adding the delta to the previous price. Voila! That’s delta (in a nutshell).

In addition to telling us the expected move of an options price to a $1 change in the price of an underlying stock, delta also has a few more useful functions. An options delta also tells us:

  1. The odds that an option has of expiring in the money. A delta of 0.40 has a forty percent chance of expiring in-the-money.
  2. How many shares of stock an option “trades like”. An option with a delta of +0.60 will trade similar to 60 long shares of the underlying stock.

So now we have delta down. Let’s move on next to gamma, which is actually a derivative of delta! It’s not that confusing – I promise!

Option Gamma Explained

(Γ) Option Gamma Definition: The Greek “gamma” measures the rate at which an options delta changes in response to the price movement of the underlying stock.

In order to truly understand gamma, you must first understand delta, so make sure you mastered this Greek before we move on.

Gamma tells us how the future delta of an option will change in response to a one-point move in the underlying stock.

Before we dive into gamma, let’s look at a few of this Greek’s key characteristics: 

  1. Long Options Produce Positive Gamma; Short Options Produce Negative Gamma
  2. Gamma is Highest for At-The-Money Options

Take a moment to study the below table. 

AAPL Option Gamma Example

Type Strike Price Delta Gamma New Delta (+$1 Share Price ) New Delta (-$1 Share Price)

Call

147

3.25

.64

.06

.70

.58

Call

148

2.63

.52

.08

.60

.44

Call

149

2.11

.42

.06

.48

.36

Where AAPL is trading at $148.20

Before, we learned that delta shows us how an option reacts to a one-point change in the price of an underlying. 

Gamma goes a step further here and tells us what the future delta will be when the stock moves by one point. Gamma is known as the first derivative of delta for this reason. 

By looking at the 148 call, we can see that this options delta will increase by 0.08 if the stock were to go $1 higher, and decrease by 0.08 if the stock were to go $1 lower.

Long Gamma vs Short Gamma

When a market participant buys options, they are said to be “long” gamma.

A long gamma position implies that the delta of an option(s) will increase when the stock price rises, and decrease when the stock falls.

When a market participant sells options, they are said to be “short” gamma. 

A short gamma position implies that the delta of an option(s) will fall when the stock rises, and rise when the stock prices falls.

To read more about this, check out our article, “Long Gamma vs Short Gamma”.

Gamma Hedging Explained

As we said before, the Greeks are used by market makers to reduce or eliminate risk.

When traders use delta to hedge, this is called “delta hedging“. When traders use gamma to hedge, this is called “gamma hedging,”

Since delta only looks at how an options price will change in value for the next dollar move in the underlying, it has its limitations. What about the dollar after that? And so on.

Gamma hedging allows traders to offset risk for potential future large moves in the underlying and is the preferred method of hedging amongst professionals. This is why it is called a “gamma squeeze” and not a “delta squeeze”.

That isn’t to say that delta hedging isn’t used; gamma hedging is simply a more important tool. They are typically used in tandem.

GME Gamma Squeeze

GME Short Squeeze

Chart from Google Finance

Take a look at the above one-year chart on GameStop (GME).

During these incredible rallies, retail traders were buying as many call options as they could. Market makers were fulfilling their duty to provide liquidity by filling these orders as they came in. 

This left the market makers with short-call options. As we learned, a short options position leaves a trader with “short gamma”.

Being naked short gamma in GME is a huge risk. In order to offset this risk, market makers purchased stock. 

But how much stock do they need to purchase? This number was communicated to them via the Greek gamma. They were short a ton on gamma, so, therefore, had to purchase a ton of stock, thus wildly driving up the price of GME.

A gamma squeeze is a relatively rare market phenomenon, occurring mostly when short-term call buying precipitates in an uncontrollable fashion, as it did for several meme stocks. 

If you’re on the right side of the market, a gamma squeeze can make you a lot of money. If you’re on the wrong side – watch out! 

Sometimes, the term “gamma squeeze” gets confused with “short squeeze”. Let’s end this article by looking at the fundamental difference between these two market events.

Gamma Squeeze vs Short Squeeze

Short Squeeze Definition: A short squeeze occurs when there is more demand than supply for a security due to short positions being repurchased.

You can both buy and sell short shares of stock. When you sell a stock, you profit when the stock goes down in value. Companies with dim prospects are shorted frequently. There is no cap on how high a stock can go, therefore, short sellers of stock have infinite risk.

Take a look at the below chart of AMC stock.

AMC Short Squeeze

AMC Short Squeeze

Chart from Google Finance

Imagine selling AMC for $20/share only to have it rally to $50/share a couple of days later. Your maximum gain was only $20 in this scenario. You would have lost more than twice what you could have made under the best-case scenario if the stock went to zero.

When you sell a stock, you do so on margin, which is essentially borrowed funds from your brokers.

If your position moves against you and you don’t have the funds to hold the position, you will enter a “margin call”.  Your broker will either require you to deposit funds in your account, or they’ll take the liberty of liquidating your account for you. How do they do this? By buying the stock you are short. 

When a short squeeze happens, it tends to happen all at once, creating a domino effect. This mass buying sends the stock higher.  Check out this article on gamma squeeze by RagingBull to learn more. 

Short selling is rooted in equity trading and traders are the cause; gamma squeeze is rooted in options hedging and market makers are the cause.

There are two ways to determine whether or not a stock is experiencing a gamma squeeze or short squeeze:

  1. Only stocks that have options can experience gamma squeeze; if there are no options, there is no gamma squeeze.
  2. A gamma squeeze can be confirmed by determining whether or not large call buying takes place simultaneously as the stock price rallies. The historical volume of options can be charted on most trading platforms.

As stated by the Wall Street Journal, GME’s meteoric rise wasn’t caused by a short squeeze, but by market makers hedging their short calls. 

Can a short squeeze and a gamma squeeze happen simultaneously? Absolutely! It can be difficult to tell sometimes why, exactly, certain securities rise sky-high over a short period of time. However, these two rare market events are often to blame.

Next Lesson

VGT vs QQQ vs XLK: Performance and Holdings

Information Technology ETF Comparison

VGT QQQ XLK
Issuer:
Vanguard
Invesco
State Street Global Advisors

Index:

MSCI US Investable Market IT 25/50 Index
Nasdaq-100 Index
S&P Technology Select Sector Index
Category:
Small Cap, Mid Cap,& Large Cap
Large Cap
Large Cap
Dividend Yield:
0.63%
0.45%
0.65%
Expense Ratio (fees):
0.10%
0.20%.
0.12%
Number of Stocks:
340
104
77
5 Year Return:
30.87%
29.85%
28.47%
Top Holding (And Weight)
AAPL (19.35%)
AAPL (11.70%)
AAPL (22.79%)

Over the past twenty years, technology stocks have vastly outperformed the broader market. As technology tends to advance exponentially, this trend will probably only continue (if not advance) over the next twenty years.

There are three juggernaut funds that rule the ETF space within the information technology sector. Which one is best for you? Let’s get started with the comparisons right away!

TAKEAWAYS

  • VGT, QQQ & XLK represent the most popular ETFs in the tech space
  • Vanguard’s VGT has the lowest fees at 0.10%; QQQ has the highest fees at 0.20%
  • All ETFs have significant exposure to AAPL, with XLKs weightage coming in at 22.79% for this equity
  • VGT is the most diverse ETF as this fund includes small, mid & large cap stocks
  • Over the long-term (five years), VGT has performed the best; over the short-term (one year) XLK has performed the best 

VGT vs QQQ vs XLK: Comparing Benchmarks

Let’s start with the most important comparison; differentiating what these three ETFs actually attempt (quite successfully) to track.

VGT: MSCI US Investable Market Information Technology 25/50 Index

So that’s a rather confusing name for an index! What exactly does this index track? Let’s head over to the MSCI website to see what the founders of this index have to say. 

So this exchange-traded fund (ETF) includes stocks in all three of the capitalization categories (small, mid, and large). When compared to the other ETFs on our list (which only include large cap companies), VGT is the best diversified because of this.

QQQ: Nasdaq-100 Index

Invesco’s QQQ ETF is by far the most popular fund on our list. However, because of its relatively high fee nature, VGT and XLK are fast catching up! (if you’d like to check out some top tech Nasdaq 100 ETFs, read our article: Differences Between Invesco’s QQQ, QQQM, and QQQJ!)

So what index does the QQQ’s track? The Nasdaq 100. The below excerpt is taken from nasdaq.com, the founders of this index:

The Nasdaq-100 is a modified capitalization-weighted index. This means that the largest companies (AMZN, GOOGL, AAPL, etc.) have a larger weight than smaller companies. “Modifications” were put into place to assure a few companies did not dominate the index. The below lists two re-balancing contingencies put into place to assure this:

  1. A single company is worth > 24% of the entire index
  2. 48% of the companies have a weighting of at least 4.5%

XLK: S&P Technology Select Sector Index

Unlike the QQQ’s, State Street’s XLK ETF takes its stocks from the S&P 500. This popular index can be broken down into seven unique sub-sectors. One of these sectors is technology, which is formally called The S&P Technology Select Sector Index, which the XLK ETF tracks.

So how many stocks in the S&P 500 fall under the information technology sector? 77. 

The S&P Technology Select Sector Index is a weighted index. When compared to other tech indices, this index places a disproportionately large emphasis on larger corporations (which we will get into soon). If you love mega-cap tech companies, this index/ETF is for you.

VGT vs QQQ vs XLK: Comparing Fees

The average ETF fee is about 0.40%. When taking that into account, every ETF on our list charges a very low fee, or “Expense-Ratio”.

We can see that Invesco’s QQQ charges a fee that is 100% higher than Vanguard’s VGT. Should this relatively marginal difference in fee structure steer you away from the QQQs?

Maybe, but let’s first take a look at the historical performance of these ETFs. If the QQQs return an extra 1% per year, I’ll gladly pay that tiny difference in fees.

VGT vs QQQ vs XLK: Comparing Performance

The below table shows how our various ETFs have performed over different spans of time. 

Rank VGT QQQ XLK
1-year
34.71%
34.39%
37.14%
3-year
37.33%
34.48%
37.89%
5-year
30.87%
28.47%
29.85%

The winner here, of course, will depend upon the time frame we are looking at. VGT appears to be the long-term winner (5 years), while State Street’s XLK has performed the best short-term (1 year).

VGT vs QQQ vs XLK: Comparing Sectors

Though all of our ETFs are tech rooted, some of the sub-sectors within their compositions deviate a little outside of tech. The below images (taken from etf.com) show the top 5 sectors that every ETF on our list invests in (click to enlarge).

VGT Sectors

QQQ Sectors

XLK Sectors

VGT vs QQQ vs XLK: Top Stock Holdings

Next up, let’s examine what stocks these ETFs actually invest in. Of particular interest here is the weight that these different ETFs place on particular stocks.

Rank VGT QQQ XLK
1.
Apple Inc. (19.35%)
Apple Inc. (11.70%)
Apple Inc. (22.79%)

2.

Microsoft Corp. (18.36%)
Microsoft Corp. (10.64%)
Microsoft Corp. (21.81%)
3.
NVIDIA (4.93%)
Microsoft (10.64%)
NVIDIA (7.15%)
4.
Visa (2.60%)
Tesla (6.08%).
Visa (2.87%)
5.
Adobe (2.14%)
NVIDIA (5.32%)
Adobe (2.80%)

We can see that Apple (AAPL) dominates these portfolios. However, the XLK ETF has almost twice as much exposure to AAPL as the QQQs. If you’re not very bullish on AAPL, XLK probably isn’t for you.

Final Word

So what’s the best ETF for you? From the various historical performances listed above, there does not appear to be a clear winner. All three ETFs have outperformed the S&P 500. 

Additionally, it is worth noting that tech stocks tend to have more risk than a benchmark like the S&P 500. 

The best hedge against risk is usually diversification. Out of the three ETFs on our list, Vanguard’s VGT ETF is the most diverse. This fund has over 300 stocks within it (QQQ has 104; XLK has 77). VGT also spans numerous market caps (small, medium, and large) while QQQ and XLK stay in the large-cap category. 

But you aren’t limited to one tech fund. With most brokerage houses charging no money for commissions, why not invest in all three?

Worth noting here is the low dividends on almost all of our ETFs. Many tech companies fall into the growth category. Growth stocks tend to invest any extra income back into the company rather than pass it on to shareholders in the form of dividends.

Next Lesson