Last updated on May 22nd, 2025 , 11:53 am
7 guides to help you master topics related to implied volatility (option prices).
Implied volatility represents a stock’s option prices, and is one of the most important options trading concepts to master.
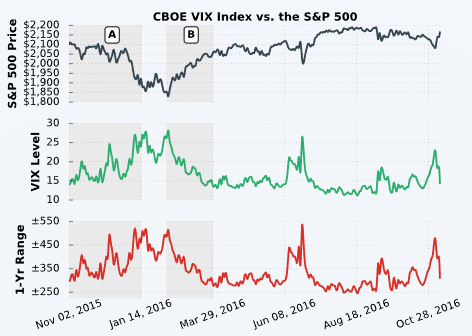
The VIX Index is a commonly watched indicator, as it measures option prices on the S&P 500 Index.
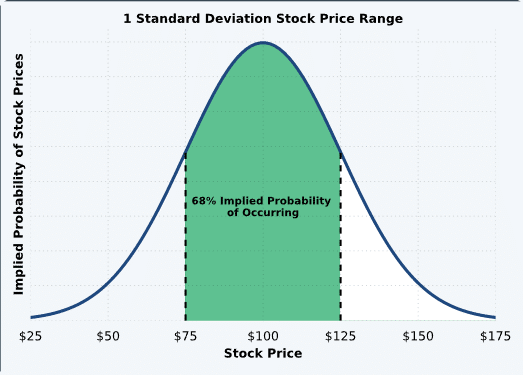
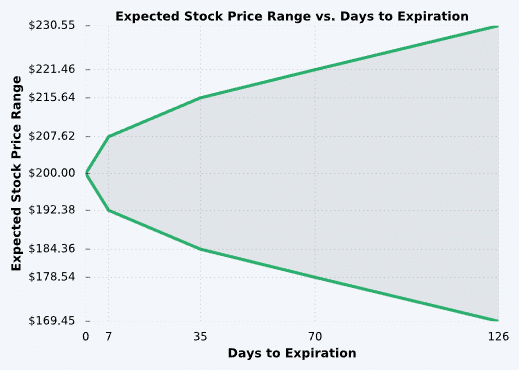
The “expected move” represents a probabilistic forecast for a stock’s price in the future.
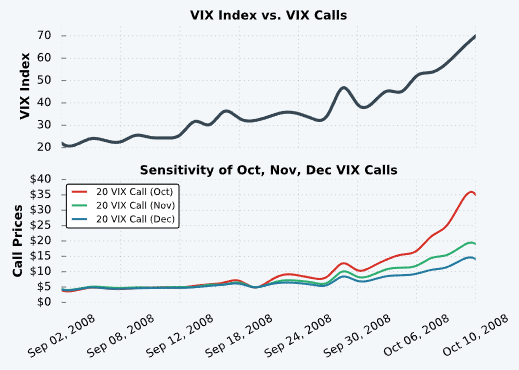
Want to trade VIX options? Be sure to understand common misconceptions.
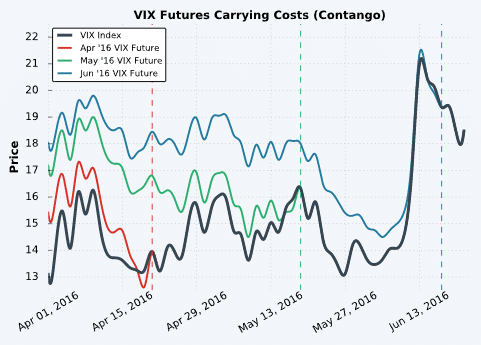
VIX futures can be used to trade expectations related to changes in the VIX Index.
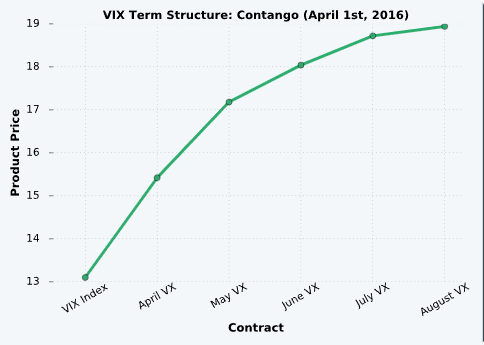
The VIX term structure represents the relationship between near-term and long-term VIX futures contracts.
How do you know if a stock’s current implied volatility is high or low relative to its historical levels? IV rank and percentile can help.
Mastered implied volatility? Move on to the Greeks next!
Historical and Implied Volatility – The Options Industry Council
➥ Bullish Strategies
➥ Bearish Strategies
➥ Neutral Strategies
➥ Vertical Spreads Guide
☆ Options Trading for Beginners ☆
➥ Basics of Calls and Puts
➥ What is a Strike Price?
➥ Option Expiration
➥ Intrinsic and Extrinsic Value
➥ Exercise and Assignment
➥ The Bid-Ask Spread
➥ Volume and Open Interest
➥ Option Chain Explained
➥ Option Greeks 101
➥ Delta Explained
➥ Gamma Explained
➥ Theta Explained
➥ Vega Explained
➥ Implied Volatility Basics
➥ What is the VIX Index?
➥ The Expected Move
➥ Trading VIX Options
➥ Trading VIX Futures
➥ The VIX Term Structure
➥ IV Rank vs. IV Percentile
➥ Option Order Types 101
➥ Stop-Loss Orders On Options Explained
➥ Stop Limit Order in Options: Examples W/ Visuals
➥ Limit Order in Option Trading Explained w/ Visuals
➥ Market Order in Options: Don’t Throw Away Money!
➥ TIF Orders Types Explained: DAY, GTC, GTD, EXT, GTC-EXT, MOC, LOC
New to options trading? Learn the essential concepts of options trading with our FREE 160+ page Options Trading for Beginners PDF.
About the Author
Chris Butler received his Bachelor’s degree in Finance from DePaul University and has nine years of experience in the financial markets.
Chris started the projectfinance YouTube channel in 2016, which has accumulated over 25 million views from investors globally.
Our Authors
Your email address will not be published. Required fields are marked *
Comment *
Name *
Email *
Website
Save my name, email, and website in this browser for the next time I comment.
Δ

(1)")
