
To make sure you understand the stop-loss calculations, here are some examples:
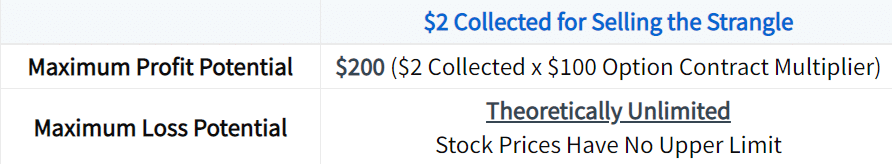
Initial Strangle Sale Price: $2.00
-50% Loss: Strangle price increases by 50% to $3.00.
-100% Loss: Strangle price increases by 100% to $4.00.
-200% Loss: Strangle price increases by 200% to $6.00.
The stop-loss is just the percentage increase over the initial sale price that is used as a trigger to close the trade.
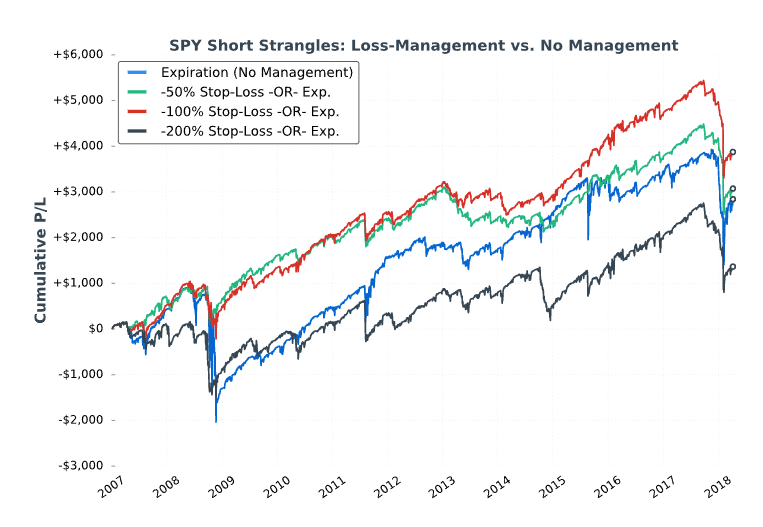
SPY Short Strangles: Taking Losses
Here are the results of the first study:
*Please Note: Hypothetical computer simulated performance results are believed to be accurately presented. However, they are not guaranteed as to the accuracy or completeness and are subject to change without any notice. Hypothetical or simulated performance results have certain inherent limitations. Unlike an actual performance record, simulated results do not represent actual trading. Also, since the trades have not actually been executed, the results may have been under or over compensated for the impact, if any, or certain market factors such as liquidity, slippage and commissions. Simulated trading programs, in general, are also subject to the fact that they are designed with the benefit of hindsight. No representation is being made that any portfolio will, or is likely to achieve profits or losses similar to those shown. All investments and trades carry risk.
Compared to holding to expiration, taking 50-100% losses on the short strangles helped avoid some massive losses, but all strategies still suffered substantial drawdowns in certain periods (especially the February 2018 crash).
The largest stop-loss of 200% was the worst-performing approach, which I suspect is due to the fact that the market has been on a bull run over the test period, which means any sharp declines that caused a 200% loss on the short strangles recovered very quickly. In other words, a lot of trades were stopped out at a 200% loss that later ended with profits or less-severe losses.
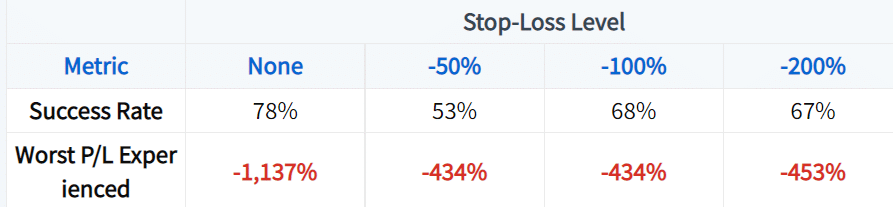
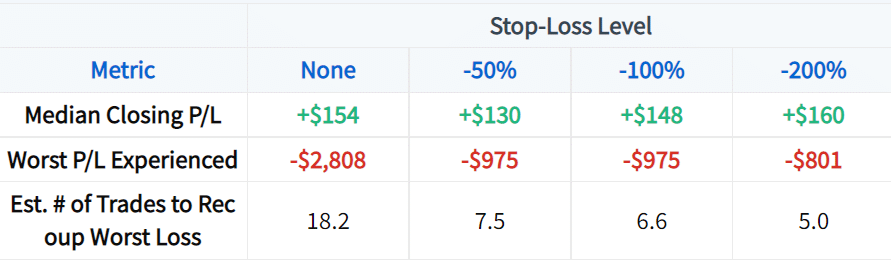
Here are some performance metrics related to each management approach:
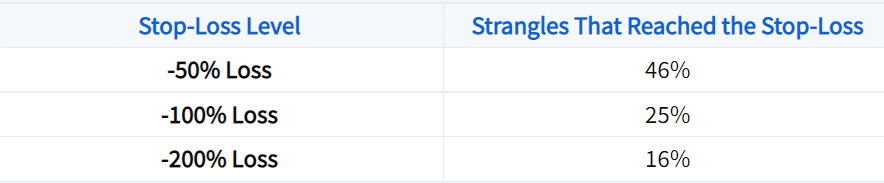
Almost half of the strangles reached the 50% stop-loss level, which is incredibly high and likely a frequency that most traders would not prefer.
25% of the strangles reached the 100% stop-loss level and 16% of the trades reached the 200% stop-loss level. The data indicates that nearly 66% of the trades that reached a 100% loss also hit the 200% loss level.
Consequently, it may be logical to use the tighter 100% stop-loss as any strangle that reaches that loss level is likely to experience more severe losses.
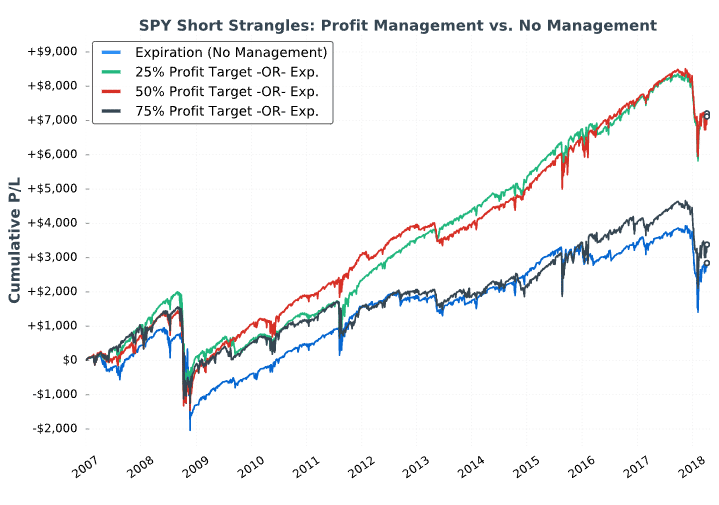
SPY Short Strangles: Taking Profits
Now that we’ve explored the usage of stop-losses when selling strangles on the S&P 500, let’s look at the historical performance implications of closing profitable trades early.
We’ll use the same methodology as before:
Sell a 16-delta strangle on SPY in the expiration closest to 60 days away.
Management: None, 25% Profit Target, 50% Profit Target, 75% Profit Target.
Next Entry Date: First trading day after previous trades were closed.
For instance, if a strangle was sold for $3.00, a 25% profit would be reached when the strangle’s price decreased to $2.25 (a 25% decrease from the entry price). A 50% profit would be reached when the strangle’s price decreased to $1.50 (a 50% decrease from the entry price).
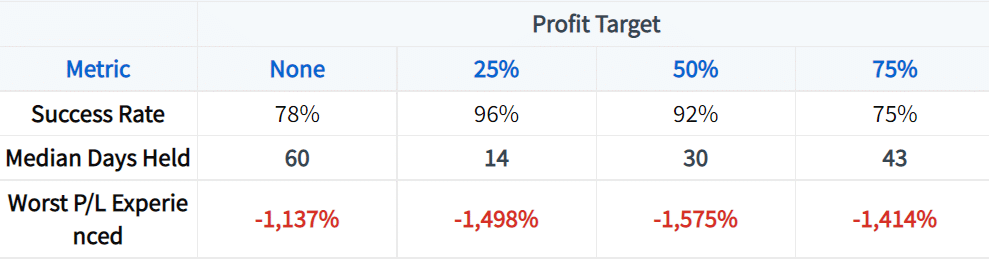
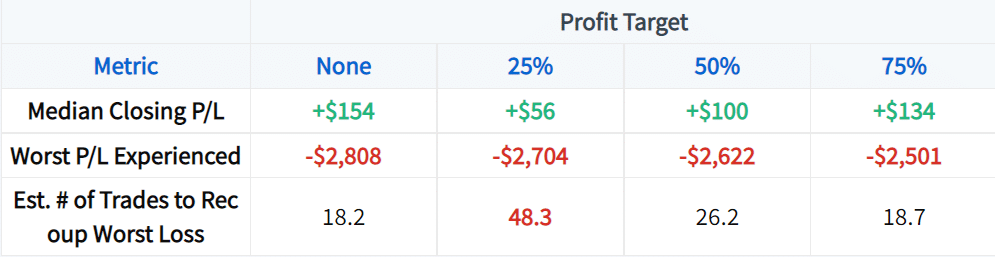
Here were the results:
*Please Note: Hypothetical computer simulated performance results are believed to be accurately presented. However, they are not guaranteed as to the accuracy or completeness and are subject to change without any notice. Hypothetical or simulated performance results have certain inherent limitations. Unlike an actual performance record, simulated results do not represent actual trading. Also, since the trades have not actually been executed, the results may have been under or over compensated for the impact, if any, or certain market factors such as liquidity, slippage and commissions. Simulated trading programs, in general, are also subject to the fact that they are designed with the benefit of hindsight. No representation is being made that any portfolio will, or is likely to achieve profits or losses similar to those shown. All investments and trades carry risk.
Taking profits at 25-50% of the maximum profit potential significantly increased the consistency of returns relative to not managing trades at all.
Hopefully, you’ve learned a great deal about how simple profit-taking and loss-taking approaches can potentially improve performance when implementing market-neutral options strategies such as the short strangle.
Now, we’ll examine the historical performance of combining profit targets and stop-losses.
Study Methodology
Product: S&P 500 ETF (ticker: SPY)
Expiration: Standard monthly cycle closest to 60 days to expiration.
Trade Setup: Sell the 16-delta call and 16-delta put. One strangle sold for all trades.
Management:
✓ 25% Profit OR 50% Loss
✓ 50% Profit OR 50% Loss
✓ 25% Profit OR 100% Loss
✓ 50% Profit OR 100% Loss
For example, if a strangle was sold for $4.00 and a trader used the 25% Profit OR 50% Loss management, they’d close the strangle if the price reached $3.00 (a 25% profit) or $6.00 (a 50% loss).
Here were the results of the four short strangle management strategies:
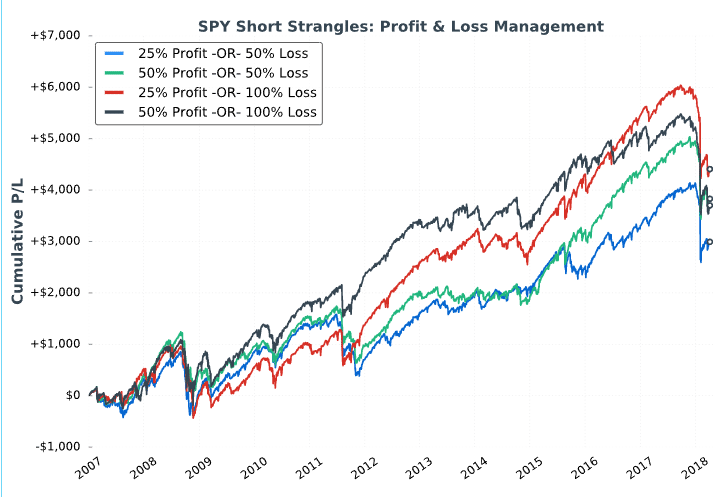
As we can see, all four of the management strategies performed well over the test period, though all strategies suffered major losses in February of 2018.
The strategies with the wider 100% stop-loss performed more consistently over the entire test period relative to the tighter stop-loss approaches.
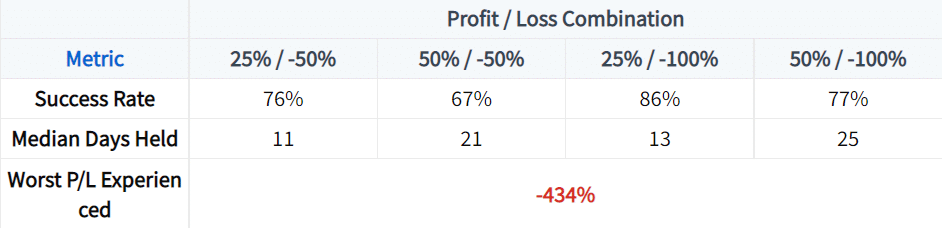
As expected, the strategy with the highest success rate was the one with the smallest profit target and largest stop-loss (25% profit or 100% stop-loss).
All strategies suffered the same maximum loss of 434% relative to the premium received, which is due to the fact that all approaches closed profitable trades on the same date and entered the same position on the following trading day. The largest loss occurred during the February 2018 market crash.
How did the 100% stop-loss approaches compare to not managing trades at all?
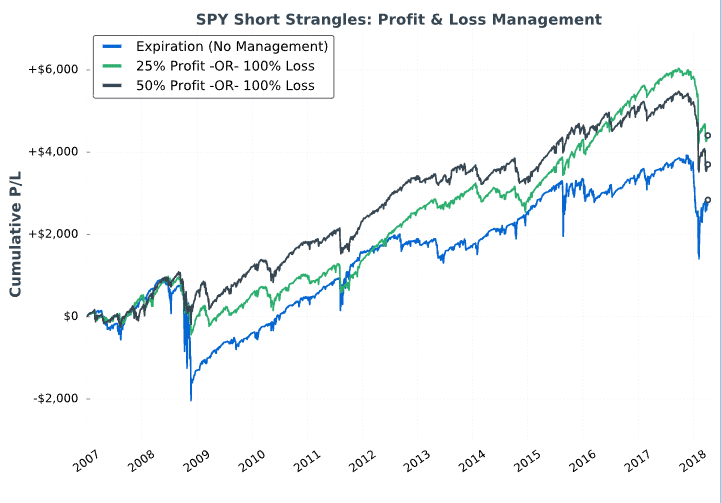
Using profit and loss management rules significantly improved the consistency of selling strangles on the S&P 500 over time. More importantly, the drawdowns were typically much less severe, with the exception of the February 2018 market crash.
During lower implied volatility environments (such as 2013 to early 2018), taking off profitable trades sooner led to much more consistent results compared to holding trades longer. It makes sense, as the market is typically grinding higher during low implied volatility environments (which is why implied volatility is low). When selling strangles in low IV environments, the short call’s strike price is typically very close to the stock price, which makes it much easier for the position to realize losses as a result of market appreciation (which is usually occurring when the VIX is low).
Here’s the same chart from above but with the VIX Index plotted against the strategies:
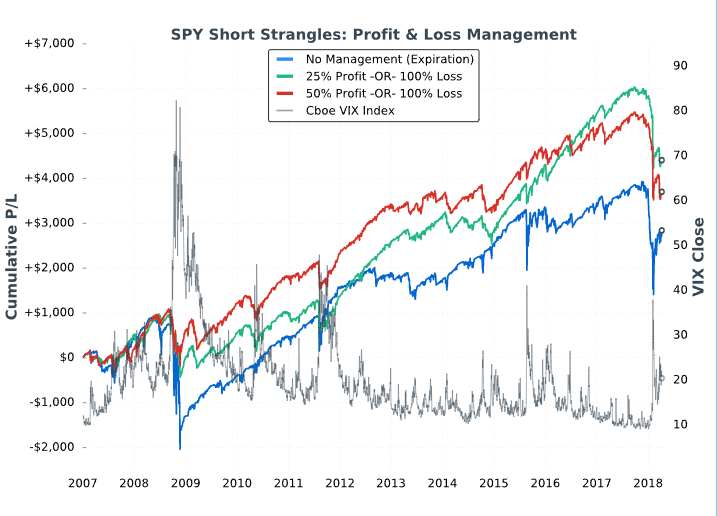
It’s important to note that while all of the above approaches show profits after the entire test period, all approaches suffered substantial losses at times, especially during February of 2018.
Over a long enough period of time, there will be market crashes worse than what was experienced in 2008, 2015 and 2018.
With that said, short strangles carry substantial risk and should be implemented with extreme caution (if at all). Undefined-risk strategies like short straddles and strangles are far riskier than what most traders are comfortable with, especially when increasing trade size.
Always think about risk before making any trades, and keep in mind that losses can become severe very quickly when selling naked options.
In any case, using profit and loss management rules when selling strangles can substantially improve consistency and lead to smoother growth curves over time