How the Covered Strangle Option Strategy Works (Guide W/ Visuals)

covered strangle

The covered strangle strategy is a bullish strategy that consists of simultaneously buying 100 shares of stock while also selling a strangle. The strangle is “covered” because the long shares “cover” the risk of the short call. A normal short strangle position has unlimited upside risk, but when 100 shares are purchased, the upside risk of the strangle is eliminated.

A covered strangle position can be conceptualized in two ways:

1) Simultaneously selling a strangle and buying 100 shares of stock

2) Simultaneously buying a covered call (+100 shares, -1 call option) and selling a put

Since the covered strangle combines a covered call and a short put into one position, it is a strategy that can be used when an investor wants to sell their shares at a higher price, but would also be willing to buy more shares if the stock price falls.

Jump To

TAKEAWAYS

  • A covered strangle is created by 1. owning 100 shares of stock 2. selling 1 out-of-the-money call 3. selling 1 out-of-the-money put.

  • Both options sold must be of the same expiration cycle.

  • Max profit potential for this trade is limited to the total credit received plus upper strike price minus stock price.

  • Max loss is great for the covered strangle, as a declining market will hit both the long stock and the short put.

Covered Strangle Trade Characteristics

Let’s go over the strategy’s general characteristics:

Max Profit Potential:

[(Call Strike Price – Stock Purchase Price) + Premium Received for Strangle] x 100

Max Loss Potential: 

[(Short Put Strike Price – Strangle Credit) + Share Purchase Price] x 100

Breakeven Price at Expiration:

Stock Purchase Price – Premium Received for Strangle

To demonstrate these characteristics in action, let’s take a look at a basic example.

Covered Strangle Profit/Loss Potential at Expiration

In the following example, we’ll construct a covered strangle from the following option chain:

In this case, we’ll sell the 210 call and 190 put for a total credit of $8.09. Let’s also assume the stock price is trading for $200 when we put this trade on:

Initial Stock Purchase Price: $200

Strangle Strikes: $190 short put, $210 short call

Credit Received for Strangle: $8.09

Covered Strangle Breakeven: $200 share price – $8.09 strangle credit = $191.91

The following visual describes the position’s potential profits and losses at expiration:

Covered Strangle Trade Results

As we can see here, the covered strangle profits when the stock price is above the breakeven price. In other words, the strategy profits when the losses on the shares do not exceed the premium collected for selling the strangle.

Additionally, we can see that the profit potential is capped at any stock price above the short call strike. Lastly, you may notice the losses accelerate when the stock price is below the short put strike. At expiration, an in-the-money short put has a delta of +100. Since a covered strangle trader already owns 100 shares, their net position delta will be +200 if the stock price is below the short put strike price.

Great job! You’ve learned the general characteristics of the covered strangle strategy. Now, let’s go through some visual trade examples to see how the strategy performs through time.

Options Trading for Beginners(2)(1)

New to options trading? Learn the essential concepts of options trading with our FREE 160+ page Options Trading for Beginners PDF.

Covered Strangle Trade Examples

In each example, note that we don’t specify the underlying, since the same concepts apply to covered strangles on any stock. Additionally, each example demonstrates the performance of a single covered strangle positionWhen trading more contracts, the profits and losses in each case are magnified by the number of covered strangles traded.

Let’s do it!

Small Covered Strangle Profits - Trade Example #1

The first example we’ll look at is a scenario where the stock price remains relatively flat after a hypothetical trader enters a covered strangle.

Initial Share Purchase Price: $212.44

Strangle Strikes and Expiration: Short 219 Call; Short 201 Put; Both options expiring in 63 days

Premium Collected for Strangle: $1.75 for the call + $0.83 for the put = $2.58

Breakeven Price: $212.44 share purchase price – $2.58 strangle credit = $209.86​

Maximum Profit Potential: ($219 short call strike – $209.86 breakeven) x 100 = $914

Maximum Loss Potential: [(201 Short Put – $2.58) + $212.44 Share Purchase Price] x 100  = $41,086 (stock price at $0)

Let’s see what happens!

Covered strangle trade 1

Covered Strangle #1 Trade Results

In the top half of the chart, you can see the stock price, short put and call strikes, and the covered strangle’s breakeven price. In this example, the stock price was relatively flat and was only a few points higher than the breakeven price at expiration.

In the bottom half of the chart, we can see the P/L performance of the covered strangle components (the green line represents the combined performance of the long shares and short strangle). In this example, the short strangle decayed steadily over time, and expired worthless at expiration. The long stock position ended up not making any money because the stock price was around $212.44 at expiration. However, the covered strangle made money overall because of the profits from the short strangle.

At expiration, this trader would not have to take any action to avoid assignment on the short options because the options are out-of-the-money. Additionally, this covered strangle trader would be able to sell another strangle in the next expiration cycle to collect more credit against their stock position.

Ok, so you’ve seen a slightly profitable covered strangle that breaks even. Next, we’ll look at a scenario where a covered strangle position realizes the maximum profit potential at expiration.

Maximum Profit Covered Strangle - Trade Example #2

In the following example, we’ll investigate a situation where the stock price rises continuosly after a hypothetical trader enters a covered strangle.

Here’s the setup:

Initial Share Purchase Price: $82.09

Strangle Strikes and Expiration: Short 95 Call; Short 67.5 Put; Both options expiring in 88 days

Premium Collected for Strangle: $2.54 for the call + $3.05 for the put = $5.59

Breakeven Price: $82.09 share purchase price – $5.59 strangle credit = $76.50

Maximum Profit Potential: ($95 short call strike – $76.50) x 100 = $1,850

Maximum Loss Potential: [(67.5 Short Put Strike – $5.59 Strangle Credit) + $82.09 Stock Purchase Price] x 100 = $14,400 (stock price at $0)

Let’s take a look:

Covered Strangle #2 Trade Results

In this example, we can see that the stock price surges from $82.09 to nearly $110 over the 88-day period the covered strangle was on. As a result, the long stock portion of the trade performed well, but the short strangle actually lost money. As a result, the long stock position performed the best, but the covered strangle wasn’t far behind.

At expiration, the short call would expire to -100 shares, which means the covered strangle trader would lose their long stock. If the trader wanted to keep their shares, the short call would need to be purchased back before expiration. However, it’s still possible that the trader is assigned early on the short call, so there’s no guarantee that the trader in this example would keep their shares.

Covered Strangle Gone Wrong - Trade Example #3

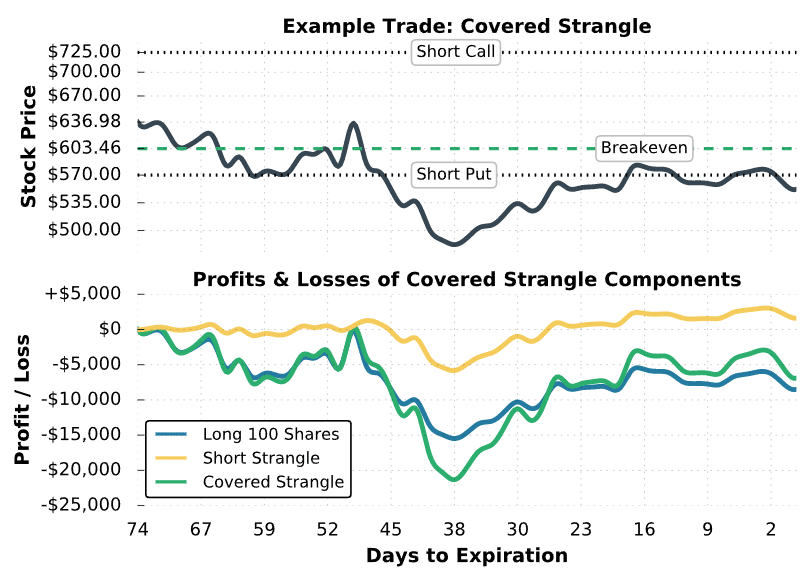
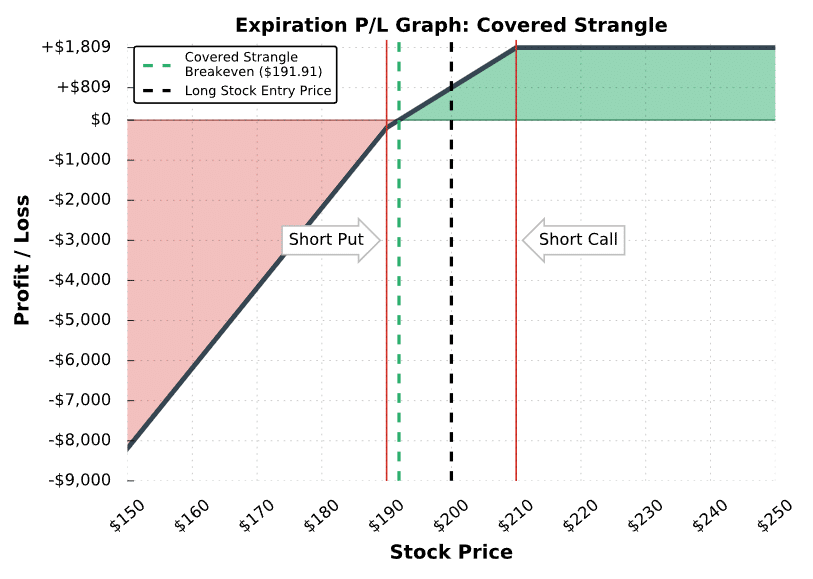
In the final example, we’ll look at a covered strangle trade that suffers significant losses due to a decrease in the stock price. Here’s the setup:

Initial Share Purchase Price: $636.98

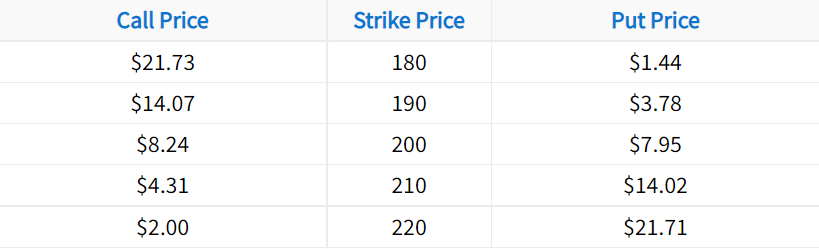
Strangle Strikes and Expiration: Short 725 Call; Short 570 Put; Both options expiring in 74 days

Premium Collected for Strangle: $19.60 for the call + $13.92 for the put = $33.52

Breakeven Price: $636.98 share purchase price – $33.52 strangle credit = $603.46

Maximum Profit Potential: ($725 short call strike – $603.46) x 100 = $12,154

Maximum Loss Potential: [(570 Short Put Strike – $33.52 Strangle Credit) + $636.98 Share Purchase Price] x 100 = $117,346 (stock price at $0)

Let’s see what happens!

covered strangle

Covered Strangle #3 Trade Results

As we can see here, the stock price fell from $636.98 to below $500 in a very short period. Consequently, the covered strangle performed poorly because the strategy includes long stock and a short put, which are both bullish components. Later on in the period, the covered strangle ended up outperforming the long stock position because the short strangle ended up being profitable.

At expiration, this covered strangle trader would be assigned +100 shares of stock from the 570 put. If the trader wanted to avoid assignment, they would need to buy back the short put before expiration. However, keep in mind that the put was deep-in-the-money before expiration, so there’s always a possibility that the trader gets assigned early.

Final Word

Congratulations! You now know how the covered strangle works as a trading strategy!

Perhaps the most important thing to take away from this strategy is the great downside risk – you have both stock AND short put exposure should the underlying plummet. 

Next Lesson

Chris Butler portrait

About the Author

Chris Butler received his Bachelor’s degree in Finance from DePaul University and has nine years of experience in the financial markets. 

Chris started the projectfinance YouTube channel in 2016, which has accumulated over 25 million views from investors globally.

Our Authors

Share this post

Leave a Reply

Your email address will not be published.