Last updated on February 10th, 2022 , 01:35 pm

The short strangle is an options strategy that consists of selling an out-of-the-money call option and an out-of-the-money put option in the same expiration cycle.
Since selling a call is a bearish strategy and selling a put is a bullish strategy, combining the two into a short strangle results in a directionally neutral position.
However, if the stock price moves towards one of the short strikes, the trade becomes directional and can suffer significant losses. When selling strangles, profits come from the passage of time or decreases in implied volatility, as long as large stock price movements in one direction do not occur.
Jump To
TAKEAWAYS
- The short strangle is best suited for neutral, or “sideways” market direction.
- One short call and one short put comprise this strategy.
- The loss on this strategy is infinite because of the short call sold.
- Total profit is limited to the credit received.
Short Strangle Strategy Characteristics
Before getting into examples, let’s look at the short strangle’s general characteristics:
➥Max Profit Potential: Total Credit Received x 100
➥Max Loss Potential: Unlimited
➥Expiration Breakevens:
Upper Breakeven = Call Strike Price + Total Credit Received
Lower Breakeven = Put Strike Price – Total Credit Received
➥Estimated Probability of Profit: Between 50-99% depending on the options sold. However, the higher the probability of profit, the lower the potential reward.
To demonstrate these characteristics in action, let’s take a look at a basic example and visualize the position’s potential profits and losses at expiration.
Expiration Profit/Loss Potential
In the following example, we’ll construct a short strangle position using the following option chain:
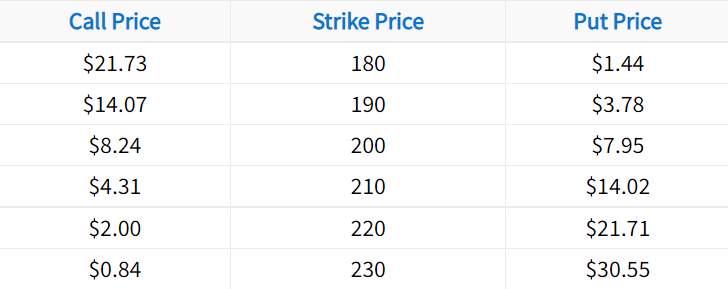
In this case, we’ll sell the 190 put and the 210 call. Let’s also assume the stock price is trading for $200 when the strangle is sold.
Initial Stock Price: $200
Short Strikes Used: 190 put, 210 call
190 Put Sale Price: $3.78
210 Call Sale Price: $4.31
Total Credit Received: $3.78 + $4.31 = $8.09
The following visual describes the potential profits and losses at expiration when selling this particular strangle:
Short Strangle Chart
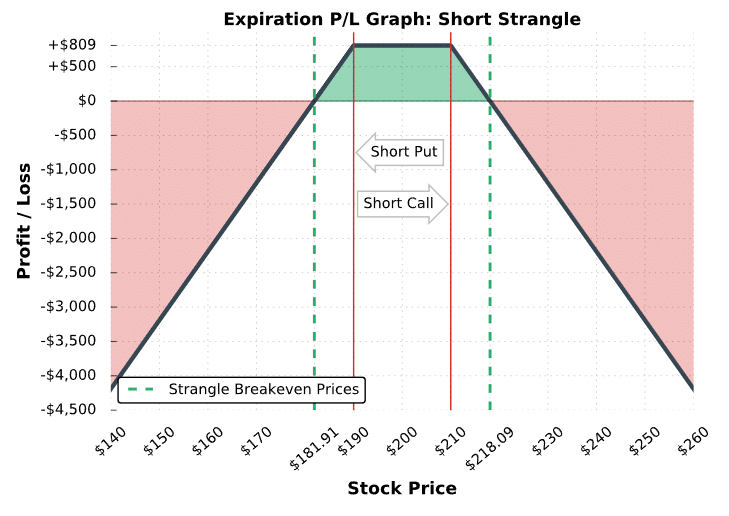
As illustrated here, a short strangle realizes the maximum profit potential when the stock price is between the short strikes at expiration because each option expires worthless. Additionally, the collection of premium extends the breakeven prices beyond the short strikes of the trade, which means the stock price can trade beyond one of the short strikes and the position can still be profitable.
More specifically, the strangle will be profitable at expiration as long as one of the options isn’t in-the-money by more than the total credit received from selling the strangle.
Short Strangle Trade Examples
To visualize the performance of strangles relative to the stock price, let’s look at a few examples of real strangles that recently traded. Note that we don’t specify the underlying, since the same concepts apply to short strangles on any stock. Additionally, each example demonstrates the performance of a single strangle position.
When trading more contracts, the profits and losses in each case will be magnified by the number of strangles traded.
(1)")
New to options trading? Learn the essential concepts of options trading with our FREE 160+ page Options Trading for Beginners PDF.
Trade Example #1: Maximum Profit Strangle
The first example we’ll look at is a situation where a hypothetical trader sells a strangle with a call and put that have deltas near ±0.20.
With a delta near ±0.20, the call and put both have an estimated 20% probability of expiring in-the-money, respectively. Because of this, the strangle as a whole has an approximate 40% probability of expiring in-the-money, which translates to a 60% probability of expiring out-of-the-money.
Here are the trade details:
Initial Stock Price: $212.44
Initial Implied Volatility: 14%
Strikes and Expiration: 201 put and 219 call expiring in 63 days
Strangle Sale Price: $1.75 for the put and $0.83 for the call = $2.58 total credit
Breakeven Prices: $198.42 and $221.58 ($201 – $2.58 and $219 + $2.58)
Maximum Profit Potential: $2.58 net credit x 100 = $258
Maximum Loss Potential: Unlimited
Let’s examine this historical trade’s performance:
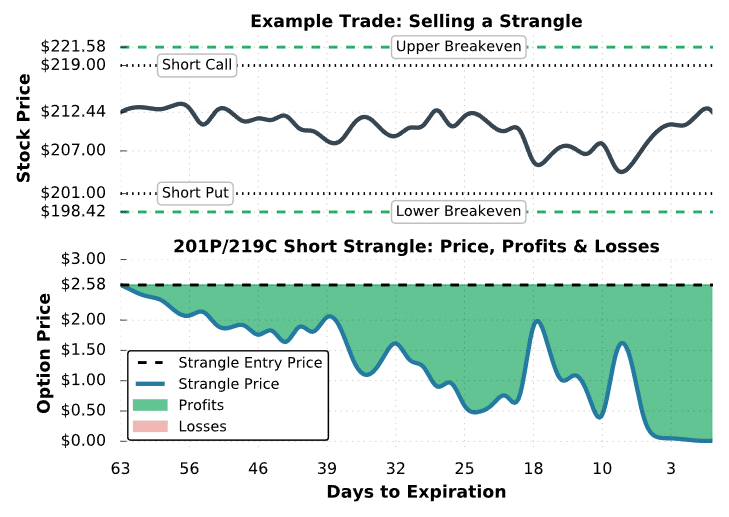
Strangle #1 Trade Results
As you can see, selling strangles is profitable as long as the stock price doesn’t rise or fall significantly. In this case, the stock price was between the short strikes the entire time, leading to profits from time decay. The options decrease in price as time passes because there is a diminishing probability that each option will expire in-the-money.
In other words, when the stock price remains between the short strikes, the probability that the call or put expire in-the-money decreases as time passes, which explains the strangles decaying price.
At around 18 days to expiration, you’ll notice that the strangle’s price rises from $0.50 to $2.00. The strangle’s price increase can be explained by the sharp stock price decrease and the subsequent increase in implied volatility to 21% (not visualized in the chart). However, the short strangle position was still profitable because the profits from time decay at that point were greater than the losses from the movements in the stock price and implied volatility.
In this example, the strangle price was below the initial sale price the entire period. As a result, the trader had ample opportunity to close the position before expiration to lock in profits. To close a short strangle, the short options need to be bought back at their current prices. For example, if the strangle trader bought back the strangle for a $1.00 debit, they would have locked in profits of $158: ($2.58 initial sale price – $1.00 closing price) x 100 = +$158.
With the stock price between the short strikes at expiration, the 201 put and 219 call expired worthless, resulting in the maximum profit potential of $258 for the strangle seller.
The example above demonstrates what can go right when selling strangles. In the next demonstration, we’ll look at a scenario where a short strangle position turns into a big loser.
Trade Example #2: Significant Loss
In the last example, you saw how a sharp decrease in the stock price towards the short put strike could lead to an increase in the price of the strangle. In this example, we’ll examine what happens to the price of a strangle when the stock price collapses through the short put strike. Additionally, we’ll investigate how the position’s directional exposure (delta) changes.
Here are the trade details:
Initial Stock Price: $524
Initial Implied Volatility: 26%
Strikes and Expiration: 495 put and 555 call expiring in 39 days
Strangle Sale Price: $6.35 for the put and $6.20 for the call = $12.55 total credit
Breakeven Prices: $482.45 and $567.55 ($495 – $12.55 and $555 + $12.55)
Maximum Profit Potential: $12.55 net credit x 100 = $1,255
Maximum Loss Potential: Unlimited
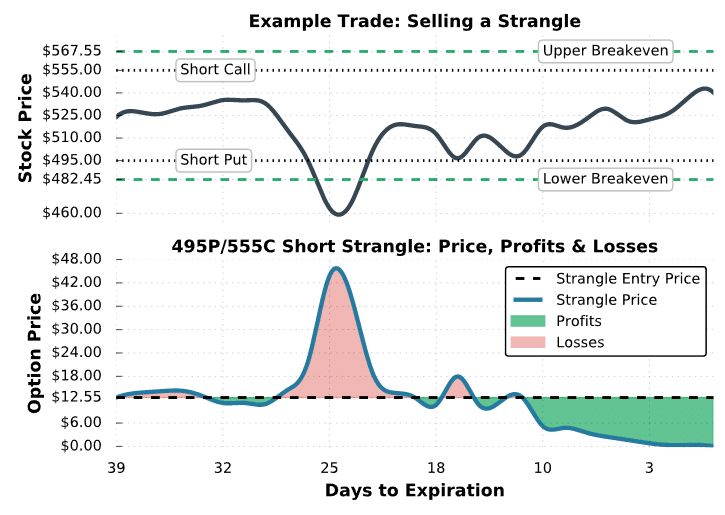
Strangle #2 Trade Results
As you can see here, the short strangle position did not experience continuous profits like the previous example. Between 32 and 24 days to expiration, the stock price collapsed from nearly $540 to $460, which is $35 below the short put’s strike price of $495. At the same time, implied volatility increased from 26% to 54%. As a result of the directional move and shift in implied volatility, the price of the put surged to $42 while the call price fell to $2. Because of this, with 25 days to expiration, the short strangle trader has the following profits and losses on each option:
➜ Short Call Profit: ($6.20 sale price – $2.00 current price) x 100 = $420
➜ Short Put Loss: ($6.35 sale price – $42.00 current price) x 100 = -$3,565
Net Loss: $420 profit – $3,465 loss = -$3,145
When the stock price collapses through the short put strike before expiration, the loss on the short put will likely be greater than the profit on the short call, resulting in a net loss for a strangle seller.
On the other hand, when the stock price increases through the short call strike before expiration, the loss on the short call will likely be greater than the profit on the short put, which also results in a net loss for the short strangle trader.
Fortunately, in this example, the stock price regained its losses and was between the short strikes at expiration, leading to the maximum profit of $1,255 for the strangle seller.
As mentioned previously, the strangle trader in this example could have closed the position early to lock in losses. For example, if the trader wanted to cut the losses when the strangle traded up to $30, they could have bought back the strangle for $30 and locked in losses of $1,745: ($12.55 initial sale price – $30 closing price) x 100 = -$1,745.
Negative Gamma Demonstration
In addition to demonstrating the potential losses from selling strangles, the example below serves as a great demonstration of how a strangle’s directional risk can change rather quickly. A short strangle position has negative gamma, which means that as the stock price trends in one direction, the position delta (directional exposure) of the position will grow in the opposite direction.
For example, if the stock price increases, the delta of a short strangle position will become more negative, resulting in a bearish position. Conversely, when the stock price decreases, the delta of a short strangle position will grow more positive, resulting in a bullish position.
Let’s visualize the concept of negative gamma using the same example as above:
Short Strangle and Delta
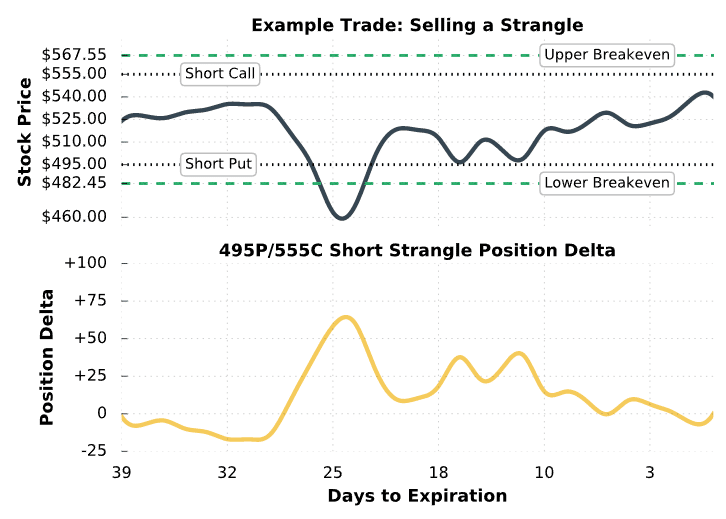
As visualized here, the position delta of the short strangle moves inversely with the stock price. When the stock price increases, the position delta becomes more negative. When the stock price decreases, the position delta becomes more positive. Therefore, when trading neutral trading strategies, understand that the positions can become very directional in a short period of time.
In this example, the position delta started near zero because a +0.20 delta call and -0.20 delta put were sold (respective position deltas of -20 and +20). However, when the stock price collapsed, the put delta approached -1 while the call delta approached zero. As a result, the position delta grew positively because being short a negative delta option (a put) results in a positive position delta.
In the case of this 495/555 strangle, the position delta increased from -20 to +70 when the stock price fell from $540 to $460. With a position delta of -20, the short strangle has the directional exposure of being short 20 shares of stock. On the other hand, with a position delta of +70, the short strangle has the directional exposure of being long 70 shares of stock.
The moral of the story is that a short strangle is not likely to remain directionally neutral when the stock price changes. Because of this, the delta of a short strangle should be monitored closely, especially near expiration.
Trade Example #3: Partially Profitable Short Strangle
In the final example, we’ll look at a scenario where a short strangle trader only makes a partial profit at expiration. Partial profits occur when the stock price is between one of the short strikes and the breakeven price on that side. Here’s the setup:
Initial Stock Price: $108.29
Strikes and Expiration: 103 put and 111 call expiring in 44 days
Strangle Sale Price: $1.40 for the put and $1.82 for the call = $3.22 total credit
Breakeven Prices: $99.78 and $114.22 ($103 – $3.22 and $111 + $3.22)
Maximum Profit Potential: $3.22 net credit x 100 = $322
Maximum Loss Potential: Unlimited
Let’s see what happens!
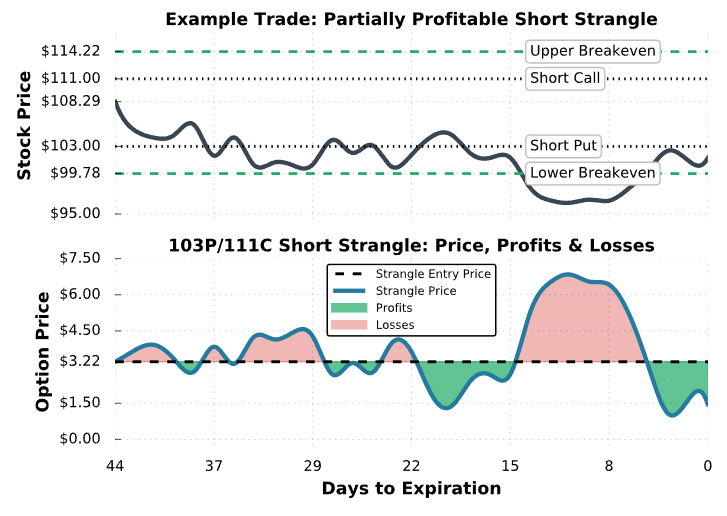
Strangle #3 Trade Results
As we can see here, the stock price fell below the short put strike shortly after the trade was entered, and remained below the put for most of the period. Consequently, this short strangle did not do particularly well, and was worth almost twice the entry credit at one point. However, the position was partially profitable at expiration because the stock price was above the lower breakeven price.
With the stock price at $101.50 at expiration, the 103 put expired worth $1.50, resulting in a profit of $172: ($3.22 initial sale price – $1.50 strangle price at expiration) x 100 = +$172.
Regarding a share assignment, the 103 short put would expire to +100 shares of stock if held through expiration. To avoid a share assignment, the put would need to be bought back before expiration. However, it’s always possible that the trader is assigned early on the in-the-money short put before expiration.
Final Word
Let’s briefly review a few of the key concepts we have learned:
- When the stock prices breaks one of the strike prices sold, the strangle can experience significant losses.
- In the strangle, the most you can ever make is the credit received.
- Short strangles have a negative gamma, which has an inverse relationship with delta.

projectfinance Options Tutorials

About the Author
Chris Butler received his Bachelor’s degree in Finance from DePaul University and has nine years of experience in the financial markets.
Chris started the projectfinance YouTube channel in 2016, which has accumulated over 25 million views from investors globally.