Implied volatility is a crucial options trading concept for beginners to understand, but it can be a daunting thing to learn because it seems very complex.
While the math behind calculating implied volatility is complex, all we need to know as options traders is this:
➜ Implied volatility quantifies option prices and expresses those option prices as one number.
Instead of looking at 100s of option prices on various stocks and wondering whether they’re “cheap” or “expensive,” we can look at implied volatility to quickly assess a stock’s option prices, and what the market thinks about that stock in terms of risk.
Understanding Implied Volatility: What Do Option Prices Represent?
Before talking about why implied volatility changes, let’s quickly discuss what option prices actually represent:
➜ Option prices are representative of the market’s anticipation of a stock’s volatility over some period of time in the future.
When trying to understand why implied volatility changes, we need to take one step back and think about why option prices change.
The #1 Driver of Option Price Changes
Perhaps the #1 general driver of option prices changes is historical/realized volatility, or how large a stock’s recent price movements have been.
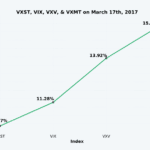
To verify this statement, I plotted the relationship between 1-month historical volatility of the S&P 500 and the VIX Index, which measures 1-month option prices on the S&P 500:

The horizontal axis (x-axis) represents the 1-month historical volatility of the S&P 500 Index (SPX) on each trading day since the VIX Index began.
The vertical axis (y-axis) represents the VIX Index closing value on each of the days the historical volatility was recorded. When plotted against each other, there is a clear relationship between historical volatility and implied volatility (option prices):
➜ When the market is experiencing more volatility (higher 1-month historical volatility readings), the 1-month option prices on the S&P 500 tend to be higher as well (higher 1-month option prices = higher VIX Index).
➜ When the market is less volatile (left side of chart), option prices are cheaper.
Let’s look at some real market examples and validate this idea even further.
Market Volatility vs. Option Prices
In the chart below, we’ve placed a box around a very low volatility period. As we can see, the market was grinding higher during this period and did not experience any large decreases:

Software Used: tastyworks
The very end of the boxed region in the chart above is November 1st, 2018.
On that day, we looked at the 30-day straddle price on SPY.
Here are the relevant statistics:
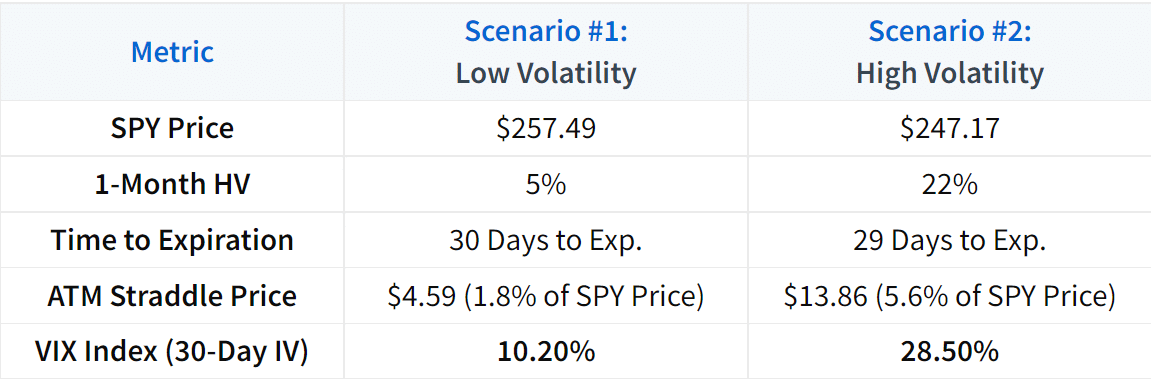
SPY Closing Price: $257.49
Expiration/Options Analyzed: 30 Days to Expiration
257.50 Straddle Price: $4.59 (1.78% of SPY’s Closing Price)
VIX Index (30-Day Implied Volatility): 10.2%
After a period of low volatility, the 30-day straddle on SPY was trading for 1.8% of SPY’s closing price, and the VIX Index was at 10.20.
Let’s look at the same exact metrics in a high volatility market.
The chart below features an extremely high volatility period. The end of the boxed region is December 20th, 2018:

Software Used: tastyworks
Here are the relevant statistics from December 20th, 2018:
SPY Closing Price: $247.17
Expiration/Options Analyzed: 29 Days to Expiration
247 Straddle Price: $13.86 (5.6% of SPY’s Closing Price)
VIX Index (30-Day Implied Volatility): 28.50%
As we can see, the at-the-money straddle price was significantly higher after this particular high volatility period, as the 29-day straddle was trading for 5.6% of SPY’s closing price. As a result, the VIX Index was at 28.50.
Comparison: Option Prices in High vs. Low Volatility Markets
Let’s compare each volatility environment and the respective option prices side-by-side:
(1)")