Implied Volatility and Calendar Spreads

The long calendar spread is an options strategy that consists of selling a near-term option, while simultaneously purchasing a longer-term option at the same strike price. Calendar spreads can be constructed with calls or puts. 

Since both options use the same strike price, they’ll both always have the same amount of intrinsic value, which means a calendar spread attempts to take advantage of the extrinsic values of each option.

Jump To

Options Trading for Beginners(2)(1)

New to options trading? Learn the essential concepts of options trading with our FREE 160+ page Options Trading for Beginners PDF.

A Long Calendar Spread’s Profit Drivers

When analyzing the position Greeks of a long calendar spread, we find that the position has positive theta and positive vega. As a result, a calendar spread can profit in two ways:

#1: The passage of time while the underlying price remains close to the strike price of the calendar. As time passes, the short option should lose more value than the long option, generating profits for a long calendar spread trader.

#2: An increase in implied volatility. The longer-term option has a higher vega value than the near-term option, which means the long option should gain more value than the short option when implied volatility increases.

Consider the following example trade:

As we can see from the example calendar spread, the position has positive theta and positive vega. The positive theta value of +$0.11 means a trader who owns this calendar spread should theoretically make $11 ($0.11 x 100) in profit with each day that passes, all else being equal. The positive vega value of +$1.22 indicates that the long calendar spread trader should profit by $122 ($1.22 x 100) if each option’s implied volatility increases by 1%. There’s just one problem: short-term and long-term implied volatilities (option prices) do not typically change at the same rate.

What if the short put’s implied volatility increases by 2% and the long put’s implied volatility increase by 1%? In this scenario, the long calendar trader would actually be expected to lose money from the volatility increase: (-$2.74 Short Option Vega x 2 Point IV Increase) + ($3.96 Long Option Vega x 1 Point IV Increase) = -$5.48 + $3.96 = -$1.52. So, despite the long calendar spread’s positive vega of +$1.22, a trader who owned the calendar spread is expected to lose $152 if the short option’s IV increases by 2% while the long option’s IV only increases by 1%.

Near-Term vs. Long-Term Option Price Sensitivity

To illustrate the difference between short-term and long-term option price (implied volatility) sensitivities, we can look at implied volatility indices that track SPX option prices with various amounts of time until expiration. Here are the three volatility indices we’ll examine:

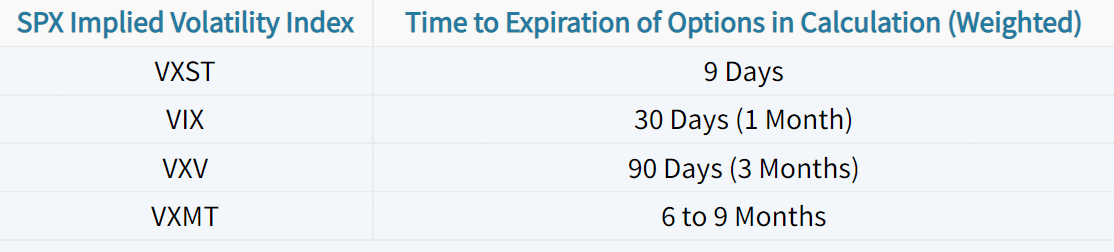
By tracking the values of each index over time (especially through a period in which SPX implied volatility increases), we can learn how option prices with various amounts of time until expiration change relative to each other.

Let’s take a look at how each of these volatility indices changed through the market correction in August of 2015:


SPX Implied Volatilities

When the S&P 500 Index (SPX) began to collapse in late August, we can see that each of the volatility indices increased, indicating an increase in SPX option prices across the board. However, we can see that the nearest-term SPX options (as quantified by VXST) experienced the largest increase in implied volatility, while the longer-term SPX options (as quantified by VXMT) did not experience the same volatility increase.

So, despite the fact that long calendar spreads trade with positive vega, they can actually lose money from an increase in implied volatility. However, since significant increases in implied volatility tend to occur when the market crashes, a long calendar spread will likely be a losing position anyways, as the market will be moving away from the calendar’s strike price.

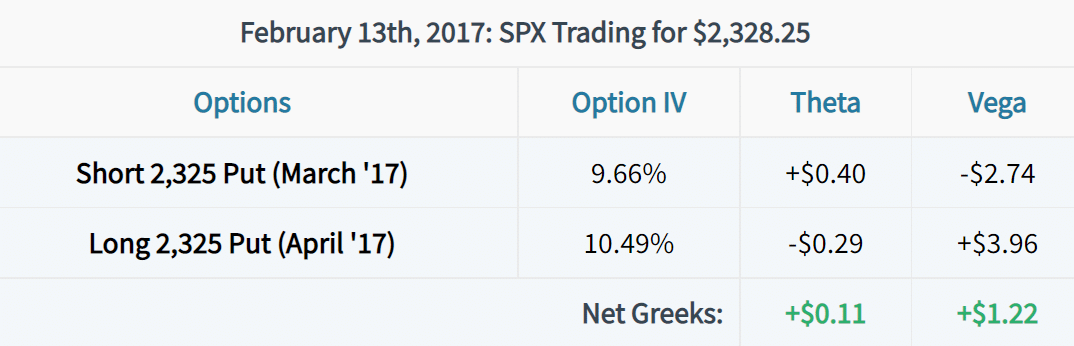
Trade Example #1: Directional Long Calendar Through a Stock Market Correction

Let’s look at some real long calendar examples to demonstrate the concepts discussed above.

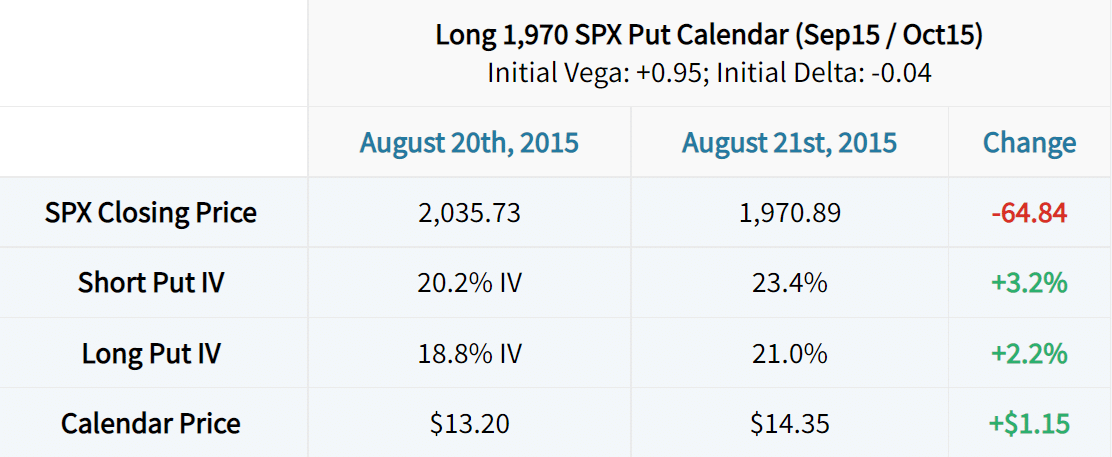
The first example we’ll look at is a bearish long calendar spread in August of 2015. The short option is the 1,970 put expiring in September 2015, and the long option is the 1,970 put expiring in October 2015. On August 20th, the September 1,970 put had a vega of +1.99, while the October 1,970 put had a vega of +2.94. Let’s see what happened to the calendar spread after the market fell to the calendar’s strike price:

Based on the +1.99 vega of the September 1,970 put, a 3.2% increase in implied volatility should result in a $6.37 increase in the short put’s price (+1.99 x +3.2 = +$6.37). With a vega of +2.94, a 2.2% increase in the October 1,970 put’s implied volatility should result in a $6.47 increase in the long put’s price (+2.94 x +2.2 = +$6.47). Since a long calendar spread trader is short the near-term option and owns the longer-term option, the changes in implied volatility only account for $0.10 of the profits on the spread ($6.37 loss on the short option + $6.47 profit on the long option = +$0.10 profit).

The additional $1.05 in profits can be explained by the calendar spread’s bearish directional bias, as the delta of the spread was -0.04 on August 20th.

So, the moral of the story is that even though the stock price fell to the calendar strike and implied volatility increased, the price of the long calendar spread only increased by 8.7% (with most of the gains coming from the spread’s directional bias). This is because the near-term implied volatility increased more than the long-term implied volatility, resulting in less of a volatility impact than the Greeks initially indicated.

Trade Example #2: Long Calendar Spread Profits from an IV Decrease

As we discussed earlier, near-term option prices (implied volatility) are much more sensitive than longer-term option prices (implied volatility). Knowing this, can long calendar spreads actually profit when volatility decreases, despite having positive vega?

To answer this question, let’s look at a long calendar spread that’s entered in a period of high implied volatility. More specifically, where the near-term IV is at a premium to the longer-term IVs (a condition referred to as backwardation). In this example, we’ll look at a long 1,860 SPX call calendar spread between January 20th and January 22nd of 2016. On January 20th, 2016, the February 1,860 call had a vega of +2.12, and the March 1,860 call had a vega of +2.95. Let’s look at the trade metrics from entry until two days after:

Based on the +2.12 vega of the February 1,860 call, a 2.3% decrease in implied volatility should result in a $4.88 decrease in the short call’s price (2.12 x -2.3 = -$4.88). With a vega of +2.95, a 1.3% decrease in the March 1,860 call’s implied volatility should result in a $3.84 decrease in the long call’s price (+2.95 x -1.3 = -$3.84). As a result, the net profit from the volatility changes alone is +$1.04 per calendar spread ($4.88 profit on the short call’s price decrease – $3.84 loss on the long call’s price decrease = +$1.04).

So, despite having a vega of +0.83, the long calendar spread actually made money from the decrease in implied volatility. The volatility-related profits can be explained by the fact that the short option’s implied volatility decreased more than the long option’s implied volatility.

Now, since SPX rallied away from the calendar’s strike price of $1,860, the trade began to incur directional losses that offset the profits from the volatility decrease, which is why the overall gain was only $0.55. Either way, this example serves as a nice demonstration as to how a long calendar spread can actually profit from an implied volatility decrease.

What’s the Point?

So, what’s the point of all of this? First, and perhaps the biggest thing I want you to take away from this post is that calendar spreads may not be good long volatility trades, even though they trade with positive vega. Additionally, calendar spreads lose their ability to profit when the stock price rises or falls significantly, with the latter being the cause for most significant implied volatility increases. In my opinion, long calendar spreads are really designed to take advantage of low realized volatility (small movements in the underlying), in which case profits occur from the front-month option decaying at a faster rate than the back-month option.

Second, even though long calendar spreads trade with positive vega, they may actually be suitable for entries in extremely high implied volatility. Why? Because you’re selling inflated near-term implied volatility and buying a cheaper longer-term implied volatility. If the market trades sideways for one or two days and volatility falls, the near-term implied volatility should fall faster than the longer-term implied volatility, translating to quick profits for a long calendar spread trader. However, if the only goal is to trade the near-term vs. longer-term IVs, a “cleaner” trade can be constructed with VIX futures calendar spreads (for larger accounts), or synthetics in VIX options (to trade with smaller size).

Summary of Main Concepts

To quickly summarize what this post has covered, here are the key points to remember:

  • A long calendar spread has positive theta and positive vega, which means the position profits from the passage of time (as long as the stock price is near the strike price), and an increase in implied volatility (if both options experience a similar increase in implied volatility, or the long option experiences a larger increase in implied volatility).

  • Though a long calendar spread has positive vega, losses can actually occur from IV increases, as near-term IV typically rises faster than longer-term IV.

  • In the same vein, long calendar spreads can actually profit from falling implied volatility, as near-term IV typically falls faster than longer-term IV. This type of setup is most common after a severe market correction, in which case the near-term IVs will trade at a significant premium to the longer-term IVs (a condition called backwardation).
Chris Butler portrait

About the Author

Chris Butler received his Bachelor’s degree in Finance from DePaul University and has nine years of experience in the financial markets. 

Chris started the projectfinance YouTube channel in 2016, which has accumulated over 25 million views from investors globally.

Our Authors

Share this post

Leave a Reply

Your email address will not be published.