IV Rank vs. IV Percentile: Which is Better?

Jump To

When trading options, understanding both IV rank and IV percentile can be very advantageous – but is one metric more beneficial than the other? In this article, projectfinance will stack these two volatility metrics side by side – and declare a winner!

Stocks and Implied Volatility

All stocks in the market have unique personalities in terms of implied volatility (their option prices). For example, one stock might have an implied volatility of 30%, while another has an implied volatility of 50%. Even more, the 30% IV stock might usually trade with 20% IV, in which case 30% is high. On the other hand, the 50% IV stock might usually trade with 75% IV, in which case 50% is low.

So, how do we determine whether a stock’s option prices (IV) are relatively high or low?

The solution is to compare each stock’s IV against its historical IV levels. We can accomplish this by converting a stock’s current IV into a rank or percentile.


Options Trading for Beginners(2)(1)

New to options trading? Learn the essential concepts of options trading with our FREE 160+ page Options Trading for Beginners PDF.

Implied Volatility Rank (IV Rank) Explained

Implied volatility rank (IV rank) compares a stock’s current IV to its IV range over a certain time period (typically one year).

Here’s the formula for one-year IV rank:


iv rank formula 2

For example, the IV rank for a 20% IV stock with a one-year IV range between 15% and 35% would be:


iv rank example

An IV rank of 25% means that the difference between the current IV and the low IV is only 25% of the entire IV range over the past year, which means the current IV is closer to the low end of historical volatility

Furthermore, an IV rank of 0% indicates that the current IV is the very bottom of the one-year range, and an IV rank of 100% indicates that the current IV is at the top of the one-year range.

Implied Volatility Percentile (IV Percentile) Explained

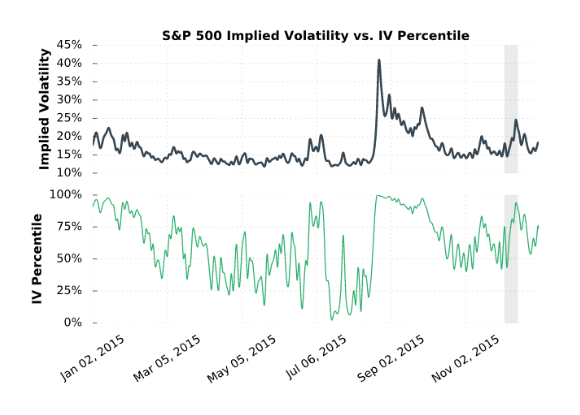
Implied volatility percentile (IV percentile) tells you the percentage of days in the past that a stock’s IV was lower than its current IV.

Here’s the formula for calculating a one-year IV percentile:


IV percentile formula

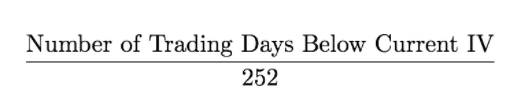
As an example, let’s say a stock’s current IV is 35%, and in 180 of the past 252 days, the stock’s IV has been below 35%. In this case, the stock’s 35% implied volatility represents an IV percentile equal to:


IV percentile formula example

An IV percentile of 71.42% tells us that the stock’s IV has been below 35% approximately 71% of the time over the past year.

Applications of IV Rank and IV Percentile

Why does it help to know whether a stock’s current implied volatility is relatively high or low? Well, many traders use IV rank or IV percentile as a way to determine appropriate strategies for that stock.

For example, if a stock’s IV rank is 90%, then a trader might look to implement strategies that profit from a decrease in the stock’s implied volatility, as the IV rank of 90% indicates that the stock’s current IV is at the top of its range over the past year (for a one-year IV rank).

On the other hand, if a stock’s IV rank is 0%, then options traders might look to implement strategies that profit from an increase in implied volatility, as the IV rank of 0% indicates the stock’s current implied volatility is at the bottom of its range over the past year.

So, with IV rank and IV percentile at your disposal, which one should you use? Is one better than the other? In the next section, we’ll compare the two metrics visually, and explain why one may be better than the other.

IV Rank vs. IV Percentile: Which is Better?

So, at this point you know about IV rank and IV percentile as a means to gauging a stock’s current vs. historical levels of implied volatility, but which one should you use?

IV Rank Doesn't Tell the Whole Story

Recall that IV rank tells you where a stock’s current implied volatility lies relative to its IV range over a certain period of time, typically a year.

One of the issues with IV rank is that if a stock’s IV surges to an abnormally high level, almost all IV rank readings going forward will be low, even if the stock’s current IV is still relatively high.

As an example, consider the following chart:

If you focus your attention on the very first days in this chart, you’ll notice that the S&P 500 implied volatility was around 22.5%, which translated to an IV rank over 75%. However, later on in the year implied volatility spikes to 40%. In the shaded region on the very right of the graph, you’ll notice that implied volatility rises to 25%, but now IV rank is less than 50%.

When IV falls after a massive surge in implied volatility, IV rank readings will be low even when the implied volatility of the stock price is still relatively high. In this example, the implied volatility of the S&P 500 is below 20% almost the entire year, but after the significant spike in implied volatility, the IV of 25% translates to an IV rank less than 50% later in the year.

Now, let’s look at the same time period, except this time we’ll examine IV percentile:


As we can see, even after the spike in implied volatility to 40%, the rise in implied volatility to 25% at the end of the year translated to an IV percentile of 93%, indicating that implied volatility was below 25% in 93% of the days over the past year.

Now, when the implied volatility of the S&P 500 spiked to 40%, what would happen if it stayed at 40% for an extended period of time? Well, IV rank would be pinned at 100%, telling you that the 40% IV is the highest implied volatility the S&P 500 has seen over the past year. However, IV percentile would fall, as the 40% IV becomes more “normal.” So, when a market’s implied volatility personality changes, IV percentile will be the first to let you know.

Final Word

IV Percentile

So, the bottom line is that IV rank or IV percentile can be used to gauge a stock’s level of implied volatility (current level of volatility) relative to its historical levels of implied volatility. However, IV percentile tells you more of the story, and serves as a better “mean-reversion” indicator. Furthermore, IV percentile doesn’t suffer from the flaw of IV rank after an abnormally large increase in implied volatility.

IV Rank vs IV Percentile FAQs

IV rank and IV percentile are not the same. Both IV rank and IV percentile examine current levels of implied volatility, but they do so using different metrics. IV rank compares present IV to both high and low volatility levels over the past 252 days; IV percentile tells us the percentage of days over the last year when IV was lower than its present level.

IV rank tells us whether the current implied volatility is high or low in relation to the historic one year volatility of an underlying. 

When the IV percentile for an underlying is high, that implies option premiums will also be elevated. This may be a good time to sell premium using options strategies such as strangles, straddles, vertical spreads (credit spreads) and iron condors. However, if you believe the stock price will experience even higher volatility in the short-term, debit spreads may be more appropriate. 

Additionally, with low IV percentile, traders tend to favor net long positions in options. 

Chris Butler portrait

About the Author

Chris Butler received his Bachelor’s degree in Finance from DePaul University and has nine years of experience in the financial markets. 

Chris started the projectfinance YouTube channel in 2016, which has accumulated over 25 million views from investors globally.

Our Authors

Share this post

Leave a Reply

Your email address will not be published.