Last updated on February 11th, 2022 , 07:07 am

Jump To
Direxion has just released yet another leveraged ETF. The SWAR ETF is a rather niche tech fund, focusing exclusively on the “software” segment of tech.
The aim of the fund is to track the S&P North American Expanded Technology Software Index at a leveraged ratio of 2:1 (200%).
Like all leveraged ETFs, it is important to note that SWAR is best suited for short-term traders. The financial instruments used to achieve leverage (futures and derivatives), often result in long-term underperformance when compared to the underlying index.
TAKEAWAYS
- Direxion’s SWAR ETF is a bullish fund that seeks a return that is 200% the return of its software benchmark index.
- Direxion aims to provide this leverage on a daily basis; not in the long-run.
- SWAR charges a very high fee of 1.07%
- The vast majority of stocks in this fund fall within the IT sector, while the rest are in communication stocks.
- Over the long-run, SWAR will likely underperform its benchmark (leverage aside).
- “Swaps” are used in this fund to achieve a leverage ratio of 2×1 (200%).
SWAR ETF Factsheet
- Expense Ratio: 1.07%
- Market Direction: Bullish
- Index: S&P North American Expanded Technology Software Index
- Number of Holdings: 130
- Leverage: 200% (2×1)
- Average Spread: $0.05
- Average Market Cap: 78.07 Bil
Before we dig too much into Direxion’s SWAR ETF, it may first help to have a better understanding of the index which the fund aims to track (at a 2×1 ratio).

New to options trading? Learn the essential concepts of options trading with our FREE 160+ page Options Trading for Beginners PDF.
S&P N. American Expanded Tech Software Index
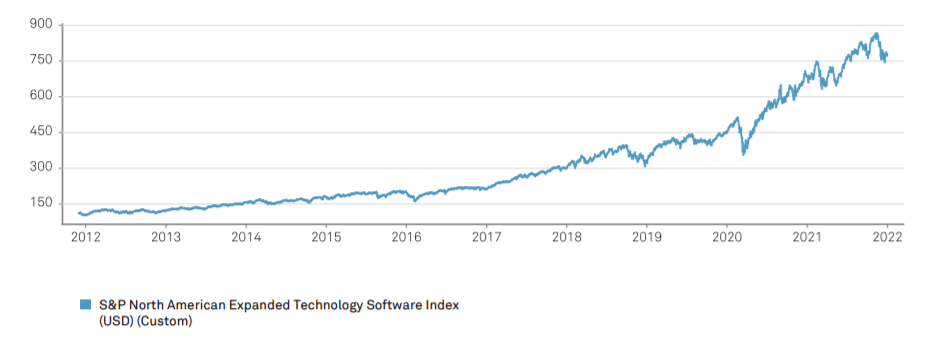
Chat from https://www.spglobal.com/
The S&P North American Expanded Technology Software Index is a product of S&P Dow Jones Indices.
What sets this index apart from other tech funds is its software focus. The aim of this index is to:
"...measure U.S. traded securities in the GISC application software, systems software, and home entertainment software sub industries as well as applicable supplementary stocks."
spglobal.com
SWAR: Fees
- Expense Ratio: 1.07%
Like most leveraged exchange-traded funds (ETFs), the net expense-ratio for SWAR is quite high. When comparing SWAR’s fees to the average ETF fee of 0.40%, 1.07% is quite high indeed.
In fact, SWAR exceeds even the average leveraged ETF fee of 0.95%. These types of funds do require considerably more management, but perhaps not enough to justify a fee of over 1%.
SWAR: Fund Sectors
In order to understand the sectors that comprise the SWAR ETF we only need to look to its benchmark: The S&P North American Expanded Technology Software Index.
SWAR Sectors by Percentage
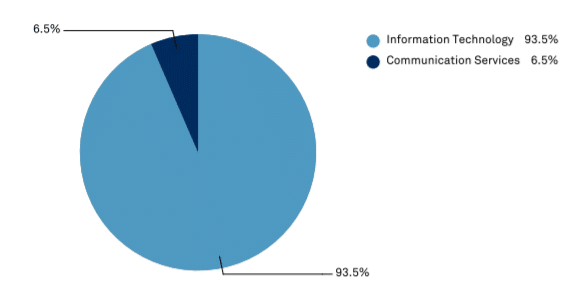
Image from https://www.spglobal.com/
As suspected, SWAR is dominated by stocks within the Information Technology sector. Additionally, a small portion of the portfolio has exposure to the Communication Services sector. The stocks within this sector do indeed have exposure to software, but in a more oblique fashion than those in the IT sector.
SWAR also has some minor exposure to Canadian stocks. The stocks within this ETF are divided across North America in the following manner:
- United States: 98.8%
- Canada: 1.2%
SWAR: Top Stocks
SWAR’s underlying index (S&P North American Expanded Technology Software Index), is a “modified market cap weighted index”. The value of the index is a summation of the aggregate value of the individual share weights.
Like many tech ETFs, the top ten holdings dominate market share. For SWAR, the top ten stocks represent 45% of the funds value:
SWAR: Top Ten Stocks and Weight
- Microsoft: 7.74%
- Salesforce: 7.34%
- Adobe: 6.86%
- Intuit: 6.34%
- Oracle: 4.94%
- ServiceNow: 4.53%
- Autodesk: 2.16%
- Synopsys: 1.97%
- Palo Alto Networks: 1.92%
- Workaday: 1.84%
SWAR: Leverage Utilization
Like most leveraged ETFs, the ways in which SWAR uses leverage to achieve its ideal 2×1 ratio is quite nebulae.
In the fund’s prospectus, I was able to locate one derivative position the fund employs to achieve its leverage:

So the fund does not use options, nor stock futures, but a swap to gain leveraged exposure.
Swaps are unlike options in that they are private, non-standardized, and widely unregulated agreements between two parties, generally large financial institutions.
Swaps do indeed have counter-party risk, but it is unknown the degree to which this risk exists in the SWAR ETF. Many times, funds can mitigate this risk through additional measures.
Final Word
For incredibly bullish investors looking for very short-term exposure to the IT software sector, SWAR appears to be a great option.
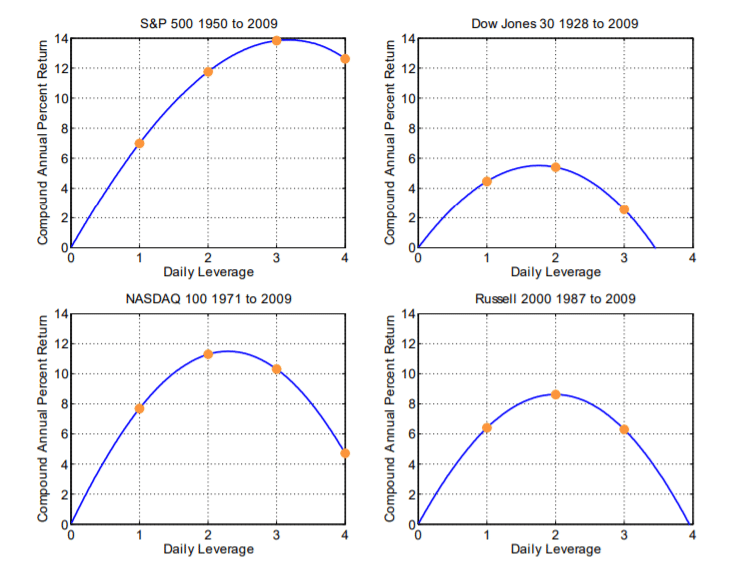
However, this is not a set-it-and-forget-it ETF. When you factor in both the cost of rolling derivatives and the very high fees, SWAR will almost certainly underperform the index in the long-run (not considering leverage).
Leveraged ETFs tend to lose their most value in very bearish markets. On a particularly volatile day when the underlying index is down 1%, it will not be uncommon for 2x leveraged products to fall more than 2%.
The problem here is that when/if the market rallies again, these types of funds rarely make up for that decay lost during the downturns.
However, when compared to 3x leveraged products, 2x wins the vast majority of the time in the long run.
We’ll conclude our article by taking a look at the results of a study by Tony Cooper comparing the performance of various leveraged indices over a long period of time.
Long Term Leveraged ETF Performance
