Last updated on February 14th, 2022 , 07:07 am
Vanguard ETF Comparison
| VTI | VOO | VGT | |
|---|---|---|---|
|
Issuer: |
Vanguard |
Vanguard |
Vanguard |
|
Index: |
CRSP US Total Market Index |
S&P 500 Index |
MSCI US Investable Market Index IT 25/50 |
|
Category: |
Large Blend |
Large Blend |
Technology |
|
Dividend Yield (30 day SEC): |
1.15% |
1.23% |
0.58% |
|
Expense Ratio (fees): |
0.03% |
0.03% |
0.10% |
|
Number of Stocks: |
4,025 |
510 |
342 |
|
10 Year Return: |
16.09% |
16.17% |
22.61% |
|
Growth of 10k Over 10 Years: |
$44,462 |
$44,783 |
$76,853 |
|
Risk (out of 5) |
4 |
4 |
5 |
Data from Vanguard
Table of Contents
Jack Bogle (founder of Vanguard) once said, “The greatest enemies of the equity investor are Expenses and Emotions.”
Vanguard set out to create funds that 1) were cheap and 2) took the emotion out of the equation.
And boy, were they successful! Vanguard currently offers more than 80 funds in the exchange-traded fund (ETF) space alone. Today, we’re going to compare three of Vanguard’s more popular “emotionless” index-tracking ETFs.
Highlights
Vanguard’s VTI ETF tracks just about all market sectors and capitalizations in the US.
Vanguard’s VOO ETF tracks the S&P 500 Index. This index covers 80% of the market cap in the public space.
Vanguard’s VGT is a more niche fund, condensing its equities across the Information Technology space.
Over the past 10-years, the performance of VGT has far surpassed the performance of VTI and VOO; however, the risks with this ETF are greater.
VTI vs VOO vs VGT: Comparing Benchmarks
The first (and most important) difference between our three ETFs lay in the different indexes they represent and attempt (quite successfully) to track.
Most everyone has heard of the S&P 500 Index, which VOO tracks; but what is VTI’s underlying index, the CRSP US Total Market Index, all about?
Additionally, what about VGT’s MSCI US IMI Information Technology 25/50 Index? What the heck does that mean?
Let’s figure it out!
VTI: CRSP US Total Market Index
As stated in the fund’s prospectus, the ambitious aim of the Vanguard Total Stock Market ETF (VTI) is to track “the performance of a benchmark index that measures the investment return of the overall stock market.”.
So how, exactly, does Vanguard go about this? By composing an ETF that seeks to track the performance of the CRSP US Total Market Index.
CRSP is the acronym for The Center for Research in Security Prices. The CRSP index (under the ticker CRSPTMT) is the brainchild of the CRSP organization, which is affiliated with the University of Chicago Booth School of business. Here’s how they define their index:
"Nearly 4,000 constituents across mega, large, small and micro capitalizations, representing nearly 100% of the U.S. investable equity market, comprise the CRSP US Total Market Index."
CRSP.ORG
Vanguard does a fine job of tracking this immense index, which is why Morningstar gave the fund 4 stars.
Vanguard’s VTI contains an impressive portfolio of over 4,000 stocks, mimicking that of the CRSP Index. What differentiates this index from the other ones on our list is its breadth; VTI doesn’t limit its exposure to only large caps (like VOO) or technology stocks (like VGT) but includes equities of all capitalizations classes (small-cap, mid-cap, and large-cap).
Vanguard’s VTI fund focuses on domestic stocks. If an investor wanted to add international stocks to their portfolio, they could buy the Vanguard Total International Stock ETF (VXUS) and be completely diversified across all equities in existence.
(1)")
New to options trading? Learn the essential concepts of options trading with our FREE 160+ page Options Trading for Beginners PDF.
VOO: S&P 500 Index Explained
Vanguard’s VOO ETF seeks to track the performance of the S&P 500 Index. This index is the most followed in the entire world. It has been the benchmark for innumerable funds since its inception in 1926.
The aim of the S&P 500 Index (maintained by S&P Dow Jones Indices) is to track the performance of the largest 500 publicly listed companies in the United States.
"The (S&P 500) index includes 500 leading companies and covers approximately 80% of available market capitalization."
SPGLOBAL.COM
Out of the over 4k publicly listed companies in the US, 500 of these contain 80% of the entire market capitalization. That’s impressive, and probably the reason Warren Buffet so strongly advocates for long-term investors to invest in cheap, S&P 500 Index funds like VOO.
VGT: MSCI US IMI IT 25/50 Index Explained
Vanguard’s VGT fund is information technology-obsessed. As stated from the fund’s prospectus, VGT “seeks to track the performance of a benchmark index that measures the investment return of stocks in the information technology sector.”
So what benchmark does it use? The MSCI US IMI Information Technology 25/50 Index (USD). That’s a mouthful! So what does this mean? Let’s go to the MSCI website to find out.
"The MSCI US IMI Information Technology 25/50 Index is designed to capture the large, mid and small cap segments of the US equity universe. All securities in the index are classified in the Information Technology sector as per the Global Industry Classification Standard.."
MSCI.COM
When you think about information technology, think Microsoft, Apple, NVIDIA, etc. When compared to VTI and VOO, VGT is much narrower in scope, containing only 342 stocks in its fund. However, this narrow breadth does not mean narrower profits; check out the below graph, comparing VGT (blue line) to the other two ETFs on our list over the past five years (which run together), ending in November of 2021.
VTI vs VOO vs VGT
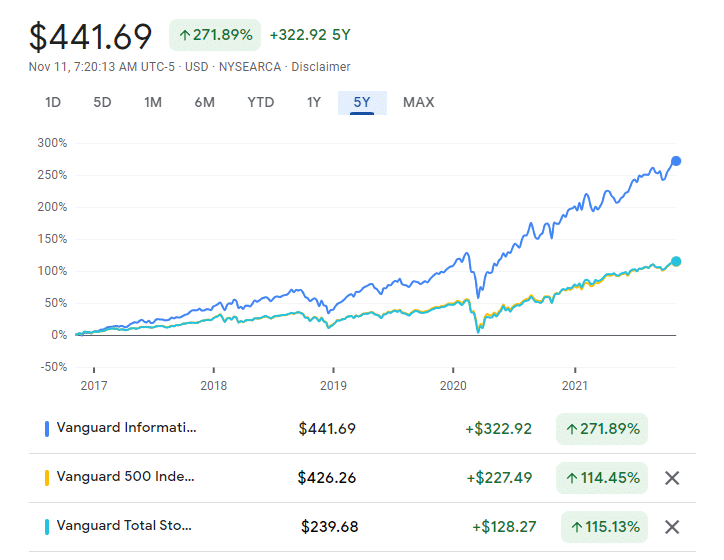
Chart from Google Finance
VGT is a great alternative to Invesco’s QQQ ETF, which charges a management of 0.20%, twice that of VGT. Additionally, VGT has been outperforming QQQ in recent years.
Let’s take a look at our funds’ different expense ratios next!
VTI vs VOO vs VGT: Comparing Fees
All of the expense rations for our three ETFs are incredibly low.
- VTI Expense Ratio: 0.03%
- VOO Expense Ratio: 0.03%
- VGT Expense Ratio: 0.10%
Bearing in mind that the average ETF fee is about 0.40%, they are all winners. An investor may be remiss to cut VGT out of their portfolio because of its slightly higher expense ratio; when you look at the performance of this ETF (which we touched on above, but will go into detail later), it is my opinion that VGTs meager 0.10% management fee is well earned.
VTI vs VOO v VGT: Sector Diversification
We touch briefly upon the different sectors our ETFs are invested in earlier. Let’s really drive that home now.
The below table shows the top sectors that VTI, VOO, and VGI invest in, respectively.
VTI vs VOO vs VGT: Comparing Top Sectors
| Sector | VTI | VOO | VGT |
|---|---|---|---|
|
Technology |
24.54% |
24.65% |
89.77% |
|
Financial Services |
13.88% |
14.09% |
8.12% |
|
Health care |
13.62% |
13.62% |
0.00% |
|
Consumer Cyclical |
11.81% |
12.11% |
0.00% |
|
Communication Services |
10.51% |
11.29% |
0.55% |
|
Industrials |
9.01% |
8.39% |
1.57% |
|
Consumer Defensive |
5.65% |
6.21% |
0.00% |
Data from Vanguard
VTI vs VOO v VGT: Largest Stock Holdings
So we know the sectors these different ETFs invest in, but what specific stocks do they invest in within these sectors?
The below table lists the largest 7 holdings of each ETF on our list.
VTI vs VOO vs VGT: Top Stock Holdings
| Rank | VTI | VOO | VGT |
|---|---|---|---|
|
1. |
Apple Inc. |
Apple Inc. |
Apple Inc. |
|
2. |
Microsoft Corp. |
Microsoft Corp. |
Microsoft Corp. |
|
3. |
Alphabet Inc. |
Alphabet Inc. |
NVIDIA Corp. |
|
4. |
Amazon.com Inc. |
Amazon.com Inc. |
Visa Inc. |
|
5. |
Facebook Inc. |
Facebook Inc. |
Mastercard Inc. |
|
6. |
Tesla Inc. |
Tesla Inc. |
PayPal Holdings Inc. |
|
7. |
NVIDIA Corp. |
NVIDIA Corp. |
Adobe Inc. |
Data from Vanguard
Notice how VTI and VOO have the same exact top 7 holdings. These ETFs are very similar in nature. Remember, the only difference between them is VTO includes small-cap stocks while VOO focuses only on large caps.
VTI vs VOO v VGT: Price Performance
Last up, let’s take a look at the historical price performances of our three ETFs.
Average Annual Performance- Quarter End
| Duration | VTI | VOO | VGT |
|---|---|---|---|
|
1-year |
32.04% |
29.96% |
29.81% |
|
3-year |
16.04% |
15.95% |
26.96% |
|
5-year |
16.88% |
16.86% |
28.63% |
|
10-year |
16.61% |
16.59% |
23.07% |
Data from Vanguard
Final Word
It’s impossible to pick a winner when comparing our three ETFs. Why? All of these funds have different risk profiles. In volatile times, VGT tends to decline faster than VTI and VOO, which perform very similarly. However, just the opposite is true in bullish markets.
In terms of sheer diversification, VTI is the clear winner.
Recommended Reading
